Introduction
Following the conclusion of the Civil War, the Grand Old Party (GOP) was in ascendance. Led by supermajorities in both chambers of Congress, Republican leaders sought to remake the social fabric of the nation through a radical reconstruction of the former Confederate South. While meaningful civil and voting rights reforms would be made to enfranchise and elevate blacks, the “Radical Republican” vision for a colorblind society would be short lived. Within a decade, the white South—embodied in the Democratic Party—rose up and wrested control of all state governments in the former Confederacy. With the Compromise of 1877, the national Republican Party began to slowly move away from their Reconstruction-era goals. And by the turn of the twentieth century, with disfranchisement laws spreading throughout the South, the GOP had all but conceded the region to the Democrats, with one-party Democratic rule becoming the status quo for the next three generations.
Scholarship on Republican Party politics has little to say about the GOP's role or makeup in the South after Reconstruction. Aside from some works that examine the national party's ill-fated “retreat” from its radical vision during the Gilded Age,Footnote 1 research on Southern Republicanism is largely limited to the post–World War II era—specifically, the decades following the passage of the Voting Rights Act of 1965, when a realignment of the white South helped create a new (and vibrant) Republican Party in the ex-Confederate states.Footnote 2 This is not surprising, as the GOP had almost no congressional presence in the South after Reconstruction—with the small number of Republican House seats drying up almost entirely by 1900—and Republican presidential candidates generally failing to capture electoral-college votes in the South between 1880 and 1948.Footnote 3
While it is true that the GOP's Southern wing had no meaningful impact on national political outcomes after Reconstruction, it did retain a level of influence in one respect—within the party itself. That is, the South continued to play a role in the Republican National Convention, with Southern delegates maintaining their seats and voting rights—and most importantly, their ability to choose the GOP's presidential candidate. Indeed, for a time, the South commanded around a quarter of Republican convention delegates, even as it lacked the ability to wield influence for the GOP on Election Day.Footnote 4 This continued convention presence is relevant in two ways. First, it allowed Southern states to be pivotal in some Republican presidential nomination contests long after they ceased to matter on the national stage.Footnote 5 Second, it provided some level of ongoing political representation for blacks, as they were increasingly excluded from participating in other forms of democratic politics back home.
But while Southern states would maintain substantial representation at Republican National Conventions, black southerners would not. Research has shown, though mostly anecdotally, that struggles between two groups of Republicans—the Black-and-Tans and the Lily-Whites—in the late nineteenth century and early twentieth century resulted eventually in the exclusion of black Republicans from the Southern GOP.Footnote 6 The Black-and-Tans were the descendants of the Reconstruction-era GOP, and were composed of blacks and (a minority of) whites who supported a more inclusive party. The Black-and-Tans fought to keep the legacy of Reconstruction alive, by stressing the need to preserve the rights of blacks—especially in the face of intimidation, violence, and legal maneuvers to disfranchise and segregate. The Lily-Whites sought to restrict party membership to whites only, while distancing themselves from Reconstruction-era efforts to ensure and protect civil and voting rights for blacks. In short, the Lily-Whites espoused white supremacy, based in part on the argument that the only way the Republican Party could become electorally competitive again in the South (once disfranchisement laws were the norm) was by becoming an all-white party.
Understanding these post-Reconstruction racial divisions within the Southern GOP is important, we argue, for two reasons. First, the Lily-White takeover of the Republican Party in the South effectively closed off the last remaining avenue for meaningful political participation for black southerners during the era. Second, Lily-Whiteism may have spurred the Republican Party's reemergence in the second half of the twentieth century. That is, by becoming a “white party,” the GOP may have put itself in a position to actively compete for white Southern votes after the national Democratic Party's active embrace of civil rights during the 1950s and beyond.
Despite the importance of the Black-and-Tan versus Lily-White conflict, little scholarly attention has been given to it. Existing studies on the topic, which are sparse and cursory in description, have suggested that presidents and other national party leaders often shifted their alliances between the two rival organizations, based on perceived strategic advantages (i.e., by discerning which group could be more easily or cheaply “bought”). This research has held that the Lily-Whites took control of most Republican state party organizations in the late nineteenth century, with an additional wave of Lily-Whiteism occurring during President Herbert Hoover's administration.Footnote 7 But when and how this conflict between the Black-and-Tans and Lily-Whites played out specifically across Southern states does not exist. Work is thus needed to more systematically examine the rise of the Lily-Whites and analyze how their conflict with the Black-and-Tans affected black political representation in the South, Republican Convention politics, and Southern GOP development more generally.
In this article, we present new data that track the racial composition of Republican convention delegations in Southern states from 1868 through 1952. These data—which match individual Southern delegates to original census forms, thereby allowing us to identify the racial composition of each state's delegation—provide crucial insights into the development of Lily-Whiteism across the South. Importantly, these data—for the first time—allow us to identify when particular state delegations became Lily-White dominated and which states managed (for a time) to buck the Lily-White trend.
To assess whether the “horserace” between Black-and-Tans and Lily-Whites actually affected the party's electoral performance in the region, we use the percentage of white convention delegates in a state by election year (lagged) as a proxy for the perceived “whiteness” of the Republican Party. We call this variable the Whiteness Index and incorporate it as the key independent variable—conditioned by the onset of Jim Crow–era disfranchisement—in a regression model to explain electoral support for the Republican Party. In so doing, we are able to test the Lily-Whites’ “respectability” thesis—did the white electorate begin to support the Republican Party in the South once the GOP leadership (as proxied by Republican convention delegates) took on a Lily-White cast? We find the answer to this question is yes: The “whitening” of the Republican Party in the South led to a significant increase in the GOP's vote totals. And this increase manifested not just in presidential elections, but in congressional and gubernatorial elections as well, most notably outside of the Deep South. This suggests that the whitening of the party was an important first step toward making the GOP a viable electoral choice for white southerners, and set the stage—given other necessary conditions—for the Republican Party to become a dominant force in contemporary Southern politics.
The Onset of Redemption and the Creation of a Southern GOP Divide
In the immediate aftermath of the Civil War, national leaders were confronted with the question of how to create a “reunion” with the eleven states that seceded from the United States and formed the Confederacy. President Andrew Johnson sought a swift reconciliation, which would have empowered the former white elite in the South and severely hampered the political and economic progress of Southern blacks.Footnote 8 Congressional Republicans rejected Johnson's moderate reconciliation plan and devised a more “radical” version, which would place Southern blacks on equal civil and political footing with Southern whites. The Civil Rights Act of 1866 provided citizenship rights to blacks, and the 14th Amendment broadened these citizenship rights and created new federal civil rights that could be enforced by the federal courts. Johnson fought each of these initiatives to no avail, and the Congressional Republicans saw their hand strengthened by a strong pro-GOP tide in the midterm elections of 1866. Emboldened, the radical faction of the GOP took control of Southern Reconstruction policy, establishing voting rights for blacks (via the 15th Amendment) and designing a plan for the readmission of the Southern states back into the Union. The latter policy, instituted through a series of Reconstruction Acts, established five military zones in the former Confederate states and charged the U.S. Army with overseeing elections.Footnote 9
Radical Reconstruction had positive effects initially for the Republican Party. Once enfranchised and protected by the military during the voting process, blacks turned out for the GOP in large numbers. Their support, combined with some initial suffrage limitations for former (white) Confederate combatants, helped establish a Republican beachhead in the South. The GOP took control of the various Southern state governments, and won Southern state majorities in both the House and Senate. The Southern GOP during this time was composed of three types: blacks, carpetbaggers (whites who had emigrated from the North), and scalawags (white southerners, many of whom were former Democrats). Often, blacks were the foot soldiers in the Southern Republican movement, with whites (either carpetbaggers or scalawags) filling prominent political roles. But blacks also held positions of leadership within the party, especially at the state level. Between 1870 and 1876, for example, 633 blacks were elected to the various state legislatures, fifteen to the U.S. House, and two to the U.S. Senate.Footnote 10
Yet, the GOP did not enjoy the fruits of Reconstruction for very long. As suffrage and office-holding restrictions on the white populace were eliminated, and as white opposition to Republican rule increased—in the form of intimidation of and violence toward blacks by paramilitary groups like the White League, the Red Shirts, and the Ku Klux Klan—the GOP's beachhead in the South began to erode. The Democratic Party aggressively counter-mobilized, painting the Republican organizations as corrupt and illegitimate, and regained political control in Tennessee in 1869 and in Georgia, North Carolina, and Virginia in 1870. Four years later, Alabama, Arkansas, and Texas were “redeemed” by the Democrats, and Mississippi followed a year later. In 1877, the Democrats reclaimed the final three Southern states—Florida, Louisiana, and South Carolina—following the conclusion of the disputed presidential election of 1876.
As Rutherford Hayes began his presidency in 1877, he and other national Republican leaders felt under fire. The party had appeared dominant as recently as 1872, when President Ulysses Grant won an easy reelection and the GOP controlled both chambers of Congress. However, an economic panic in 1873, tied to a railroad over-expansion following the Civil War, ushered in a depression that lasted until the end of the decade—and helped Democrats take majority control of the U.S. House following the 1874 midterms. By 1877, the Republicans had barely held onto the White House—and did so, many believed, via an explicit deal (the Compromise of 1877) that ended the military oversight that remained in Florida, Louisiana, and South Carolina and thereby conceded the governments in those states to the Democrats.Footnote 11 Now, the GOP had to reassess its position and develop a new strategy going forward, lest the Democrats continue to make gains and drive them from power altogether.
The strategy Hayes proposed was to rebuild the Republican brand in the South around the “Whiggism” of years past. Specifically, Hayes sought to recreate Southern Republicanism around issues of economic development, rather than civil rights, and in so doing hoped to convince white southerners that their futures were better invested in the GOP than the Democratic Party.Footnote 12 Such a policy was not predicated on a rejection of blacks and their concerns, but rather was a pragmatic response to the reality that a mostly black party in the South—amid attempts to limit blacks’ participation—was untenable as a long-term winning strategy. In effect, Hayes sought to shift the focus away from race and make the case that “the South” as a society (or region) had more to gain from Republican economic policies than similar Democratic policies. To give this new policy teeth, Hayes made a concerted effort to bestow Southern Democrats with executive patronage—as a way to build good will and potentially shift allegiances. For example, Hayes appointed David Key (of Tennessee) as postmaster general, thus allowing Key discretion to make a host of postmaster appointments—most of which went to Southern Democrats.Footnote 13 This was a blow to the existing Republican organizations in the South, which normally would have been the beneficiary of this executive windfall.
In the end, Hayes's “New Departure” strategy proved to be a failure. Southern Democrats gladly took the patronage offered to them, but continued to spurn the GOP and hold it in contempt. One reason was that Hayes's attempt at relabeling the Republican “brand” was not persuasive. From a white Southerner's perspective, the GOP was the “black party”—and, more specifically, the party that elevated blacks to the level of whites (or above the level of whites, in the minds of many Southern Democrats) by force, at the point of a bayonet. Any whites that belonged to such a party—per this view—were either Yankee opportunists (carpetbaggers) or Southern traitors to their race (scalawags). As a result, “respectable” Southern whites could not envision becoming Republicans, Hayes's efforts notwithstanding, as the GOP brand was established and invariant—and would shower shame and scorn on anyone taking up the Republican mantle. It was conceivable, some held, that a Whiggish Republican brand could have been established in the South after the Civil War, and efforts to create a party around (1) white businessmen, (2) yeoman white farmers, and (3) blacks—in opposition to the white planter class—might have been successful.Footnote 14 But the military-led Reconstruction of the South created a general anti-GOP identity among Southern whites (irrespective of economic interests) that would prove impervious to new Republican entreaties.Footnote 15
As the presidency shifted from Hayes to James Garfield and Chester A. Arthur (after Garfield's assassination), the GOP strategy vis-a-vis the South changed, but only in degree, not in kind. That is, it was clear that Hayes's dalliance with white Southern Democrats was not successful. However, a segment of the white South—comprising those forced into taking on the Democratic label because of the “stain” of Republicanism—was unhappy with the conservative policies of the “Bourbon” Democratic establishment. This populist element emerged in the late 1870s and early 1880s, and ran as Independents. And in their identity as Independents, they were able to align with the Republicans in “fusion” arrangements to seek electoral success and share in the spoils of office. In effect, some whites discovered that they could claim another partisan identity and collaborate with Republicans—and be successful.
Garfield and especially Arthur were open to aligning with the Independents, as a way to break the solid Democratic South.Footnote 16 They believed winning white votes was necessary to make inroads in the South and saw the Independent movement as a viable solution; but whereas Hayes tried to convince Democrats to switch to the GOP, Garfield and Arthur saw fusion as an easier road to hoe. The prototype for a fusion arrangement was in Virginia, as the Readjusters (led by William Mahone) took control of the state legislature and elected a U.S. senator (Mahone himself) in 1879; two years later, they elected a governor and a second U.S. senator.Footnote 17 The Readjuster movement led to other populist movements across the South, and Garfield and Arthur saw this as the key toward rebuilding Republican influence in the former Confederacy. To promote fusion, Garfield and Arthur used the carrot of executive patronage.Footnote 18 Garfield sought to split such patronage between the Independents and regular Republican organizations, while Arthur was willing to hand over full patronage authority to the Independents.Footnote 19 These fusion efforts bore some fruit in 1882, with some GOP gains (thanks largely to Readjuster success in Virginia) in the U.S. House, but largely melted away in 1884.
As national Republican leaders increasingly focused on winning the votes of white southerners, organizational GOP politics in the South evolved. The old arrangement of blacks, scalawags, and carpetbaggers, which had been the key to Republican success during Reconstruction, increasingly displayed rifts. White Republicans in various states began to complain about “Negro domination” and made the case that the only reasonable (and realistic) future for a Southern GOP was to recast the brand around a more respectable image—that of “whiteness.” That is, as this argument went, the only way that the GOP in the South would become an electorally viable entity once again would be to increase its white membership—but that was only possible by making the party more hospitable to whites. And a party composed of blacks, especially one where blacks held leadership positions, was anathema to “upstanding” Southern whites. Thus, as the Southern GOP foundered in the 1880s, new strategies were floated, and many national Republican leaders and northern intellectuals saw advantages in a Southern wing that moved away from its Reconstruction roots and composition.
The Lily-White movement—which sought to eliminate blacks from positions of leadership in the Republican Party—officially started in Texas, when in 1886, Norris Wright Cuney, a black Republican, was elected state party chairman.Footnote 20 White Republicans, who had been feuding with blacks in the party since the late 1870s, resented Cuney and rejected any black holding such a leadership role. In 1888, at the state party convention in Fort Worth, they fought to expel several black delegates, and proceedings degenerated considerably thereafter.Footnote 21 Cuney held onto his position, but the general Lily-White versus Black-and-Tan feud in Texas began spreading to other states in the South.Footnote 22 This was due, partly, to the white supremacy arguments discussed earlier. However, it was also the case that Lily-White organizations emerged as a way for Southern whites to vie for influence, when such influence was harder to achieve by working within traditional Southern GOP organizations—where blacks had played an active and meaningful role for a generation.
And the influence that Southern Republicans could hope to realize changed as the twentieth century drew near. Electoral viability declined outside of a few states (like North Carolina and Virginia) in the late 1880s and the 1890s, as Democrats cemented their control. Then, a pivotal institutional change was made at the state level, first by Mississippi in 1890 and then by the other states of the former Confederacy by 1908.Footnote 23 A series of disfranchisement provisions—such as literacy tests, residency requirements, and poll taxes, among others—were put in place, based on changes to the state constitution, which severely restricted the voting rights of blacks (and many poor whites).Footnote 24 The result of these restrictions was that black registration and turnout rates dropped significantly, to the point of effectively wiping out blacks as a voting bloc in some areas. And as blacks made up the bulk of Republican voters in most places in the South, the disenfranchising provisions drove the GOP's electoral viability in Dixie to zero.
Following the Democrats’ formal disfranchisement efforts, the Southern wing of the GOP remained relevant in only one respect—within the Republican National Convention itself, specifically in the choice of the GOP presidential nominee. That is, by the 1890s, as the Democrats securely locked down the electoral arena in the South, the only benefits that a Southern Republican could hope to achieve were limited to patronage and side payments associated with presidential politics. Thus, Lily-White and Black-and-Tan factions began to ignore organizational issues at home—like what the composition of the Southern GOP should be—and increasingly fought over the more pragmatic issue of which group should represent their states at the national convention. And national Republican leaders also began to ignore organizational issues in the South—and thus largely conceded the region to the Democrats in the aftermath of the widespread disenfranchising initiatives—and increasingly saw the Southern states as a set of “rotten boroughs.”Footnote 25
Thus, in the years surrounding the turn of the twentieth century, the Lily-White versus Black-and-Tan conflict routinely emerged in the run-up to the Republican National Convention, as well as at the convention itself. Battles over seating were common, as would-be delegates from each faction showed up and claimed to be the rightful occupants of the state's representational allotment. Presidential hopefuls vied for control of these delegates—through support at the seating stage or thereafter—with promises of executive patronage or straight side payments (bribes). The more strategic presidential hopefuls would get to work in the months before the convention, to get a jump on their rivals. William McKinley started this practice in 1896, by touring the South and meeting with representatives of both Republican factions.Footnote 26 McKinley and his immediate successors did not view the Lily-White versus Black-and-Tan dispute in principled terms—while they may have had opinions on the racial composition of the Southern GOP, those opinions were overridden by the more practical question of which faction could be more easily and cheaply corralled for convention purposes.Footnote 27
Data and Summary Statistics
To systematically measure the variation in the Black-and-Tan versus Lily-White conflict over time, we have collected data on the racial composition of delegations from the eleven ex-Confederate states to the Republican National Convention from 1868 through 1952. We argue that the conflict between the Lily-Whites and Black-and-Tans should have been fought largely with the prize of convention delegate seats in mind. Specifically, as voting restrictions took hold throughout the South and excluded nearly all blacks from voting or holding elected office, the GOP's electoral viability in the region withered away—and being a delegate to the national convention became the only remaining form of representative political office that most Southern Republicans could achieve. The racial composition of state GOP convention delegations in the South thus becomes a useful metric (and perhaps the only one) for assessing Lily-White versus Black-and-Tan control.
During this period, the names and hometowns of each delegate (both regular and alternate) seated at the Republican National Convention were published in the convention proceedings. Beyond these two basic pieces of demographic data, however, the proceedings do not provide any other information. Most importantly, they do not list the race of the individual delegates.Footnote 28 Hence, we turn to the U.S. Census, the most comprehensive data set that does identify the race of nearly all American citizens.
As required in the constitution, the census has been executed every ten years since 1790.Footnote 29 The role of the census has changed over time, from focusing predominantly on providing population counts to collecting other statistics about American citizens—leading to a more expansive list of questions. However, the three-fifths compromise (reached during the Constitutional Convention) meant that measuring the racial makeup of the American population was (and would continue to be) an essential part of the census's mission, from the first census onward.Footnote 30 While the exact racial classifications and language used on the forms have changed over time,Footnote 31 the census is the most consistent and reliable historical source for identifying the race of individual American citizens.Footnote 32
We have attempted to match each individual delegate listed in the convention proceedings to their original census forms. To do so, we used the online demographic aggregation search engine Ancestry.com, which allowed us to search for historical records based on the (limited) information we had for each delegate: name, residence, and the year in which the delegate lived in that town or city. Census records that matched on name and hometown, and for which the matching census respondents were of voting age at the time of the convention, were accessed, and the race listed on the census form was matched to the delegate. We tried to find other sources of information regarding the race of those delegates that we were unable to match to an original census form. Specifically, we looked for any references to the race of those particular delegates in primary or secondary historical sources.Footnote 33
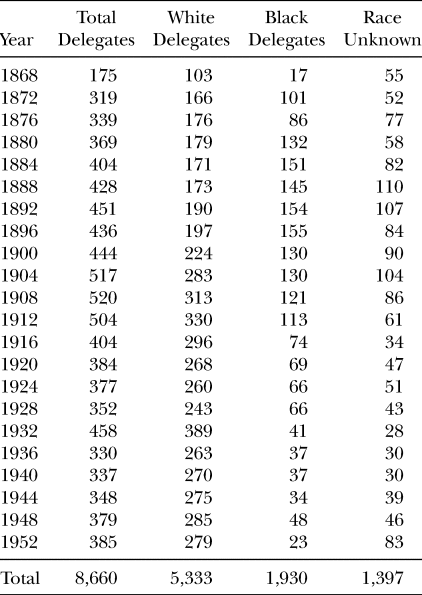
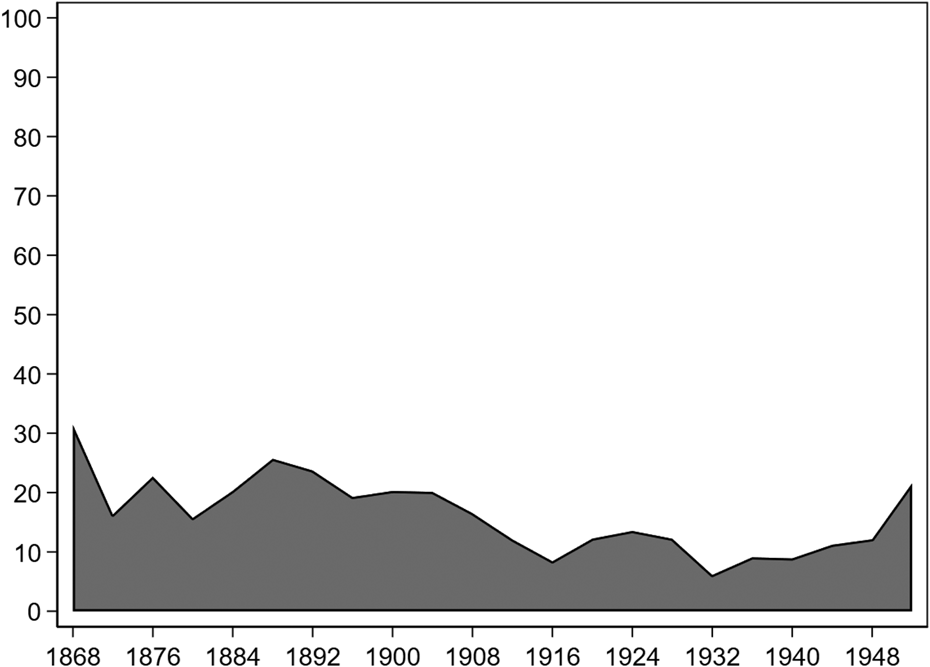
As Table 1 and Figure 1 illustrate, we were able to identify the race of almost 84 percent of the 8,660 delegates included in the data set. The extent of “unknown” racial identification (16 percent) is not surprising given the limited biographical information in the proceedings: For example, a date (or even year) of birth for each delegate would dramatically increase the number of matching census forms, but the proceedings do not provide this information. Additionally, potential misspellings of names or hometowns in the proceedings or the census forms, or both, complicated the matching process further. Finally, with the exception of those elections that occurred in a year during which a census took place, there is also a two- or four-year gap between the information provided in the proceedings and the most recent census: It is likely that some percentage of delegates may have moved inside or outside their state in that time, or may have died.Footnote 34
Racial Division of Southern GOP Convention Delegates, 1868–1952

Percentage of Southern GOP Delegates without Racial Identification, 1868–1952.

The number of delegates that could not be matched to a corresponding census form is also hampered by problems related to the 1890 census, which was the first to be counted and tabulated using electronic machines. As a result, no copies were made of the original census forms. A subsequent fire in 1921 in the Department of Commerce, where the 1890 census documents were stored outside of a fireproof vault, destroyed nearly all of the original forms.Footnote 35 For our purposes, this means that the data for delegates to the 1888 and 1892 conventions are particularly scarce. That is not to say that no data are available at all: Delegates who were present at earlier or later conventions are frequently covered in the 1880 or 1900 census. Nonetheless, the percentage of delegates for whom we cannot identify race is highest for these two convention years (see Figure 1).
While we would like to have racial categorizations for all Republican convention delegates, we have no reason to believe that the racial breakdown of the unknown category is biased in any way. Thus, we feel comfortable setting aside the unknowns and focusing strictly on the delegates with known racial identities from here on out.
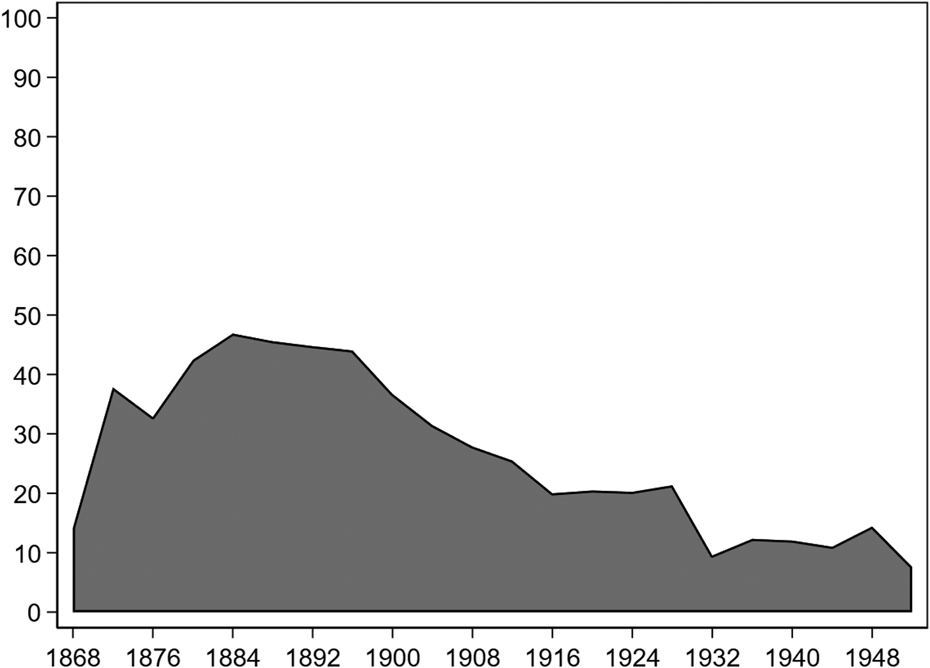
In Figure 2, we plot the percentage of Southern GOP convention delegates that were black (based on the summary statistics in Table 1). These data largely confirm the traditional perspective of the Lily-White takeover of the Southern Republican organizations in the late nineteenth and early twentieth centuries (and their success at slowly but surely pushing blacks out of the party in the decades that followed). While never constituting a majority, blacks consistently represented between 40 and 50 percent of Southern delegates at Republican National Conventions between 1880 and 1896. However, starting with the 1900 convention (the first after the realignment election of 1896), the percentage of black delegates began to drop considerably. Between 1916 and 1924, only around 20 percent of Southern GOP delegates were black. While the number increased slightly for the 1928 convention, black convention attendance suffered a lasting drop beginning with the 1932 convention. This decline can be attributed to the general development of Lily-White challenges across the South—initiated with President Herbert Hoover's blessing—which resulted in a dramatic change of fortunes for black representation.Footnote 36
Percentage of Southern GOP Convention Delegates that Were Black, 1868–1952.

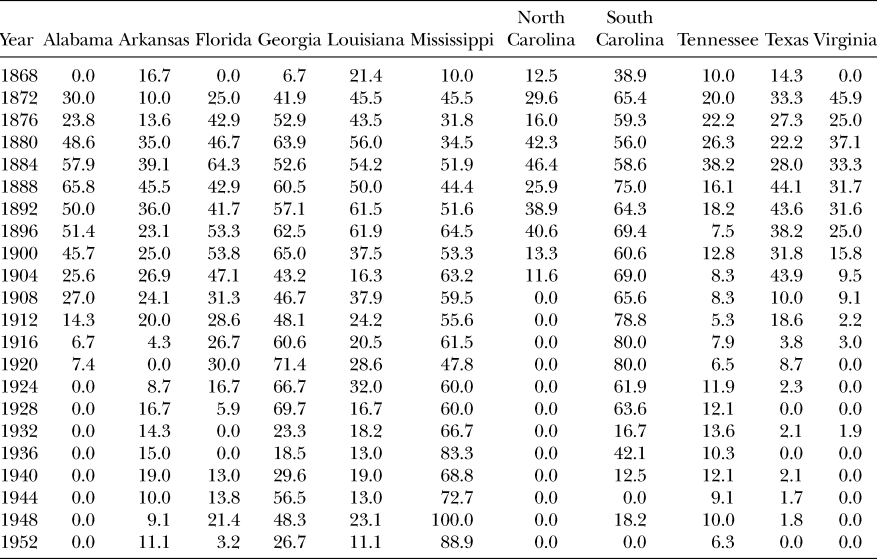
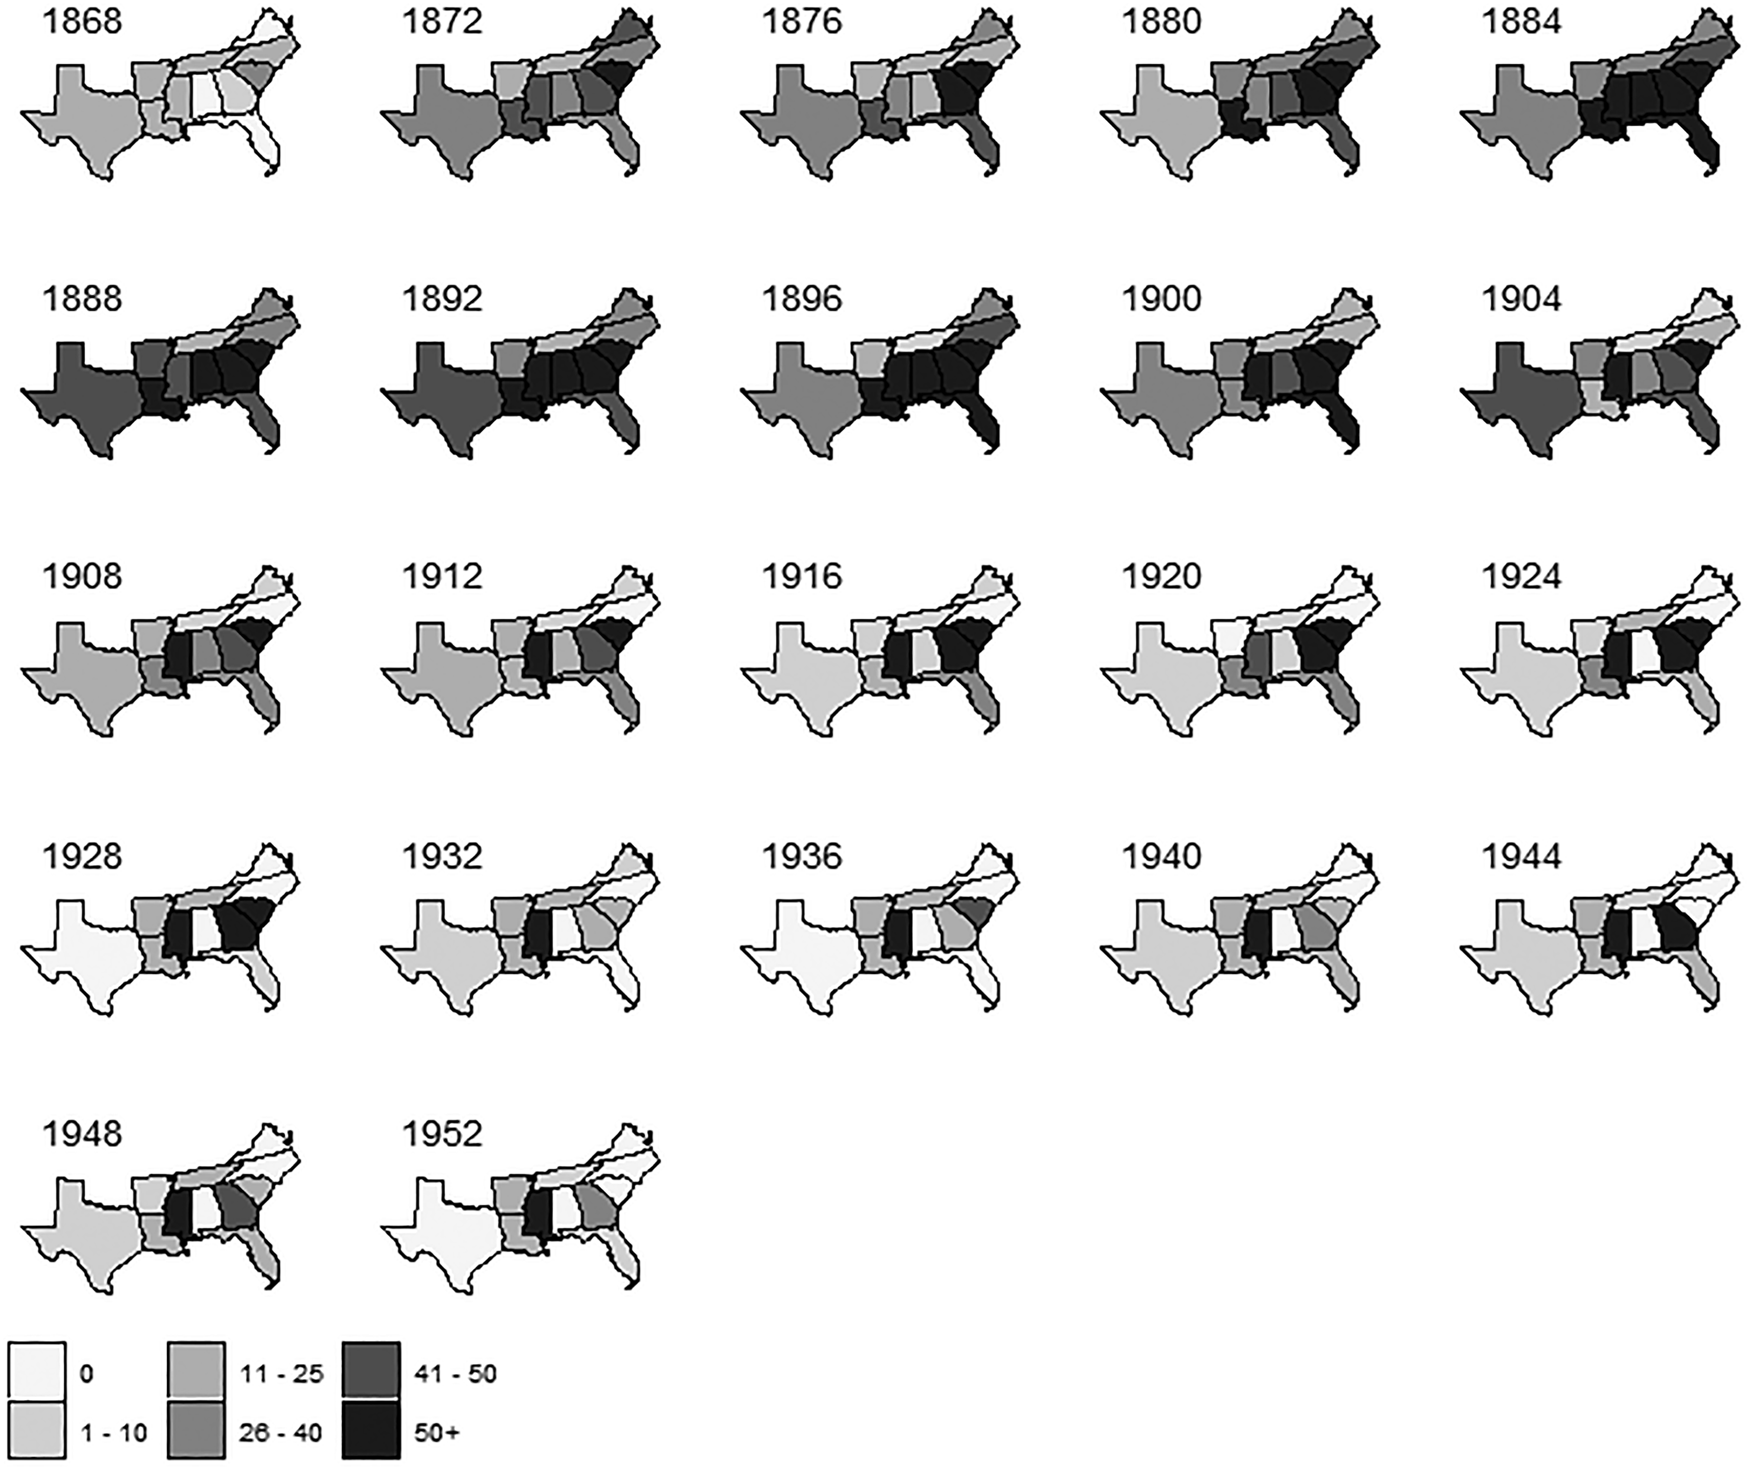
However, as can be seen in Table 2 and Figure 3, these summary statistics disguise a set of important state-by-state distinctions: Some states moved toward Lily-Whiteism considerably earlier, while others managed to avoid the Lily-White development through most of the first half of the twentieth century (or even entirely).
Percentage of Southern GOP National Convention Delegates that Were Black, 1868–1952

Notes: Percentages reflect known delegates only.
Percentage of Southern GOP Convention Delegates that Were Black, 1868–1952.

Four states—Arkansas, Tennessee, Louisiana, and Florida—had relatively low levels of black representation in their GOP convention delegations throughout the twentieth century. In Tennessee, black representation was always low—hitting a high point of just 38.2 percent in 1884—but blacks still remained a (small) minority part of the state's delegations throughout this period. Arkansas maintained a sizeable black representation in the late nineteenth century, peaking at 45.5 percent in 1888, but declined slowly thereafter—to the point where blacks disappeared entirely from the state delegation in 1920. Some degree of racial compromise emerged thereafter, but blacks remained a small proportion of the delegation (never rising even to 20 percent). Similarly, Florida's delegation in the nineteenth century was generally between 40 and 50 percent black—and over 50 percent in three conventions through 1900. Beginning in 1908, however, black representation started to decline, and after 1920 (with the exception of 1948) the Florida delegation was never more than 20 percent black. Finally, in Louisiana, blacks dominated in the nineteenth century: Between 1872 and 1896, blacks made up between 43 (in 1876) and 62 percent (in 1892) of the state's delegation. However, in 1900, black representation dropped to 37.5 percent. While whites were consistently the majority thereafter, some blacks remained in the Louisiana delegation in all subsequent conventions.
Unlike Arkansas, Tennessee, Louisiana, and Florida, many Southern states saw a period of significant black representation followed by major decline. For example, four states—Alabama, North Carolina, Texas, and Virginia—all at some point had GOP convention delegations with meaningful black representation, which dropped off considerably and permanently (or nearly so) in the late nineteenth and early twentieth centuries. For example, Alabama went from a high of nearly 66 percent black in 1888 to 27 percent in 1908. Black representation in subsequent conventions continued to drop until 1924, when no black delegates represented the state—which was the status quo thereafter. A similar pattern occurred in North Carolina, where as late as 1896 black representation was more than 40 percent; by 1908, it was zero, where it would remain from then on. In Texas, black representation was nearly 44 percent in 1904; it dropped markedly after that, to single digits (and sometimes zero) starting in 1916. Virginia saw considerable black representation early on (45.9 percent in 1872), but from 1880 on, black representation dropped steadily; by 1904, it would hit single digits, and starting in 1920—except for a small blip up in 1932—it was zero thereafter.
In contrast, three states—South Carolina, Mississippi, and Georgia—mostly bucked the trend of Lily-Whiteism. In South Carolina, Lily-Whites did eventually take over the state's GOP delegation, but not until 1932. In every convention between 1872 and 1928, blacks made up at least half—and as much as 80 percent—of the state delegation. In Georgia, black influence waxed and waned over the period, with blacks composing a majority of the state delegation from 1876 through 1900, again from 1916 through 1928, and yet again in 1944. Mississippi was even more unique; unlike any other Southern state, the Lily-Whites never displaced the Black-and-Tans during this period.Footnote 37 In fact, between 1892 and 1952, Mississippi's delegation was majority black with only one exception (1920, when 47.8 percent of delegates were black).
The Lily-White Movement and the Development of the Southern GOP
Beyond categorizing the racial makeup of Southern state delegations to the Republican National Convention from 1868 to 1952, as a way of documenting how the composition of the GOP in the South changed over time, we believe that these data provide a means to examine something bigger—namely, how the GOP emerged as a viable electoral party in the last half of the twentieth century. In this way, per the claim made by Lily-White leaders from the faction's inception, the battle between the Black-and-Tans and Lily-Whites was not just about executive patronage (and who would receive it), but it was also about whether the Republican Party would develop as a viable alternative for the Southern (white) electorate in the Jim Crow era.
More concretely, Lily-White leaders argued that with the emergence of voting restrictions (such as poll taxes and literacy tests) between 1888 and 1908 across the South, which successfully disfranchised a large majority of black voters, the GOP's only recourse—if it wanted to win elections in the new electoral environment—was to be an exclusively white-led party. Indeed, C. Vann Woodward argues that Lily-White leaders favored the adoption of voting restrictions, stating that “The Lily-white faction … more or less openly welcomed the [disfranchisement] movement in the belief that the removal of the Negro would make the party respectable.”Footnote 38 And “respectability,” in this case, was synonymous with “white.”Footnote 39
This belief—that Southern whites would only support a party that was white in makeup—was not just the thinking of Lily-White GOP leaders of the time. It was also the thinking of some white Democrats in the South. More than that, white Southern Democrats feared that state Republican organizations would be taken over by the Lily-Whites—because such a takeover, in their minds, would constitute a threat to white supremacy, Democratic hegemony, and the one-party system that emerged in the South after black disfranchisement. Thus, where and when possible, white Democratic leaders in the South worked to prevent Lily-Whites from gaining control of the Republican Party. And, here, a case is instructive—that of Mississippi.
From the Grant era through the Coolidge era, the Black-and-Tans controlled the Mississippi GOP and consistently selected delegations to the Republican National Convention that were majority black. In the late 1920s, however, Black-and-Tan control was threatened for the first time.Footnote 40 A Lily-White faction in the state had emerged, and it received strong financial backing from important Mississippi businessmen. And Perry Howard, who was black and the leader of the Black-and-Tans (and boss of the Mississippi GOP), was under indictment for selling federal patronage appointments (notably, federal marshal positions) and faced conviction. As a result, white Democratic leaders sprang into action. Colonel Frederick Sullens, editor of the Jackson Daily News, made clear what he believed was at stake: “A Republican party in Mississippi under the leadership of negroes offers no peril to white supremacy. A Republican party led by white men backed by almost limitless wealth and greed for power and prestige would constitute a decided menace.”Footnote 41 Key Democratic politicians in Mississippi—Governor Theodore Bilbo and U.S. Senators Pat Harrison and Hubert Stephens—along with the Grand Dragon of the Ku Klux Klan supported Howard's acquittal. Moreover, as Neil McMillan writes, “lily-whites complained that ‘influential Democrats,’ in order to keep the Republican party black and perpetuate Democratic rule, raised money for Howard's defense.”Footnote 42
These Democratic efforts produced the desired result: Howard was acquitted and remained the boss of the Republican Party in Mississippi. Twelve jurors—all white and all Democrats—found for Howard, and did so, according to Sullens, based on the belief “that if a Republican party is to exist in Mississippi it is better to have it under the leadership of negroes than white men.”Footnote 43 While the trial and overall federal scrutiny would cost Howard his career as a patronage broker, he would continue to guide the Mississippi GOP until 1960.Footnote 44 And the white Democrats in the state worked to ensure that this was so.
While these historical anecdotes are suggestive, the question remains: Was there in fact a systematic connection between the whiteness of the Republican Party and its electoral vote totals in the South? Were both Lily-White Republicans (out of hope) and Southern Democrats (out of fear) correct in making the linkage? The data on the racial makeup of Southern states’ GOP convention delegations offer an opportunity to examine these issues empirically. We believe that the whiteness—and hence, “respectability” in the vernacular of the time and place—of the Republican Party can be determined by examining the proportion of a state's Republican National Convention delegation that was white. We call this proportion—100 percent minus the percentages listed in Table 2—the Whiteness Index, which captures the white composition of a state's Republican Party by presidential-election year at a time when other systematic measures simply do not exist. As Republican National Convention delegates were chosen at state conventions, which were made up of delegates chosen from county and district conventions, the black-white ratios should reasonably approximate the racial breakdown of the party in the state.Footnote 45 Thus, this Whiteness Index provides a continuous measure—from 0 to 100—for all eleven Southern states in each presidential-election year from 1868 to 1952.Footnote 46
With our measure of whiteness established, we now investigate its relationship to GOP electoral support in the Jim Crow South. Specifically, we use the Whiteness Index (WI) as a key independent variable in the following regression equation:
 $$GOPvote_{st} = \beta _0\; + \beta _1WI_{st - 1} + \beta _2Disfranchisement_{st} + \beta _3WI_{st - 1} \times Disfranchisement_{st} + \alpha _s + \delta _t + \varepsilon _{st}$$
where GOPvote represents the dependent variable, or outcome to be explained. We will examine Republican Party vote percentage by state and year in several ways: at the presidential level, at the congressional level, at the gubernatorial level, and as a composite (an average of the former three).Footnote 47 We lag the WI one time period (presidential-election year), believing that four years was enough time for Southern voters to assess the “respectability” of the Republican Party when they went to the polls.Footnote 48 Thus, given the distribution of our convention data (1868 through 1952), our dependent variable extends from 1872 through 1956.
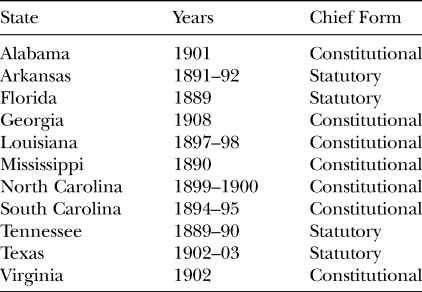
We also incorporate a Disfranchisement variable, which takes a value of 1 if voting restrictions (intended to disfranchise blacks) were in place, and 0 otherwise. These voting restrictions took various forms and were adopted in different Southern states at different times. Table 3, based on data collected by J. Morgan Kousser, summarizes disfranchisement provisions by state.Footnote 49 Some (like the grandfather clause) were eliminated in fairly short order, but most were in place during the entirety of our time period.Footnote 50 As black voters were the GOP's core constituency in the South after the Civil War, disfranchisement provisions should have significantly cut into the Republican Party's electoral vote totals (or β 2 < 0).
Disfranchisement Provisions in the South, by State and Year

Source: J. Morgan Kousser, The Shaping of Southern Politics: Suffrage Restriction and the Establishment of the One-Party South (New Haven, CT: Yale University Press, 1974). “Years” taken from page 239; “chief form” based on descriptions throughout the book. On the latter, see also Monroe Work, ed., The Negro Year Book (Tuskegee Institute, Alabama: 1931, 111–12).
A key variable will be the interaction of WI and Disfranchisement. This interaction allows us to examine how the whiteness of the Republican Party affected the GOP's electoral vote totals, once voting restrictions were in place and most black voters were effectively disfranchised. Prior to the onset of voting restrictions, during Reconstruction and Redemption, we should observe a negative relationship between WI and our measures of GOP vote percentage (or β 1 < 0). This is because black electoral participation, and support for the Republican Party, should be reflected in a greater proportion of black delegates serving as Republican National Convention delegates. After the adoption of voting restrictions, however, black electoral participation approached zero in much of the South. Thus, for the GOP to regain electoral support, it had to come from the eligible electorate—Southern whites. And Southern whites, per our hypothesis about respectability, would only consider voting Republican if the GOP took steps to cast itself as a white party. And the GOP did this in a visible way, by making sure that its public leaders—such as Republican National Convention delegates—were exclusively (or nearly so) white. Thus, after the onset of voting restrictions, we should observe a positive relationship between WI and our measures of GOP vote percentage (or β 3 + β 1 > 0). Finally, we include fixed effects to control for unobserved variation at the state level (α s) and by presidential-election year (δ t).
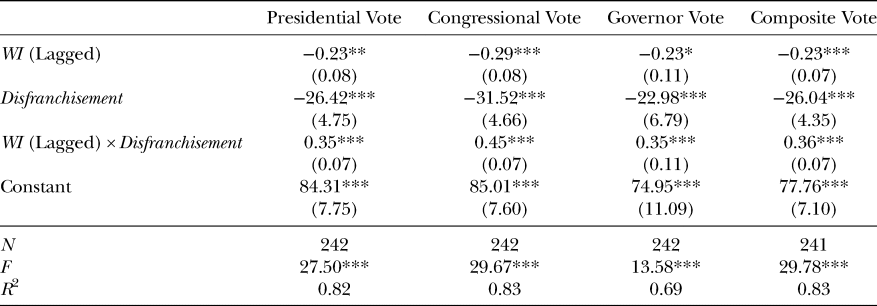
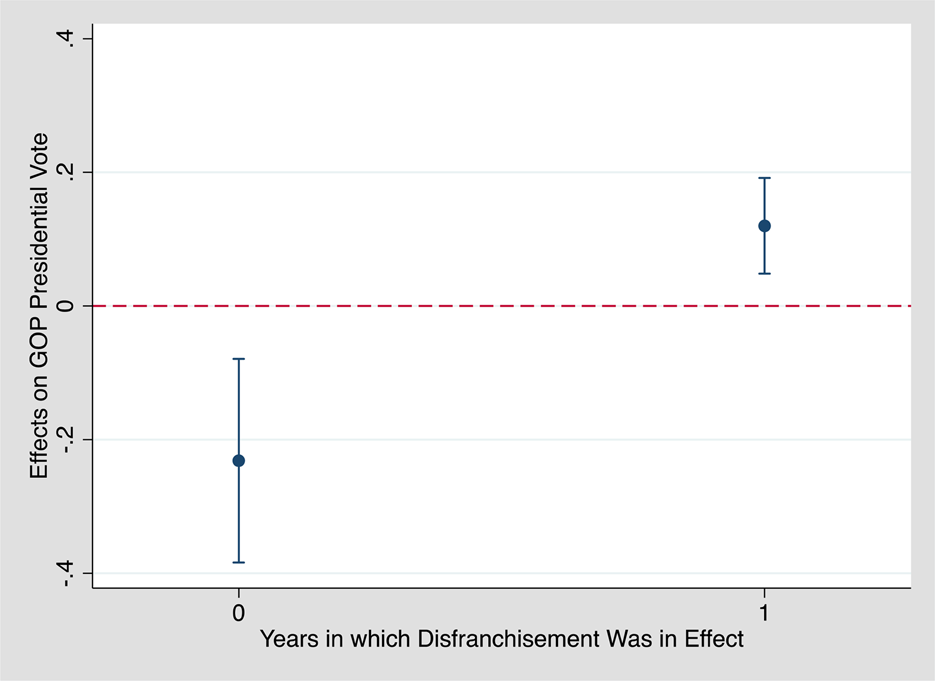
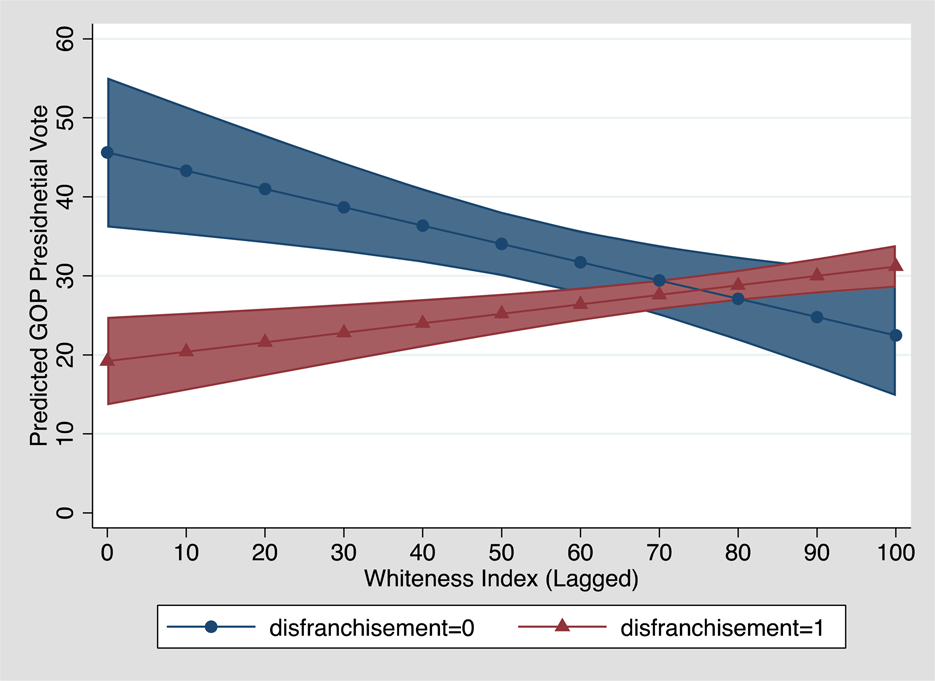
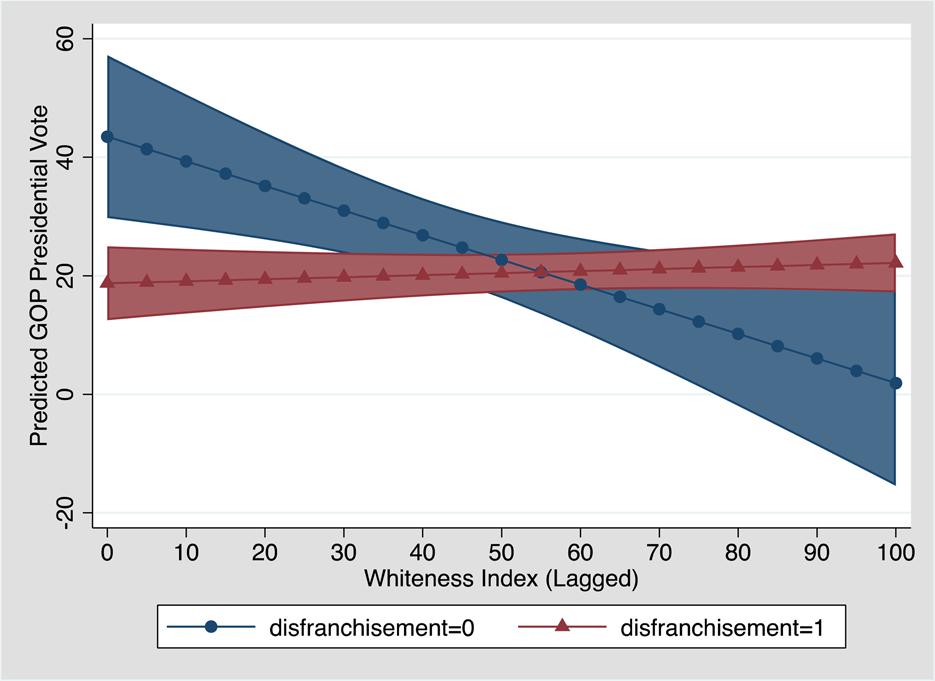
Ordinary least squares (OLS) regression results appear in Table 4, in four columns. We find evidence to support all of our hypotheses—regardless of which dependent variable we use. First, the years in which disfranchising provisions were in effect had a significant, negative effect on the average Republican vote tally—reducing the GOP vote by 26 to 31.5 percentage points. This decline can likely be interpreted as the near elimination of the black vote in the South. Second, the relationship between the whiteness of the Republican Party and its share of the vote is consistent with our hypotheses: negative and significant before the advent of voting restrictions and positive and significant after. For ease of interpretation, we explore this relationship visually in Figures 4 and 5, based on the first column of regression results (presidential vote).
Estimating Republican Electoral Support in the South, 1872–1956

Notes: OLS coefficients with standard errors in parentheses. All models include both state and presidential-year fixed effects (excluded categories: Virginia, 1872).
*p < .05, **p < .01, ***p < .001.
Average Marginal Effects of Whiteness Index (Lagged) on GOP Presidential Vote.

Predicted GOP Presidential Vote by Level of Whiteness Index (Lagged).

The average marginal effects of WI (Lagged) on GOP presidential vote are illustrated in Figure 4. Prior to disfranchisement, there was a −0.23 percentage-point change (p < .01) in GOP presidential vote for a 1 percentage-point increase in WI (Lagged). After disfranchisement, there was a 0.12 percentage-point change (p < .001) in GOP presidential vote for a 1 percentage-point increase in WI (Lagged). The predicted GOP presidential vote by level of WI (Lagged) is illustrated in Figure 5. The two data series cross, based on their negative (before disfranchisement) and positive (after disfranchisement) slopes. After voting restrictions were in place, a change from 1 standard deviation below the mean WI (Lagged) to 1 standard deviation above it resulted in a 5.38 percentage-point increase in GOP presidential vote.Footnote 51 This represents one-third of a standard deviation change in GOP presidential vote.Footnote 52
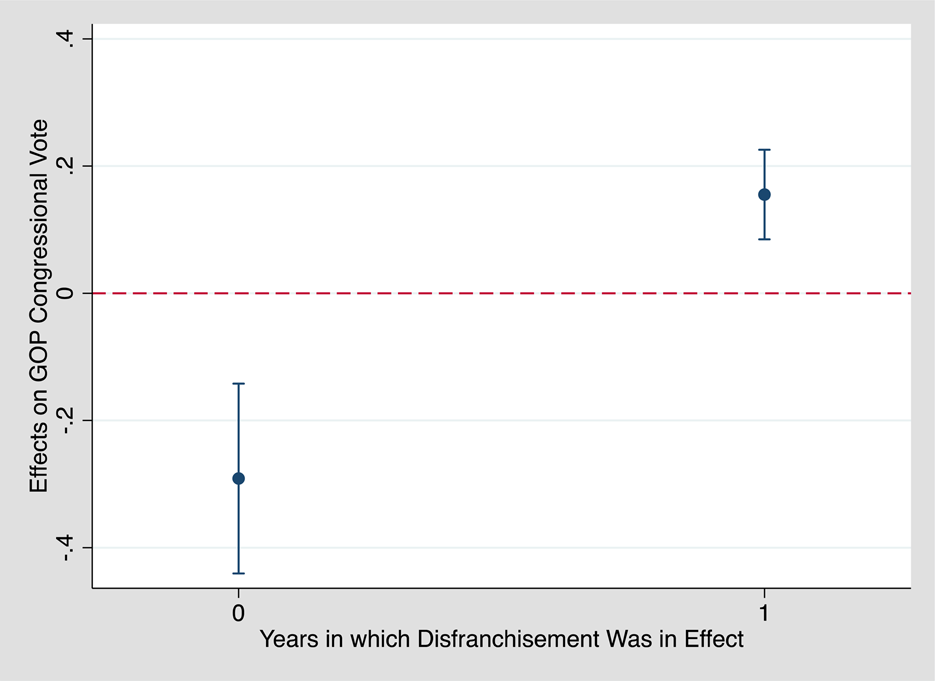
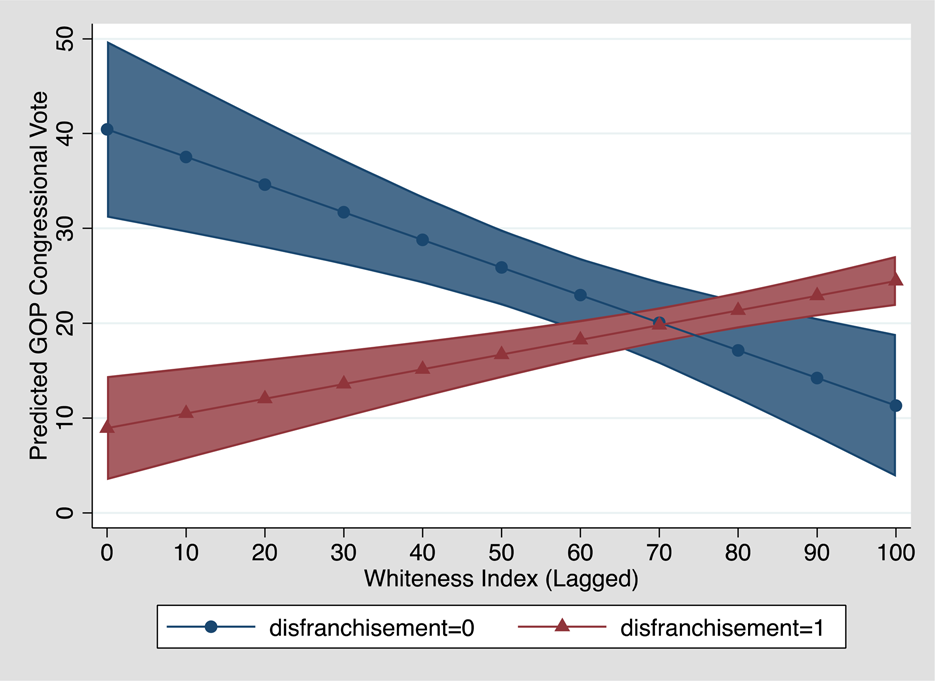
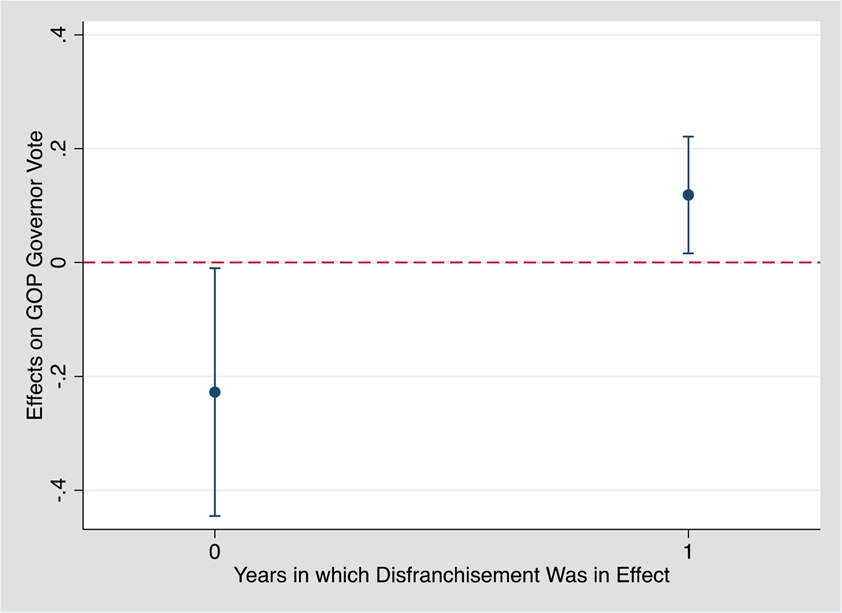
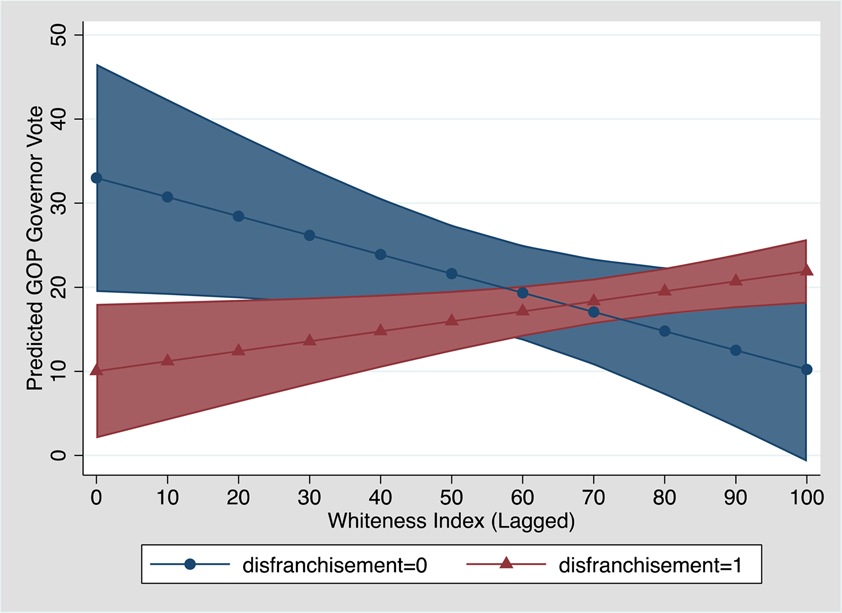
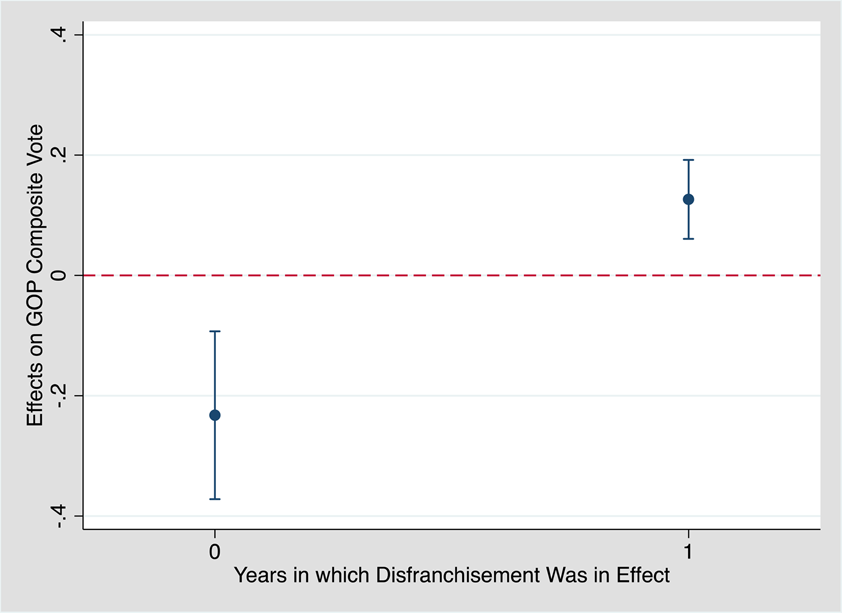
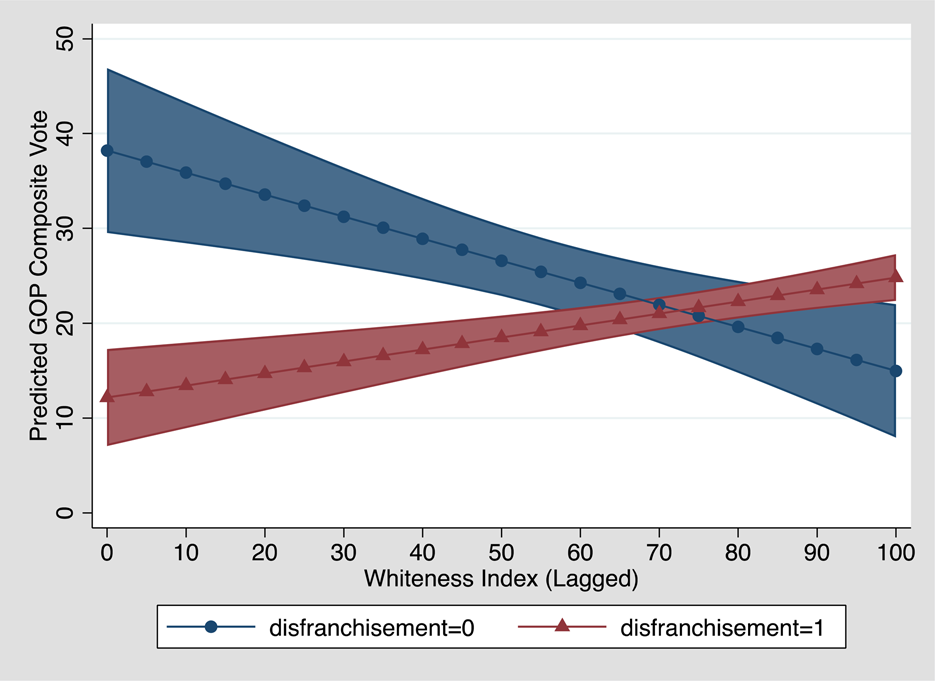
We find similar results when looking at the marginal effects and plotting the predicted GOP support for congressional vote, governor vote, and the composite vote. (See Figs. A1 to A6 in the Appendix.) Overall, the model fits are better for the federal elections (president and Congress) than the state elections (governor). And this makes sense, as scholars have noted that white Southern movement to the Republican Party occurred first at the federal level before trickling down to the state and local levels.Footnote 53
We can also disaggregate the presidential vote results by area within the South. Historians and political scientists typically subclassify the region as Deep South (Alabama, Georgia, Louisiana, Mississippi, and South Carolina) or Outer South (Arkansas, Florida, North Carolina, Tennessee, Texas, and Virginia).Footnote 54 The differences between the two subregions were extensive. As Robert Mickey elaborates:
For most of the 20th century, the populations of the Deep South states were more rural and featured a greater share of blacks, their economies were more dominated by labor-repressive agriculture and were less industrialized, their politics were marked by almost a total absence of Republican or other ruling party challengers, their white populations seemed the most committed to white supremacy, and they had the weakest infrastructure for black insurgency.Footnote 55
These differences between the states of the Deep South and the Outer South thus may have led to differences in the ways they reacted to changes in the Republican Party in the Jim Crow era. That is, a GOP that was eschewing Reconstruction-era traditions and establishing a new (Lily-White) approach to leadership may have led white voters in different subregions to react differently from an electoral perspective. V. O. Key, for example, writing around the middle of the twentieth century, did not believe that the South—as a unit—was as “solid” for the Democrat Party as many observers believed. Key saw the states of the Deep South to be “the bulwarks of Democratic strength.”Footnote 56 In contrast, he noted that the states of the Outer South “manifest a considerably higher degree of freedom from preoccupation with the race question than do the states of the Deep South.”Footnote 57
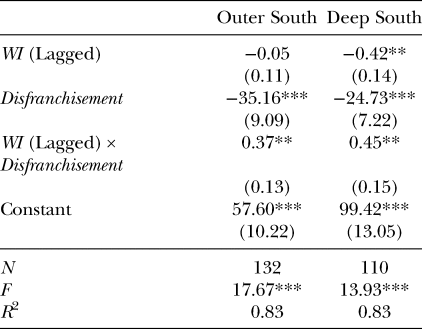
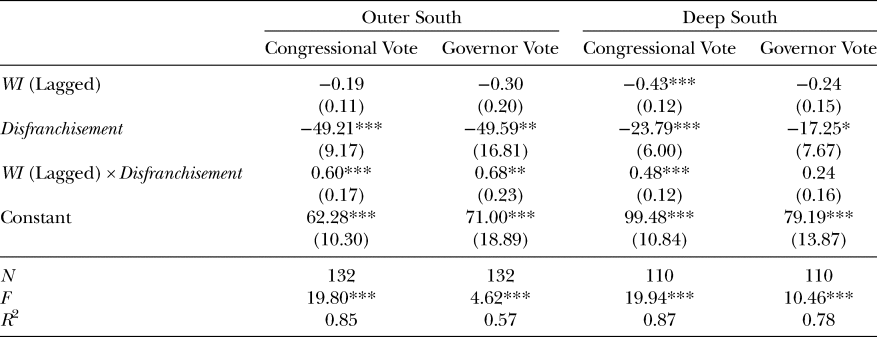
Thus, we estimate the same OLS regression model on presidential vote as before, but now on two subgroups: the states of the Deep South and the states of the Outer South. Regression results appear in Table 5, in two columns. The relationship between the whiteness of the GOP and its share of the presidential vote is more complex than before, not simply negative and significant (in both Southern subregions) before the advent of voting restrictions and positive and significant after. For ease of interpretation, we explore this relationship visually in Figures 6, 7, and 8.
Estimating GOP Presidential Vote in the South by Region, 1872–1956

Notes: OLS coefficients with standard errors in parentheses. All models include both state and year fixed effects (excluded categories: Virginia, 1872).
*p < .05, **p < .01, ***p < .001.
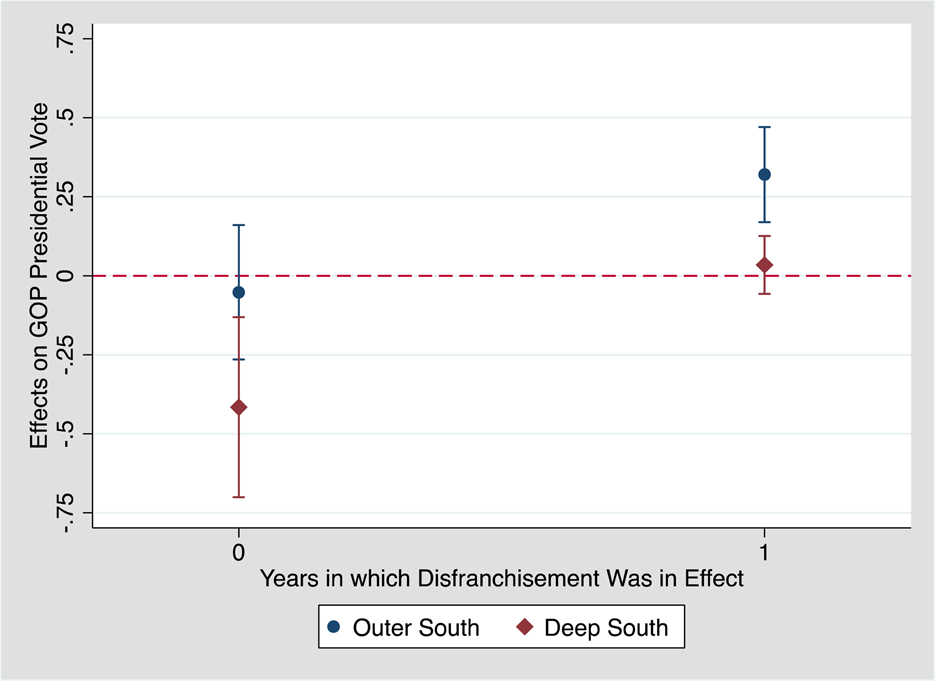
Average Marginal Effects of Whiteness Index (Lagged) on GOP Presidential Vote, Outer South versus Deep South.

Predicted GOP Presidential Vote by Level of Whiteness Index (Lagged), Outer South.

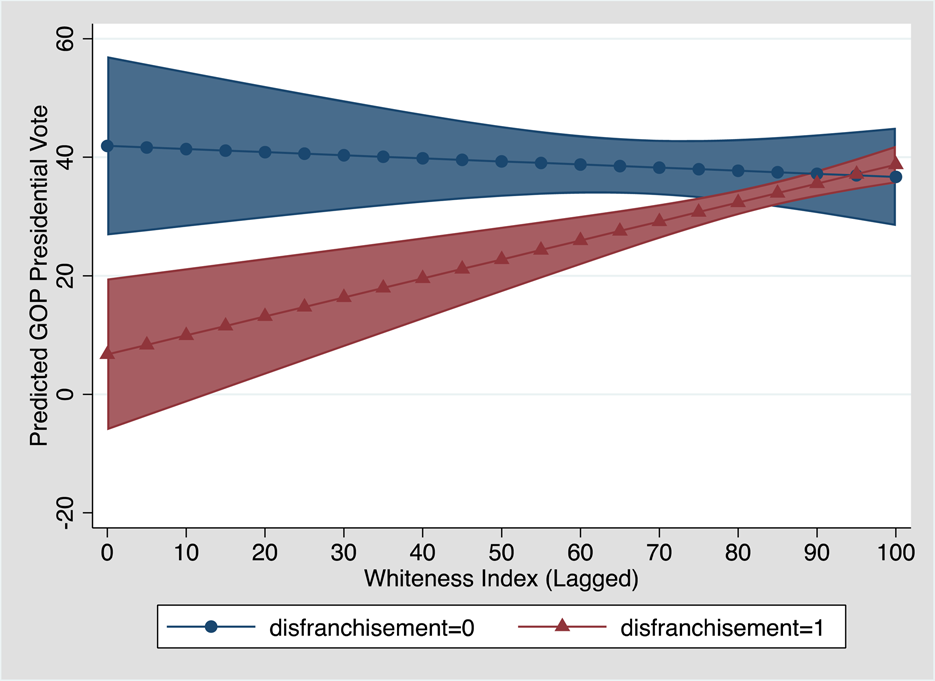
Predicted GOP Presidential Vote by Level of Whiteness Index (Lagged), Deep South.

The average marginal effects of the WI (Lagged) on GOP presidential vote for both the Deep South and Outer South are illustrated in Figure 6. For the Deep South, prior to disfranchisement, there was a −0.42 percentage-point change (p < .01) in GOP presidential vote for a 1 percentage-point increase in the WI (Lagged). After disfranchisement, there was a 0.03 percentage-point change (p < .46) in GOP presidential vote for a 1 percentage-point increase in the WI (Lagged). Thus, in the Deep South—with a higher percentage of blacks in the population—a whiter party was a significant disadvantage before disfranchisement, but a whiter party provided no significant advantage after disfranchisement. The opposite proves to be true for the Outer South. Prior to disfranchisement, there was a −0.05 percentage-point change (p < .63) in GOP presidential vote for a 1 percentage-point increase in the WI (Lagged). After disfranchisement, there was a 0.32 percentage-point change (p < .001) in GOP presidential vote for a 1 percentage-point increase in the WI (Lagged). Thus, for states in the Outer South, a whiter party provided no significant advantage (or disadvantage) before disfranchisement, but a whiter party provided a significant and sizeable advantage after disfranchisement.Footnote 58
The predicted GOP presidential vote by level of the WI (Lagged) is illustrated in Figure 7 (Outer South) and Figure 8 (Deep South). For the Outer South, the relationship between the WI (Lagged) and Republican Party presidential vote was relatively high and flat before disfranchisement. However, after disfranchisement, the relationship between the WI (Lagged) and GOP presidential vote started off low (at the lowest WI values) and had a relatively steep, positive slope. The opposite was true in the Deep South. There, the relationship between the WI (Lagged) and Republican Party presidential vote before disfranchisement started off high (at the highest WI values) and had a relatively steep, negative slope. However, after disfranchisement, the relationship between the WI (Lagged) and GOP presidential vote was relatively low and flat.
Overall, in the Outer South, after voting restrictions were in place, a change from 1 standard deviation below the mean WI (Lagged) to 1 standard deviation above it resulted in an 8.32 percentage-point increase in Republican Party presidential vote.Footnote 59 This represents more than one-half of a standard deviation change in GOP presidential vote. Whereas in the Deep South, after voting restrictions were in place, a change from 1 standard deviation below the mean WI (Lagged) to 1 standard deviation above it resulted in a 1.84 percentage-point increase in Republican Party presidential vote. This represents just over one-tenth of a standard deviation change in GOP presidential vote.
These results comport with the historical expectations of Key and others. Prior to disfranchisement, a whiter GOP hurt the party in the states of the Deep South, where black voters were a much larger part of the population than in the states of the Outer South. After disfranchisement laws were introduced, the whitening of the Republican Party had its greatest impact in the states of the Outer South, where the baggage of the Reconstruction era was not as entrenched. White voters in the Outer South were more willing to vote for the GOP based upon a visible change in the racial composition of the party leadership. This was not true in the Deep South, where a deeply ingrained racial consciousness was present and white voters had long viewed the GOP as the party of “Negro domination.” A whitening of the Republican Party leadership was not going to easily wipe away those longstanding beliefs. More had to happen before voters in the Deep South would view the GOP as a viable electoral option.
To summarize, variation in both the onset of disfranchisement and the Whiteness Index among the Southern states allows us to identify the effect of GOP leaders “whitening” the party in the post-disfranchisement era. The takeaway is this: a whitening of the party—by moving toward Lily-Whiteism—produced a significant vote gain for the GOP after disfranchisement. Once voting restrictions effectively removed black citizens from the eligible Southern electorate, the Republican Party was able to slowly reemerge as a viable electoral party—more so in the Outer South—by excluding blacks from leadership positions, thus satisfying the “respectability” condition of the new, nearly exclusively white Southern electorate.Footnote 60
More generally, we consider this whitening of the Republican Party in the South as a necessary condition in the GOP's electoral growth and eventual dominance in the former Confederacy. By becoming a Lily-White party, the Republicans achieved some electoral gains, especially in the Outer South. But this move to Lily-Whiteism, by itself, was not sufficient. For those electoral gains to spread to the Deep South and grow generally such that the GOP could command a majority of votes throughout all areas of the South, a number of other things had to occur. For example, the national Democratic Party had to move leftward on the issue of civil rights. And the national Republican Party had to continue emphasizing its economic-conservatism credentials while moving rightward on civil rights (first explicitly in 1964 during Goldwater's presidential campaign and implicitly thereafter). Indeed, the Republicans had to become the broadly accepted party of racial conservatism before they could make a significant electoral breakthrough in the Deep South.
Conclusion
Donald Trump's victory in the 2016 presidential election came as a surprise to most political commentators and election forecasters. In the run-up to the election, there was near consensus that a Trump victory would require a very specific (and highly unlikely) set of contingencies to be met. Accordingly, election forecasts and political betting markets gave Trump little to no chance of winning.Footnote 61 The key to Trump's surprise victory was his performance in rust belt states in the Midwest and Mid-Atlantic, where he won Wisconsin, Michigan, and Pennsylvania and thereby secured his majority in the electoral college. Much has been—and will continue to be—written about the set of circumstances that led to Trump winning these rust belt states, including the effect of Russian interference, the investigation into Hillary Clinton's use of private email while serving as Secretary of State, and strategic errors on the side of the Clinton campaign.Footnote 62 However, the rust belt states were not the only component to Trump's success. A less surprising, but nonetheless crucial component was Trump's performance in the South—which we define here as the eleven ex-Confederate states. Indeed, Trump's performance there was the foundation in his drive to the White House: Trump carried ten of the eleven Southern states (losing only Virginia), providing him with 155 electoral votes—more than half of his entire total.Footnote 63
Trump's success in the South was hardly unique: Republican presidential candidates have been able to count on the South for much of the last half-century. With the exception of 1976, Republican presidential nominees have carried a majority of Southern states since 1972. In fact, in five elections (1972, 1984, 1988, 2000, and 2004) the Republican candidate swept the South—winning all eleven states. Below the presidential level, Republican success in the South took longer to develop, but here too the GOP has become dominant. While in the 1960s the Republican share of House and Senate seats was in the single digits, since 1994 the Republican Party has claimed a majority of Southern seats in Congress, and in the 2014 and 2016 elections, the GOP yield has exceeded more than 75 percent in both chambers. At the state level, Republicans have won at least a majority of gubernatorial elections in the South since 1994 and as many as ten governorships in 2012 and 2014. Meanwhile, in state legislatures the 2010 “shellacking” of the Democratic Party resulted in the GOP winning a majority of state legislative seats. Combined, the South has thus become the contemporary GOP's electoral base.
Of course, this fact would have shocked Republican and Democratic leaders in the not too distant past. For much of American political history the South was a no-go area for Republicans: Democrats dominated in elections at the federal and state levels, creating a de facto single-party system in most Southern states between the end of Reconstruction through middle of the twentieth century. The general explanation relies on the idea that the GOP's ability to compete in the South was conditioned on two factors: first, the Democratic Party's incorporation of black voters during the New Deal era and its subsequent embrace of civil rights in the late 1950s and early 1960s as a national party and, second, the Republican Party's new reliance on appeals to white consciousness for political gain. Combined, these two developments opened conservative white southerners to vote Republican—first, at the presidential level and, later, in legislative and gubernatorial elections. As a result, scholarly focus has predominantly been on the second half of the twentieth century, noting the importance of the rise of the civil rights movement in the South, the emergence of the modern conservative movement in the Republican Party and Barry Goldwater's racially conservative 1964 presidential campaign, the Civil Rights Act of 1964 and Voting Rights Act of 1965, and Richard Nixon's “Southern Strategy” in 1968.
Each of these components was necessary to achieve the current partisan divide in the South. However, in this article, we expand the history of the Republican Party's resurgence in the South by looking at the internal conflicts that occurred while the party was largely uncompetitive in the period after Reconstruction. Our analysis suggests that the Black-and-Tan and Lily-White conflict resulted in a “whitening” of local state Republican Party organizations. The state-level victories of the Lily-Whites over the Black-and-Tans had real consequences for the party's local electoral performance: Once the discriminatory voting provisions of the Jim Crow era went into effect, and the eligible Southern electorate became almost exclusively white, the GOP began to reemerge electorally in the first half of the twentieth century more quickly in those Southern states where blacks were excluded from leadership positions in the party. Stated differently, the Republican Party saw electoral gains from going Lily-White.
To be sure, such gains were modest—as the GOP was (in the minds of most Southern whites) still living down its negative history in the region—but they indicate a slow and steady development in an era when most scholars considered the South to be essentially a one-party Democratic state. More generally, we argue that this whitening of the Republican Party in the South in the first half of the twentieth century was as a necessary condition in the GOP's electoral growth and eventual dominance in the former Confederacy in the second half of the twentieth century. That is, by turning the local GOP white, Lily-White leaders—while unable to make their party electorally competitive at the time—helped produce a Republican Party that could plausibly compete for white votes further down the line.
Appendix
Average Marginal Effects of Whiteness Index (Lagged) on GOP Congressional Vote.

Predicted GOP Congressional Vote by Level of Whiteness Index (Lagged).

Average Marginal Effects of Whiteness Index (Lagged) on GOP Governor Vote.

Predicted GOP Governor Vote by Level of Whiteness Index (Lagged).

Average Marginal Effects of Whiteness Index (Lagged) on GOP Composite Vote.

Predicted GOP Composite Vote by Level of Whiteness Index (Lagged).

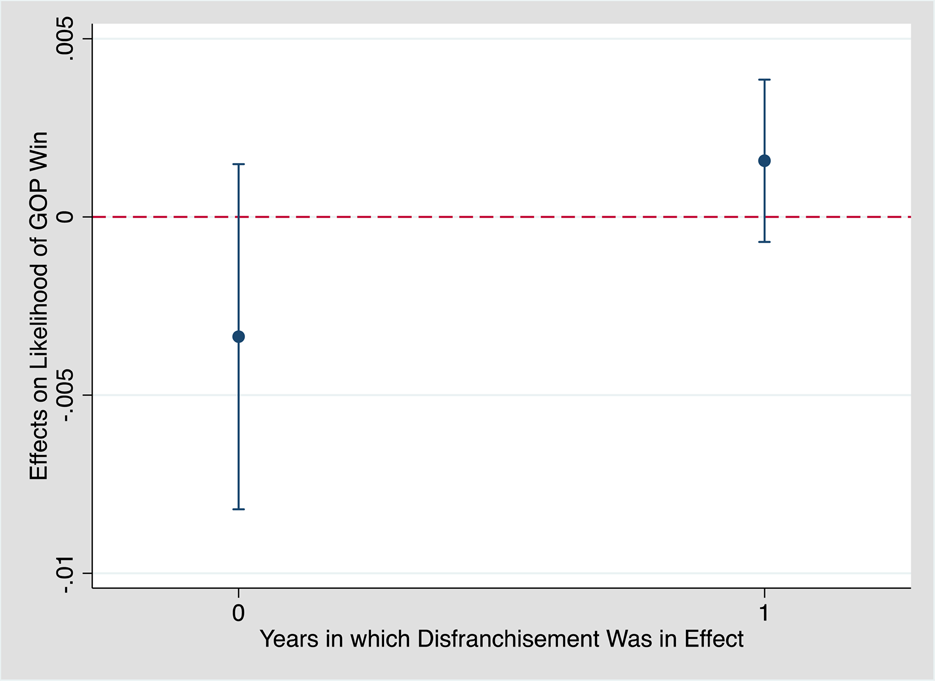
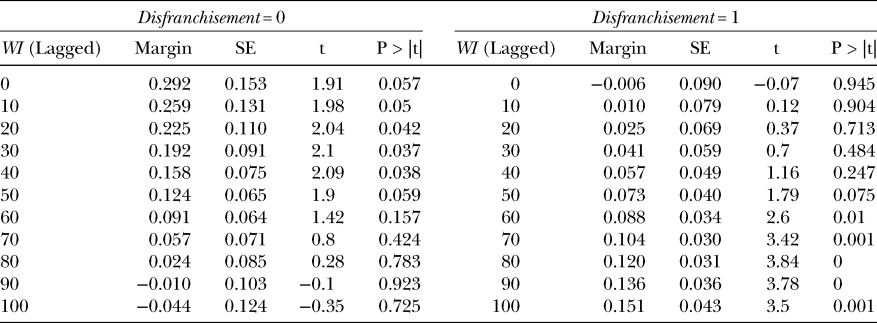
Average Marginal Effects of Whiteness Index (Lagged) on Likelihood of GOP Win.

Estimating Republican Electoral Support in the South by Region, 1872–1956

Likelihood of a GOP Win by Level of Whiteness Index (Lagged) and Disfranchisement