

Introduction
Natural Disasters and Winter Storms
Natural disasters and extreme weather are the most frequent causes of unplanned school closure announcements (USCA) in the United States. Reference Wang and Ye1,Reference Wong, Shi and Gao2 Additionally, the winter season has the most frequent weather incurred incidents during the year. Reference Wang and Ye1 According to the National Oceanic and Atmospheric Administration, 3 a winter storm is an event in which the main types of precipitation are snow, sleet, and freezing rain. Winter storms bring water in its solid form and also bring multiple days of severe freezing temperatures and, in some cases, temperatures well below freezing. Reference Mayes Boustead, Hilberg, Shulski and Hubbard4 Methods to identify these events include weather forecasters using different models to output statistics that display anomaly patterns of winter precipitation. Reference Grumm and Hart5 These unusual patterns allow the forecasters to deem a weather event significant when the patterns have surpassed a “normal” baseline. Reference Grumm and Hart5 Meteorologists and climatologists then analyze the severity of the winter season by comparing the accumulation of these events and their characteristics (ie, precipitation types, temperatures, etc) to set thresholds. Reference Mayes Boustead, Hilberg, Shulski and Hubbard4 Scales used to measure winter severity differ among regions and factors in a different combination of characteristics of the winter season. Reference Mayes Boustead, Hilberg, Shulski and Hubbard4 Wong et al. indicated that about 93% of the causes of school closures are from natural disasters and weather. Reference Wong, Shi and Gao2 The school district closures were also more frequent and unplanned when a weather incident or natural disaster occurred.
Unplanned School Closures
USCA refer to announcements made by schools or school districts when they close outside of a regular scheduled school closure. Reference Wang and Ye1,Reference Wong, Shi and Gao2,Reference Rainey, Kenney and Wilburn6 With the occurrence of unplanned school closures (USC), several issues are raised for the stakeholders (eg, students and families) involved. Missing work, finding suitable alternatives for child care for working parents, and the interruption of student learning are some of the concerns. Reference Zheteyeva, Rainey and Gao7,Reference Berkman8 When USC are implemented timely and maintained for an appropriate duration in the event of winter storms, the announcements can help keep faculty, staff, students, and their families safe. Reference Rainey, Kenney and Wilburn6 Due to contrasting considerations regarding school closures, district officials—emergency management, transportation officials, and school superintendents—are forced to make an imperative decision during natural disasters and must weigh the costs and benefits of USC. Reference Rainey, Kenney and Wilburn6
Social Media Use in Schools
Traditional media outlets, such as radio and television, have long been used as a communication tool regarding USCA through their news bulletins. Reference Pelfrey9 In the recent decade, the social media platform Twitter has become widely used for information sharing and they allow messages to be broadcasted before, during, and after a natural disaster. Reference Finch, Snook and Duke10–Reference Kongthon, Haruechaiyasak, Pailai and Kongyoung12 Social media allow for the retrieval of real-time information and communication simultaneously. Reference Kongthon, Haruechaiyasak, Pailai and Kongyoung12 During extreme weather and natural disasters, social media can be used as a communication tool to post USCA and bring awareness to followers regarding disasters, hazards, and the responses to either event in the hope to reduce risks of both morbidity and mortality. Reference Wong, Shi and Gao2,Reference Finch, Snook and Duke10,Reference Kongthon, Haruechaiyasak, Pailai and Kongyoung12–Reference Olteanu, Vieweg and Castillo14 Previous studies identified schools and school districts in Michigan and Georgia that made USCA on Twitter. Reference Ahweyevu, Chukwudebe and Buchanan15,Reference Jackson, Mullican and Tse16 Recent studies have also identified USCA on Twitter and Facebook, in response to Hurricane Harvey Reference Jackson and Ahmed17 and wildfires in California. Reference Buchanan, Evans and Chukwudebe18 Social media can be an effective tool of communication for school officials to inform populations while government officials can pick up USCA via social media for the purpose of emergency preparedness and responses. Reference Rainey, Kenney and Wilburn6,Reference Fung, Tse and Fu13
The Need for USC Monitoring
School districts are governed by local school boards and are not obliged to report USC to federal authorities. Federal agencies may monitor USCA via traditional media and digital media to obtain baseline data of USC in normal years to facilitate preparedness for natural disasters and disease outbreaks. Reference Wong, Shi and Gao2 Researchers at the Centers for Disease Control and Prevention (CDC) have been investigating different ways to track USCA on traditional media and digital platforms, including searching daily on Google Alert, Google News, and Lexis-Nexis to identify USCA. Reference Wong, Shi and Gao2 However, such data sets are not without their limitations. Some USCA might be missed if only the aforementioned online systematic search of data was used alone. Reference Ahweyevu, Chukwudebe and Buchanan15,Reference Jackson, Mullican and Tse16 Prior studies conducted by the corresponding author and his team explored the possibilities of using Twitter as a data source for monitoring USCA in Michigan in the Midwest, Reference Jackson, Mullican and Tse16 Georgia (GA) in the South, Reference Ahweyevu, Chukwudebe and Buchanan15 and California on the West Coast of the United States. Reference Buchanan, Evans and Chukwudebe18 In this study, we expanded our prior research to school districts in Massachusetts (MA) in the Northeast. We acknowledge that other social media platforms may also be used by schools and school districts. Meanwhile, as an extension to Ahweyevu et al., Reference Ahweyevu, Chukwudebe and Buchanan15 this study will focus on Twitter, taking advantage of the Twitter data that had already been retrieved.
Selection of State, Time Period, and Social Media Platform
In continuation of predecessor studies, analyzing Twitter use as a public health resource, we accessed already obtained Twitter data from GA with the addition of MA for comparison. Reference Ahweyevu, Chukwudebe and Buchanan15–Reference Jackson and Ahmed17 Regarding the difference of emergency preparedness between the Northern and Southern regions of the United States, a manuscript suggested that the northern United States tended to have less media announcements (ie, newspaper, television, radio, Internet, etc), which could lead to being less prepared. Vice versa, the southern United States had more media usage leading to emergency preparedness and increased access to supplies. Reference Murphy, Cody and Frank19 This difference influenced the decision of analyzing the Twitter use for USCA between northern and southern states’ school districts. Due to an abnormal number of winter storms that occurred in the South, the 2017–2018 year was selected for observation. The time period chosen for this analysis was from August 1, 2017, to July 31, 2018, to capture 1 full school year. MA and GA were designated to represent the northeast and the south due to their respective geographic locations, a similar number of schools (GA: 2312; MA: 1853 in the 2017–2018 school year), and the presence of at least 1 winter storm during the 2017–2018 winter season. The winter season of 2017–2018 school year in GA and MA extended from December 1, 2017, through March 31, 2018.
Objective
To better understand, quantify, and compare winter-storm-related USCA, we examined rates of tweets per day by school districts in the states of GA and MA in 3 scenarios: (1) the entire 2017–2018 school year, (2) the 2017–2018 winter season, and (3) the USCA on Twitter during days affected by winter storms. Our hypothesis was that there would be a higher rate of USCA in GA than in MA during days affected by winter storms. We postulated that schools in a northeastern state are better prepared for winter storms than those in a southern state, because residents in the northeast are accustomed to winter storms. In addition to the characteristics of school districts that could be important covariates, such as student number and student-teacher ratio (STR), we also explored characteristics of school districts’ Twitter accounts including their number of followers and number of accounts that they follow (“following” counts).
Methods
Data Retrieval and Management
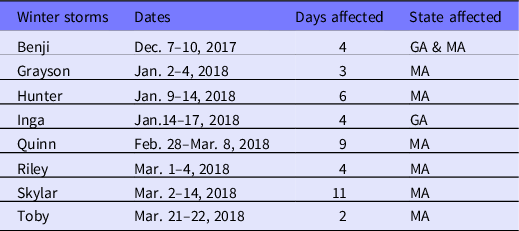
The population of interest included entire public-school districts in the states of GA and MA. This period included the start date of the first winter storm to the end date of the last winter storm in 2017–2018 winter season (Table 1). Twitter handles for each of the public-school districts in GA and MA were used as the study population and the unit of analysis. Only publicly available tweets were retrieved and analyzed. The distributions of GA and MA school district Twitter accounts by frequency of tweets per account were found in Figures S1 and S2.
Winter storm official names a

a Name of each specific storm that occurred and affected Georgia (GA) or Massachusetts (MA) during the 2017–2018 winter storm season. Also included are the dates they occurred, number of days affected, and which state the winter storm affected. Retrieved from The Weather Channel (2019).
GA and MA public-school district data were downloaded from the National Center for Education Statistics (NCES) database. 20 Based on the NCES data, we manually searched for school-district Twitter handles via Google and Twitter. Either the official Twitter account of each school district, a school district Twitter account administered by respective school superintendent, or board of education was identified and used in the analysis. After public-school district Twitter handles were retrieved, the handles were used to download all available tweets with Twitter application programming interface (API). The Twitter data set was then merged with the NCES data using the Twitter handle names. The full data set was managed and organized into smaller data sets with the relevant observations pertaining to the school year of 2017–2018 as the first scenario and the winter season from December 1, 2017, to March 31, 2018, as the second scenario. The smaller winter season data set and a keyword list were used to identify the USCA tweets relevant to winter storms that occurred using a keyword function in R version 3.4.3, 21 which created data sets of tweets for each keyword. The keywords were determined by identifying the winter storm names (see Table 1), using The Weather Channel 22 and other words and phrases relevant to USCA as identified in prior studies Reference Ahweyevu, Chukwudebe and Buchanan15,Reference Jackson, Mullican and Tse16 (Online Supplementary Materials). The data sets created by identifying winter-storm-specific keywords were combined and used as the winter season USCA data set for the third scenario.
Data Analysis
We examined whether a difference existed between school districts in GA and MA in the number of tweets per day during (1) the school year and (2) the winter season, and in the number of (3) USCA per winter-storm-affected day during the winter season. Other covariates included the NCES defined school locality (locale categories: city, suburb, town, rural, and “not applicable”), 23 the number of schools, and the STR of each school district, and the number of Twitter accounts that followed a school district account (followers count) and the number of Twitter accounts a school district account followed (“following” count) (see Supplementary Materials for further details).
The data were analyzed using R versions 3.4.3 to 3.6.0. 21 Percentages, histograms, correlation charts, and other descriptive statistics were performed on relevant variables listed above. Also, inferential statistics such as chi-square and Wilcoxon signed-rank tests were performed to test the significance between relevant variables. Due to a highly skewed distribution of predictor variables chosen (number of students, STR, followers count, and “following” count), the relevant data were log10-transformed (Figures S3–S6). Negative binomial regression models were used to compute rate ratios with GA as the reference group for the state variable. Statistically significant rate ratios and interaction terms when assessing effect modification were set a priori at α = 0.05. When assessing for confounding, variables were included in the final adjusted model when there was a 10% difference between the crude rate ratio and the adjusted rate ratio (aRR) for state. A bidirectional elimination stepwise regression model building approach was utilized to achieve the final adjusted model to describe the relationship between state and tweet rates.
Results
During the 2017–2018 winter season, GA had a total of 8 days that were affected by 2 winter storms while MA had a total of 39 days that were affected by 7 winter storms. In total, there were 8 winter storms affecting at least 1 of the 2 states (see Table 1).
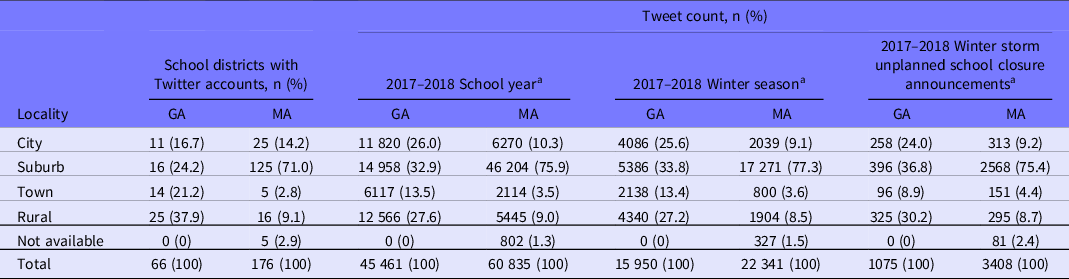
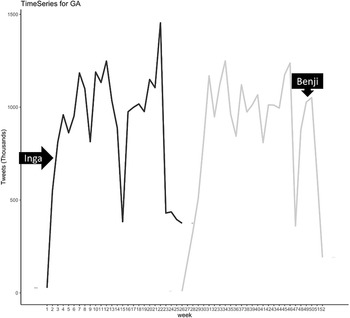
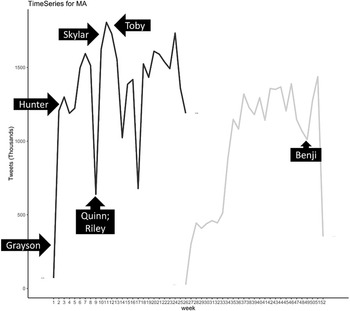
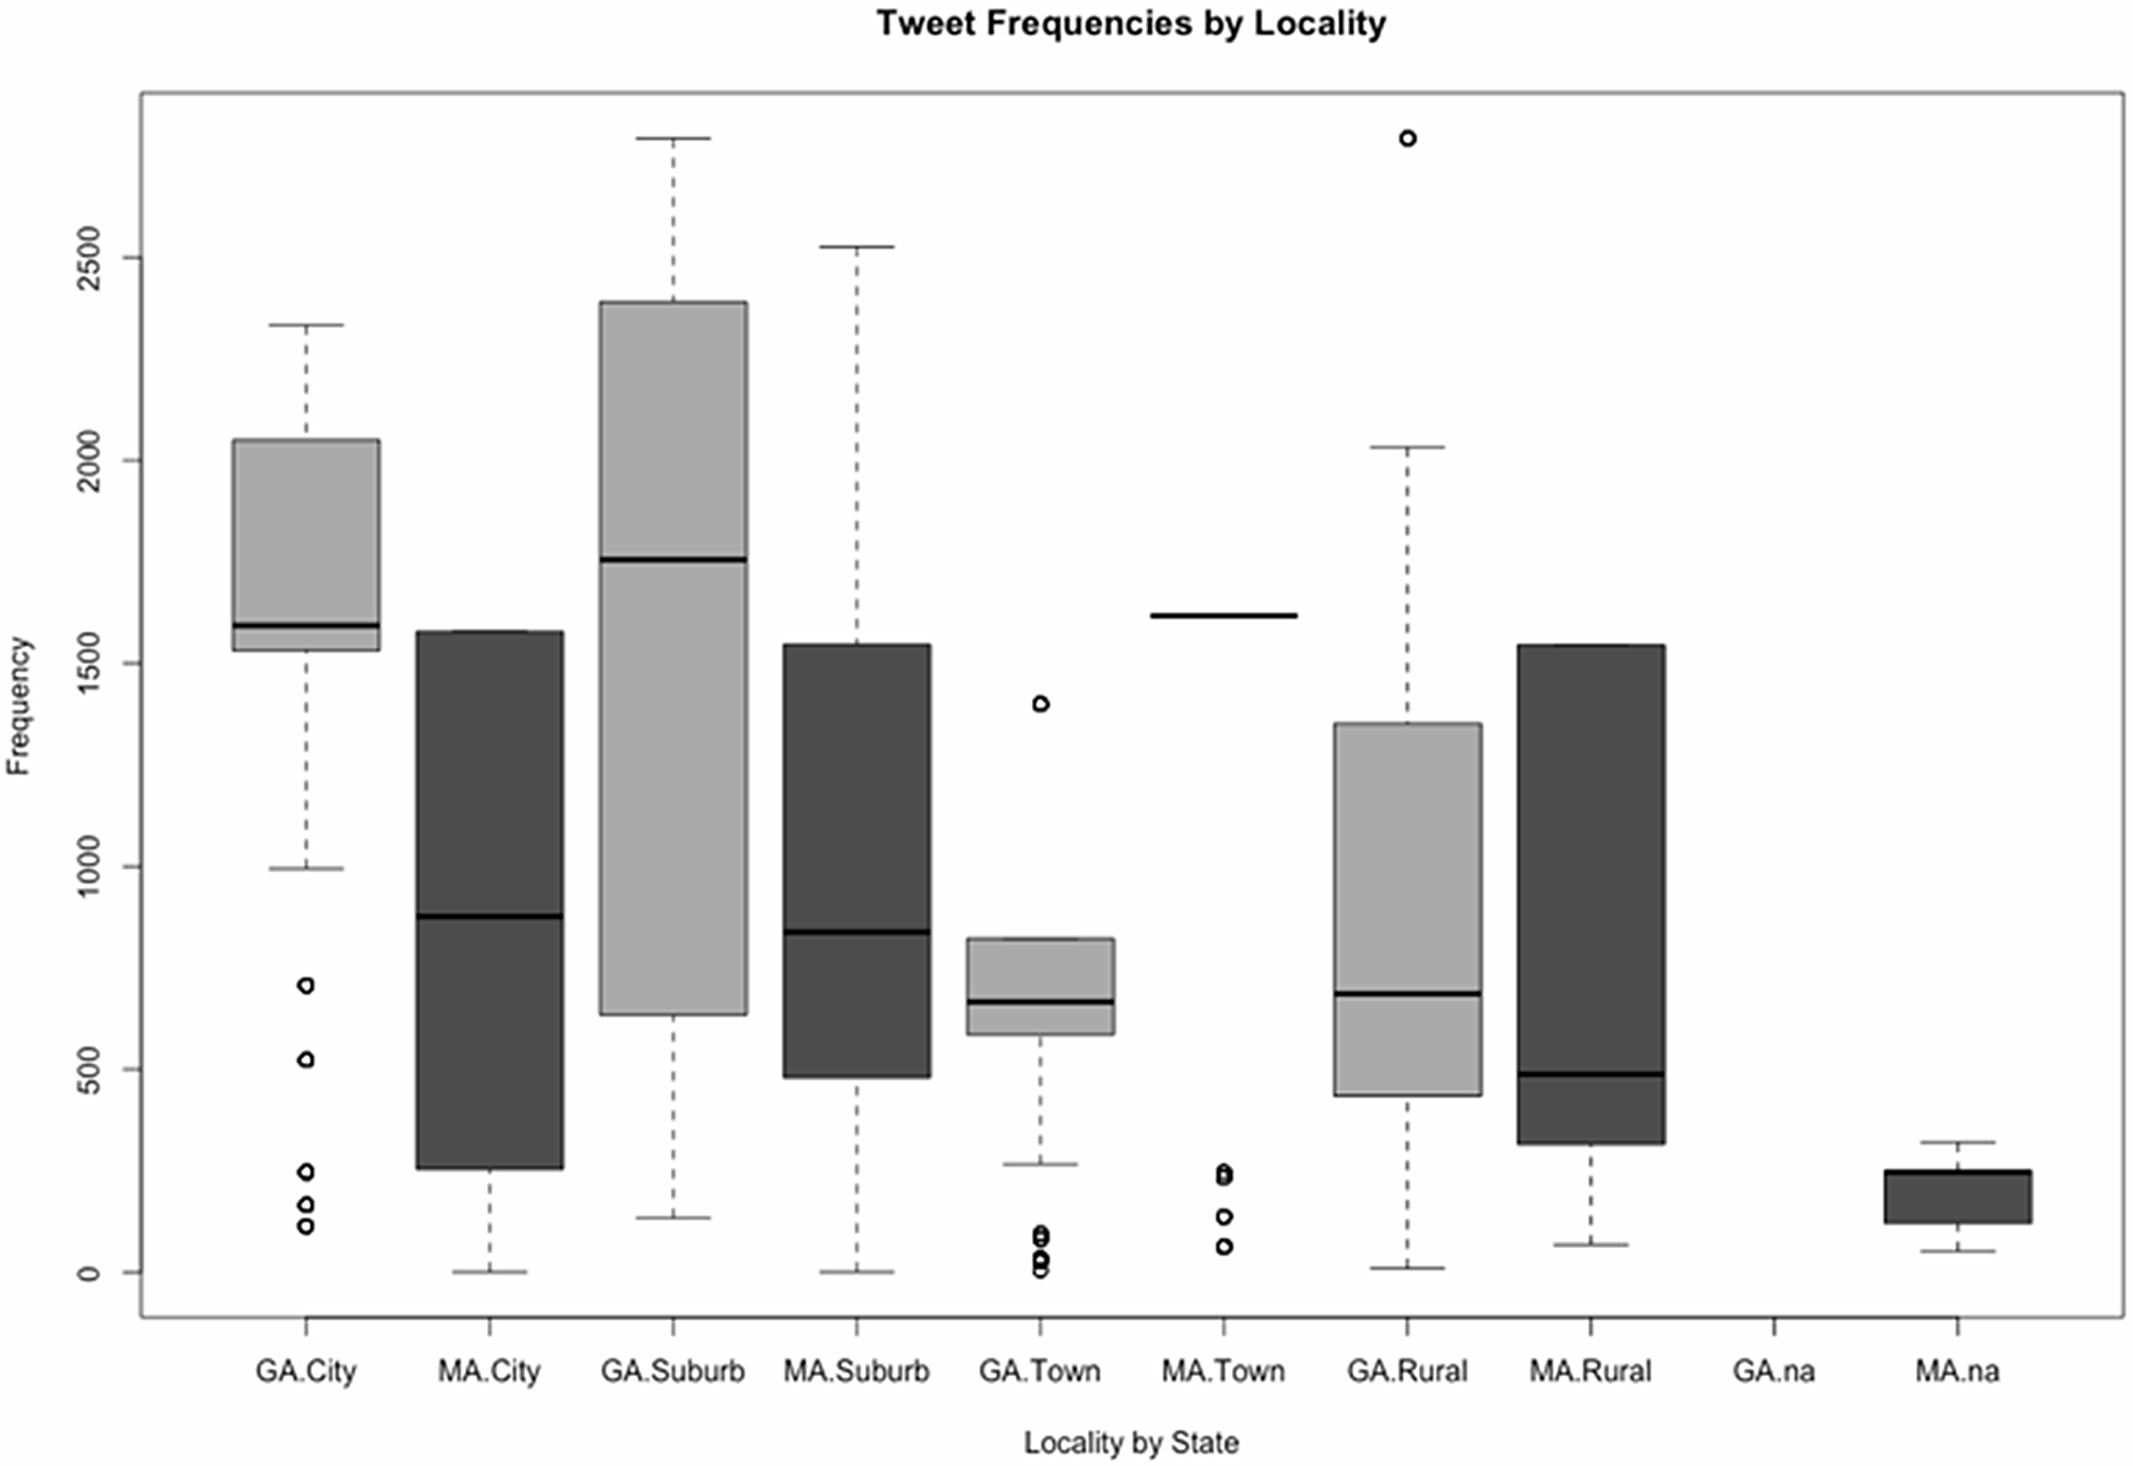
During the 2017–2018 school year, 66 (28.45%) of 232 public-school districts in GA and 176 (40.84%) of 431 public-school districts in MA had Twitter accounts (χ2 = 4.4407; P = 0.04; Table S1). Among the 66 school districts in GA with Twitter accounts, 11 (16.7%), 16 (24.2%), 14 (21.2%), and 25 (37.9%) were in city, suburb, town, and rural areas, respectively (Table 2). Among the 176 school districts in MA with Twitter accounts, 25 (14.2%), 125 (71.0%), 5 (2.8%), and 16 (9.1%) were in city, suburb, town, and rural areas, respectively, while the locality information of 5 (2.9%) was not available (see Table 2). Among the school districts with Twitter accounts, a majority had 750 or fewer tweets in total (GA: 72.7%, 48/66; MA: 89.2%, 157/176; Table S2, Figures S1–S2). In total, 45 461 and 60 835 tweets were posted by 66 and 176 school district Twitter accounts in GA and MA, respectively, of which 15 950 (35.1%) and 22 341 (36.7%) were posted during the winter seasons, and 1075 (2.4%) and 3408 (5.6%) were tweets with USCAs during winter-storm-affected days (see Table 2). Frequencies of tweets vary over time during winter storms and other weeks (Figures 1 and 2). GA city and suburban school districts tweeted more tweets per district than their respective counterparts in MA (Figure 3). Given that in MA, 71% of school districts with Twitter accounts were in the suburb, it is not surprising that 75.9%, 77.3%, and 75.4% of tweets posted by MA school districts were from suburb districts, in the 2017–2018 school year, 2017–2018 winter season, and the USCA tweets during winter-storm-affected days, respectively. While 40.9% of school districts with Twitter accounts in GA were in the cities and in the suburbs, they accounted for approximately 6 in 10 tweets posted by GA school districts in 2017–2018 school year, 2017–2018 winter season, and the USCA tweets during winter-storm-affected days, respectively (see Table 2).
Number of school districts with Twitter accounts and their tweets by locality for the school year, winter season, and unplanned school closure announcements

a A chi-square test was used to determine whether the amount of tweets per locality in GA and MA were significantly different from one another. The P-values were < 0.0001 in all 3 comparisons.
Frequency of tweets per week in the 2017–2018 school year for all Georgia school districts that had Twitter accounts with the timing of winter storms indicated. The x-axis indicates the week in a calendar year. Weeks in 2017 (gray) and 2018 (black) are connected in 2 separate lines.

Frequency of tweets per week in the 2017–2018 school year for all Massachusetts school districts that had Twitter accounts with the timing of winter storms indicated. The x-axis indicates the week in a calendar year. Weeks in 2017 (gray) and 2018 (black) are connected in 2 separate lines.

The median, interquartile range, and 95% confidence interval of the distribution of the total number of tweets of each school district Twitter account by state (GA: Georgia; MA: Massachusetts) and locality (city, suburb, town, rural, and data not available) in the school year of 2017–2018.

Among the districts with Twitter accounts, GA had higher medians for number of schools (15; P < 0.0001), students (10 305; P < 0.0001), and Twitter followers (2808; P < 0.0001) per district than MA (6, 3040, and 1052, respectively). MA districts with Twitter accounts had a significantly higher median STR (35; P < 0.0001) than their GA counterparts (15.37), and the median number of Twitter accounts followed per school district Twitter account in MA was not significantly different (102; P = 0.27) from that of the school district Twitter accounts in GA (100) (Table S3). Increases in Twitter usage were seen during all winter storms in both states except for Winter Storm Toby in MA (see Figures 1 and 2). The median tweet rate of USCA in GA school districts on winter-storm-affected days (3.38 tweets/affected day) was not statistically different from that in MA (0.79 tweets/affected day) (P = 0.31) (Table S4).
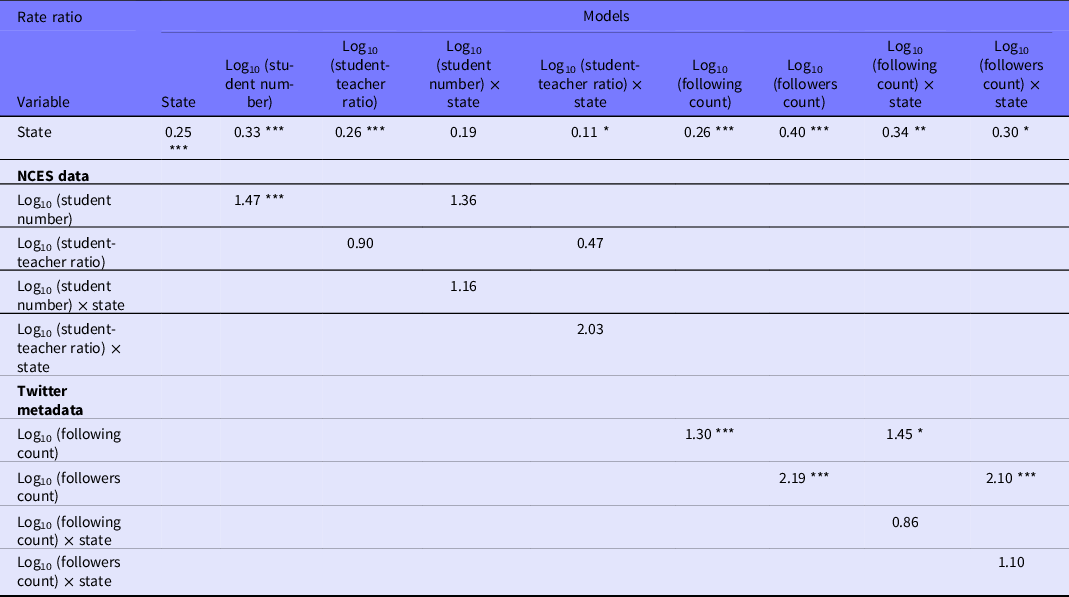
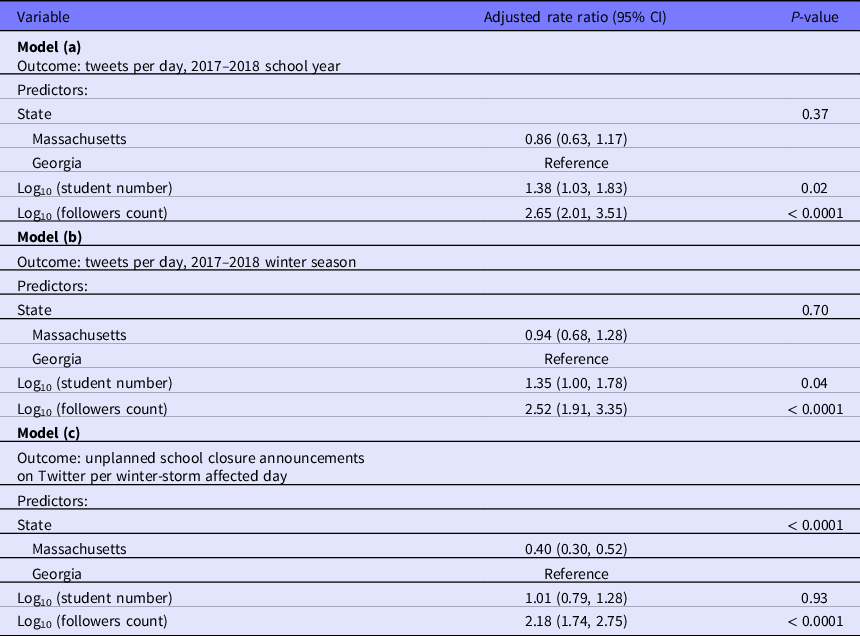
The number of students in a school district and the number of followers of a school district Twitter account were identified as confounders for the association between the state (of MA versus GA) and the number of USCA per winter-storm-affected day (USCA rate). These confounders were added to the final adjusted models for all 3 scenarios (Table 3 and Tables S5–S14). After adjusting for these confounders, there were no differences in the number of tweets per day between school district Twitter accounts in MA and GA in the adjusted models for the school year (aRR = 0.86; 95% CI: 0.63, 1.17; P = 0.37) and for the winter season (aRR = 0.94; 95% CI: 0.68, 1.28; P = 0.70), respectively (Table 4). However, the number of USCA per winter-storm-affected day was 60% lower in MA than in GA after controlling for the number of students and the number of followers (aRR = 0.40; 95% CI: 0.30, 0.52; P < 0.0001) (Table 4).
Crude and adjusted rate ratios of Massachusetts (as compared with Georgia) and other covariates in different negative binomial models of unplanned school closure announcement tweets on winter-storm affected days in 2017–2018

*P < 0.5, **P < 0.01, ***P < 0.001; State = the rate ratio of Massachusetts as compared with the reference state of Georgia; × between two variables refers to the interaction term.
Adjusted rate ratios of daily tweet rate in 2017–2018 school year and in the winter season of 2017–2018, and of the rate of unplanned school closure announcements on Twitter per winter-storm affected day in the winter season of 2017–2018

A school district Twitter account’s followers count was found to be strongly associated with its Twitter activity. A 10-fold increase in followers count was associated with 165% increase in tweets per day in the 2017–2018 school year (aRR = 2.65; 95% CI: 2.01, 3.51; P < 0.0001), 152% increase in tweets per day in the 2017–2018 winter season (aRR = 2.52; 95% CI: 1.91, 3.35; P < 0.0001), and 118% increase in USCA per winter-storm-affected day (aRR = 2.18; 95% CI: 1.74, 2.75; P < 0.0001) adjusted for state and the number of students (see Table 4).
Limitations
This data set of tweets was obtained from the Twitter accounts of a cross-sectional population of school districts of 2 states over 1 winter season. Given the nature of a cross-sectional study, associations between variables identified in this study do not imply causality in any direction. Future longitudinal studies of winter-storm-related USCA across multiple years may provide more insight regarding Twitter usage for winter storms and natural disasters. Expanding the time period of study would allow for researchers to gain knowledge on any Twitter activity trends that may occur during natural hazards and other disasters. Additionally, there was no gold standard to determine whether school districts in the United States closed or whether they closed but did not make an announcement. Reference Wong, Shi and Gao2 Since school districts in the United States were not obliged to report USC to any federal authorities, we did not have access to other data sets the CDC or other federal agencies may have regarding USC to compare with our Twitter data. School districts may not have an active Twitter account and announce USC regularly like an active user would. They may choose to announce their USC via other means, such as local television stations, text messages, and phone calls, which are out of the scope of this project. Furthermore, in this study, only school districts were studied. The Twitter accounts of individual public schools in a district were out of the scope of this paper. Charter and private schools were not part of the school districts. Moreover, only 1 in 4 US adult Internet users is an active Twitter user, and Twitter coverage among the general population may vary across states. Reference Wojcik and Hughes24 Announcing an emergency or event on Twitter may not reach everyone in the general public directly, especially in states with lower Twitter coverage. Further research can explore other characteristics associated with Twitter usage across various states and their association with the school districts’ decision to communicate with stakeholders via Twitter. When school and community leaders consider using digital technologies to communicate with community members, they should take into account their preference in technology adoption. Finally, although we assessed various factors that can affect social media use seen in school districts, residual confounding might exist. Future studies can incorporate other factors potentially associated with social media use for USCA. There is also a need for analyzing the difference in social media use between regions and states in the United States.
Discussion
Implications of Major Findings
The results indicate that school district officials in GA and MA did use Twitter to disseminate emergency management information to the general public. Results presented here supported the hypothesis that while school districts in MA experienced more frequent winter storms during the 2017–2018 winter season than those in GA, school districts in MA posted fewer USCA on Twitter per winter-storm-affected day than those in GA. Differences were seen in the distribution of tweets per locality, rates of tweets, number of students, STR, number of Twitter followers, and number of Twitter accounts followed (“following”) in both GA and MA.
In winter 2017–2018, school districts in GA had a significantly higher rate of tweeting USCA during winter-storm-affected days than school districts in MA even though winter storms happened more frequently in MA than GA. This is congruent with the possibility, but does not prove, that public schools in MA are better prepared and closed less often during winter storms than their counterparts in GA. This is in line with our speculation that there could be more USCs in GA than MA during winter storms, and many of these GA school districts used Twitter to broadcast their USCA.
Findings in the Context of Published Literature
Our observation of increases in Twitter activity of school districts in GA and MA anticipating and during winter storms, Figures 1 and 2 align with other studies that observed increases of tweet rates during certain natural disasters and natural hazards such as floods, earthquakes, hurricanes, and wildfires. Reference Kongthon, Haruechaiyasak, Pailai and Kongyoung12,Reference Olteanu, Vieweg and Castillo14,Reference Kruikemeier25 Studies have shown the number of tweets regarding a specific topic, emergency or event, matters when influencing the audience, and relaying messages. Reference Kruikemeier25–Reference Lachlan, Spence and Lin27 As found in Lachlan et al., Reference Lachlan, Spence and Lin27 emergency management organization’s use of appropriately selected hashtags in their tweets would facilitate emergency message dissemination on Twitter, anticipating and during a severe winter storm “Nemo” that affected MA in February 2013.
Similar to other studies, Reference Niles, Emery and Reagan11,Reference Razis and Anagnostopoulos26 our results found that, after adjusting for the state and the number of students enrolled in a school district, the more Twitter followers of a school district had, the higher tweet rate it had over the entire school year and in the winter, and a higher rate of posting USCA on Twitter during winter storm days. The number of followers having an association with tweet activity and a Twitter account’s influence on its audience was also described by Kruikemeier. Reference Kruikemeier25 However, as Razis and Anagnostopoulos Reference Razis and Anagnostopoulos26 mentioned, not only is the number of followers important for an account to have an influence on social media, but also that influence is “directly dependent of the account’s activity measured by a tweet creation rate value.” Other research has also shown the relationship between followers count and the quantity of tweets were important for the distribution of information on social media. Reference Niles, Emery and Reagan11,Reference Razis and Anagnostopoulos26 Followers count was seen to be associated with the retweet count of health communication tweets, Reference Adnan, Yin and Jackson28 while Liang et al. Reference Liang, Fung and Tse29 found that the actual dissemination of health-related information counts on having celebrities who followed an organization to retweet its messages to the celebrities’ many followers.
Public Health Implications
This study adds to the scientific literature further evidence of Twitter used as a communication tool during natural disasters and other public health emergencies. Reference Finch, Snook and Duke10,Reference Fu, Liang and Saroha30–Reference Fung, Zeng and Chan32 CDC researchers can utilize Twitter to monitor winter-storm-related USCA, as they did with hurricane-related USCA. Reference Jackson and Ahmed17
Conclusions
Findings from this study supported our hypothesis that Twitter accounts of school districts in MA had a lower tweet rate for USCA per winter-storm-affected days than those in GA. When Twitter accounts of school districts and other public institutions are monitored by researchers in the CDC and other federal agencies for USCA for the purpose of emergency and disaster preparedness, their number of followers should be taken into consideration.
Supplementary Material
To view supplementary material for this article, please visit https://doi.org/10.1017/dmp.2022.41
Acknowledgments
The authors would like to thank Erica Ledel, Lindsey Vaughn, Sonam Sherpa, and Doyinsola Babatunde for the manual retrieval of Massachusetts public school districts’ Twitter handles. The authors would also like to thank Dr Jingjing Yin who taught statistics to the co-first authors.
Author Contributions
HIE and MTH are co-first authors and contributed equally to the study.
Funding Statement
IC-HF acknowledges support from the CDC (18IPA1808820; 19IPA1908208).
Conflict(s) of Interest
The authors have no conflicts of interest to declare.
Ethical Standards
This project is approved by the corresponding author’s university Institutional Review Board (IRB) under IRB number H15083 and was determined to be exempt from full review.