1. Introduction
Intraplate deformation is commonly attributed to the reactivation of pre-existing faults in plate interiors (Sykes, Reference Sykes1978; Etheridge, McQueen & Lambeck, Reference Etheridge, McQueen and Lambeck1991; Ziegler, Cloetingh & van Wees, Reference Ziegler, Cloetingh and van Wees1995; Sandiford & Hand, Reference Sandiford and Hand1998). Such fault reactivation can occur in response to far-field compressional horizontal stresses from plate boundaries (Ziegler, Cloetingh & van Wees, Reference Ziegler, Cloetingh and van Wees1995) and may play an important role in the occurrence of intraplate earthquakes (e.g. Sykes, Reference Sykes1978; McCue, Wesson & Gibson, Reference McCue, Wesson and Gibson1990; Liu, Zoback & Segall, Reference Liu, Zoback and Segall1992; Johnston & Schweig, Reference Johnston and Schweig1996). Commonly, the reactivation of pre-existing faults is recognized in sedimentary basins at passive margins that have been subjected to inversion (Etheridge, McQueen & Lambeck, Reference Etheridge, McQueen and Lambeck1991; Faccenna et al. Reference Faccenna, Nalpas, Brun, Davy and Bosi1995; Dore & Lundin, Reference Dore and Lundin1996; Guiraud, Reference Guiraud, MacGregor, Moody and Clark-Lowes1998; Dickinson et al. Reference Dickinson, Wallace, Holdgate, Daniels, Gallagher and Thomas2001; Bracène & Frizon de Lamotte, Reference Bracène and Frizon de Lamotte2002; Cloetingh et al. Reference Cloetingh, Beekman, Ziegler, van Wees, Sokoutis, Johnson, Doré, Gatliff, Holdsworth, Lundin and Ritchie2008; Levell et al. Reference Levell, Argent, Doré and Fraser2010). Such basins can therefore provide valuable information on intraplate deformation.
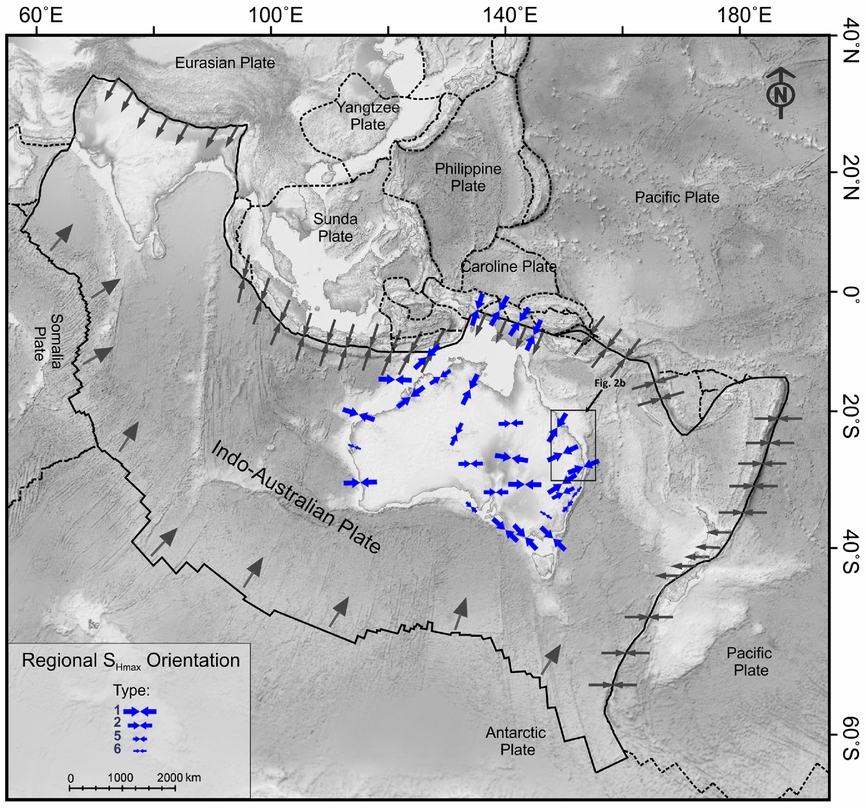
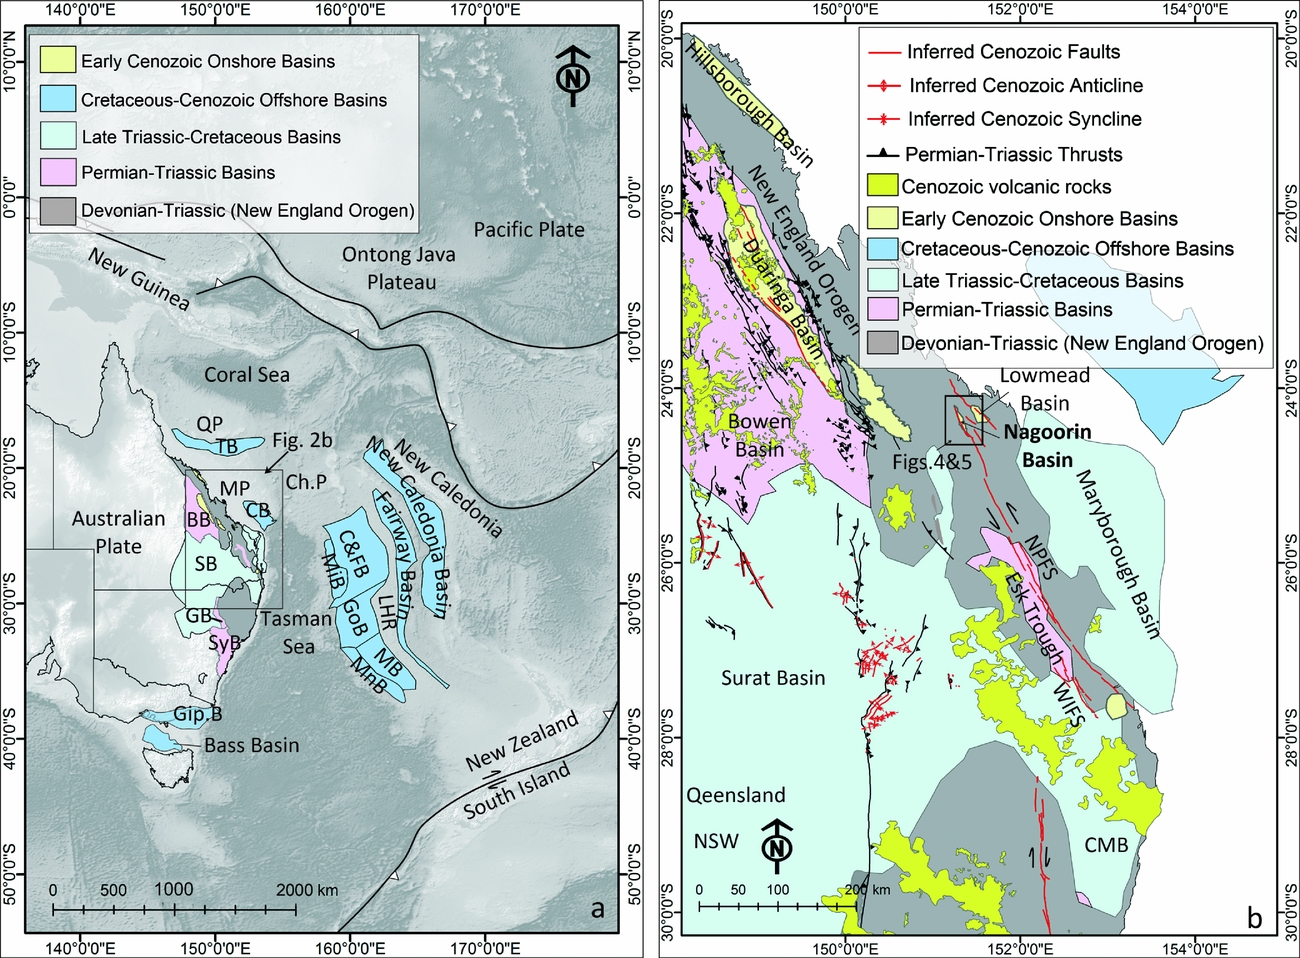
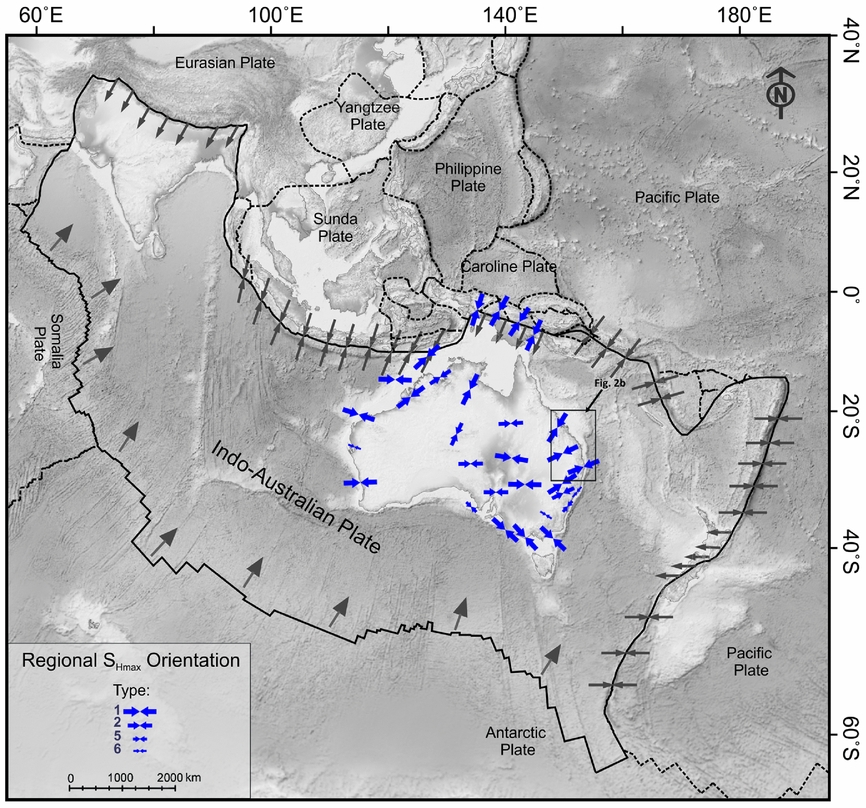
Cenozoic eastern Australia is an example of an intraplate region that was subjected to forces from a plate boundary located a considerable distance away (>1000 km) (Fig. 1) (Hillis et al. Reference Hillis, Sandiford, Reynolds, Quigley, Johnson, Doré, Gatliff, Holdsworth, Lundin and Ritchie2008; Rajabi et al. Reference Rajabi, Heidbach, Tingay and Reiter2017b). Extensional deformation that took place during the Late Cretaceous – early Eocene opening of the Tasman and Coral Seas (Gaina et al. Reference Gaina, Müller, Royer, Stock, Hardebeck and Symonds1998a, b, Reference Gaina, Müller, Royer and Symonds1999) resulted in the development of a large number of offshore and onshore extensional sedimentary basins (Fig. 2a). During Cenozoic time, a number of these basins – such as the Duaringa, Capricorn, Hillsborough, Capel and Faust basins (Fig. 2) – were affected by contractional deformation (e.g. Gray, Reference Gray, Leslie, Evans and Knight1976; Hill, Reference Hill1992, Reference Hill1994; Struckmeyer & Symonds, Reference Struckmeyer and Symonds1997; Willcox & Sayers, Reference Willcox and Sayers2002; Dyksterhuis, Müller & Albert, Reference Dyksterhuis, Müller and Albert2005; Colwell et al. Reference Colwell, Hashimoto, Rollet, Higgins, Bernardel and McGiveron2010; Müller, Dyksterhuis & Rey, Reference Müller, Dyksterhuis and Rey2012). However, the pattern of strain associated with this deformation is not quite understood.
Simplified tectonic framework and plate boundary forces around Indo-Australian Plate (Hillis et al. Reference Hillis, Sandiford, Reynolds, Quigley, Johnson, Doré, Gatliff, Holdsworth, Lundin and Ritchie2008; Rajabi et al. Reference Rajabi, Heidbach, Tingay and Reiter2017b). Large solid blue arrows show the mean regional orientation of maximum horizontal stress (SHmax) within Australian stress provinces. The size of the arrows indicates the SHmax consistency within the provinces, in which type-1 is the most reliable mean SHmax and type-6 is the least reliable (Rajabi et al. Reference Rajabi, Heidbach, Tingay and Reiter2017b).
(a) ETOPO1 digital elevation model of the Australian and Pacific plates (Amante & Eakins, Reference Amante and Eakins2009) and a simplified tectonic framework showing sedimentary basins in eastern Australia. Offshore basins are from Wilcox & Sayers (Reference Willcox and Sayers2002). BB – Biloela Basin; BT – Banana Thrust; CB – Capricorn Basin; C&F.B – Capel and Faust basins; Ch.P – Chesterfield Plateau; CMB – Clarence-Moreton Basin; GB – Gunnedah Basin; Gip.B – Gippsland Basin; GoB – Gower Basin; LB – Lara Basin; LHR – Lord Howe Rise; MB – Moore Basin; MiB – Middleton Basin; MnB – Monawai Basin; MP – Marion Plateau; QP – Queensland Plateau; SB – Surat Basin; SyB – Sydney Basin; TB – Townsville Basin. (b) Simplified geological map of eastern Australia showing Permian–Triassic faults (Korsch et al. Reference Korsch, Totterdell, Cathro and Nicoll2009b) and previously mapped Cenozoic faults and folds (Korsch et al. Reference Korsch, Totterdell, Cathro and Nicoll2009b; Babaahmadi & Rosenbaum, Reference Babaahmadi and Rosenbaum2014a, b; Babaahmadi, Rosenbaum & Esterle, Reference Babaahmadi, Rosenbaum and Esterle2015) (see Fig. 1 for location). DF – Demon Fault; FZ – folded zone; GOZ – Gogango Overfolded Zone; JTZ – Jellinbah Thrust Zone; NPFS – North Pine Fault System.
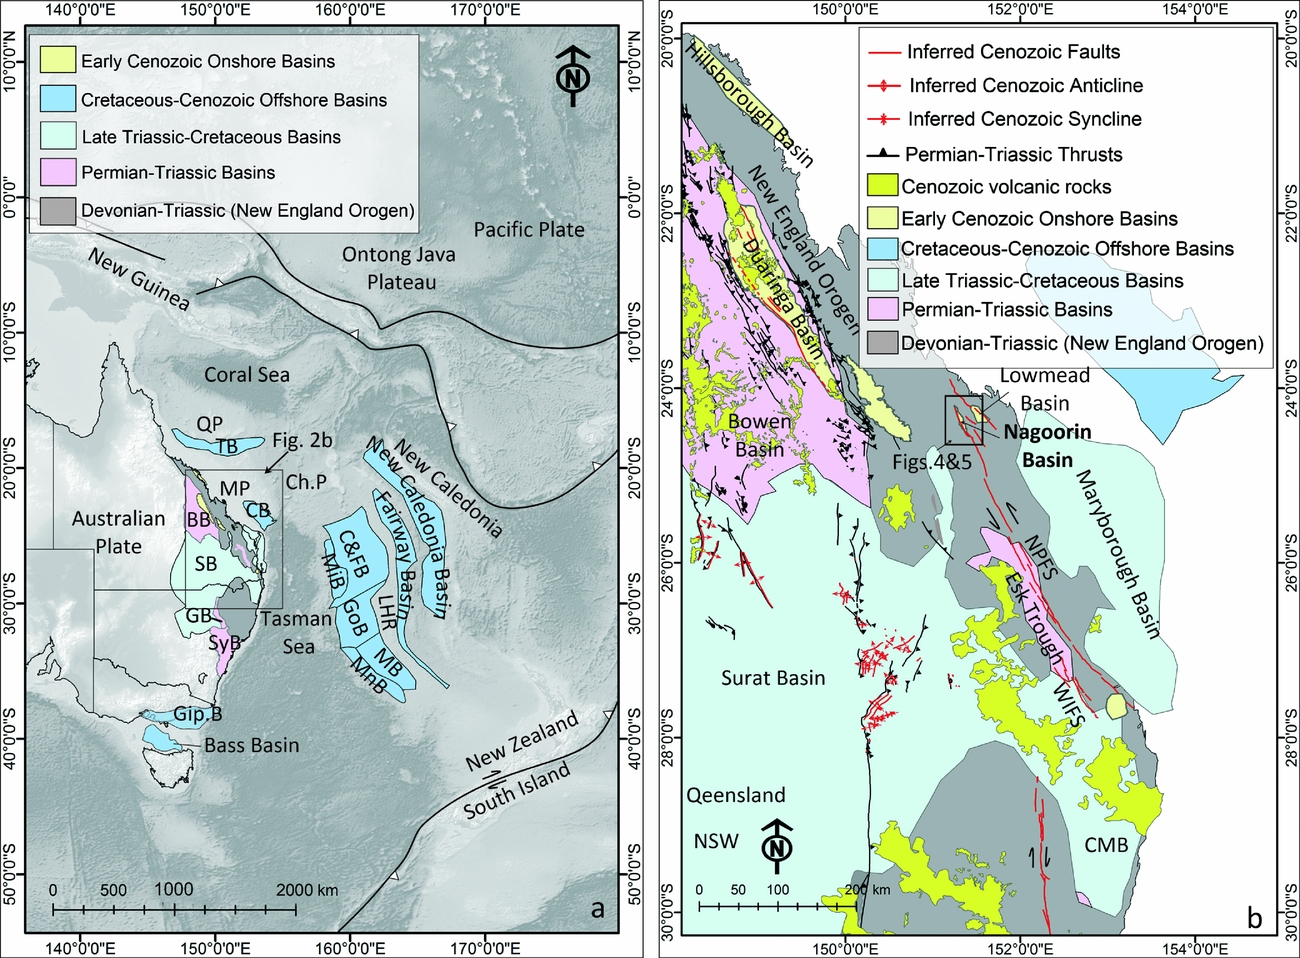
NNW-striking fault-bounded sedimentary basins, such as the Nagoorin, Duaringa, and Hillsborough basins (Fig. 2b), are major elements of the Late Cretaceous – early Cenozoic extensional regime in eastern Queensland (Gray, Reference Gray, Leslie, Evans and Knight1976; Gibson, Reference Gibson1989; Korsch, Reference Korsch and McClay2004; Cook & Jell, Reference Cook, Jell and Jell2013). Relatively little is known about late Cenozoic deformation style in these basins. Late Cenozoic intraplate contractional deformation in eastern Queensland is expressed by oblique reverse strike-slip faults, such as the North Pine and West Ipswich fault systems (NPFS and WIFS) (Babaahmadi & Rosenbaum, Reference Babaahmadi and Rosenbaum2014a, b) (Fig. 2b). Nonetheless, there are still open questions regarding the kinematics and deformation intensity associated with late Cenozoic structures. In particular, it is unclear to what extent the reactivation of pre-existing structures contributed to the deformation of early Cenozoic basins and to the neotectonics of eastern Australia.
In this paper, we present results of a structural investigation in the Nagoorin Basin. We have studied the deformation style and intensity of this basin by utilizing recent two-dimensional open-file seismic surveys and gridded aeromagnetic data. The results of this study, in conjunction with previous data and the new Australian Stress Map (Rajabi et al. Reference Rajabi, Heidbach, Tingay and Reiter2017a, b), further elucidate the pattern of Cenozoic strain in eastern Australia.
2. Geological setting
Australia has a complex neotectonic stress pattern (Coblentz et al. Reference Coblentz, Sandiford, Richardson, Zhou and Hillis1995; Reynolds, Coblentz & Hillis, Reference Reynolds, Coblentz and Hillis2002; Dyksterhuis, Müller & Albert, Reference Dyksterhuis, Müller and Albert2005; Müller, Dyksterhuis & Rey, Reference Müller, Dyksterhuis and Rey2012; Heidbach et al. Reference Heidbach, Rajabi, Reiter and Ziegler2016; Rajabi et al. Reference Rajabi, Heidbach, Tingay and Reiter2017a, b). The new release of the Australian Stress Map revealed four major trends for the orientation of maximum horizontal stress (SHmax) in the Australian continent, including: a NE–SW-oriented SHmax in northern and northeastern Australia; E–W-oriented SHmax in most parts of western and south Australia; and ENE–WSW-oriented SHmax in most parts of eastern Australia that rotates to NW–SE in southeastern Australia (Fig. 1) (Rajabi et al. Reference Rajabi, Heidbach, Tingay and Reiter2017b). In addition to the SHmax orientation the analysis of tectonic stress regimes, based on analyses of different data and 3D geomechanical and numerical modelling, suggests that the upper part of the Australian continental crust is predominately subjected to a thrust faulting stress regime, whereas deeper parts of the crust are subjected to a strike-slip regime (Heidbach et al. Reference Heidbach, Rajabi, Reiter and Ziegler2016; Rajabi et al. Reference Rajabi, Heidbach, Tingay and Reiter2017a, b; Tavener, Flottmann & Brooke-Barnett, Reference Tavener, Flottmann, Brooke-Barnett, Turner, Healy, Hillis and Welch2017).
The study area is located in eastern Australia where Cenozoic sedimentary and volcanic rocks partially cover older Palaeozoic–Mesozoic rocks of the New England Orogen. The New England Orogen consists of (1) Devonian–Carboniferous supra-subduction units including some older remnants of lower Palaeozoic ophiolitic assemblages (Leitch, Reference Leitch1975; Day, Murray & Whitaker, Reference Day, Murray and Whitaker1978; Henderson et al. Reference Henderson, Fergusson, Leitch, Morand, Reinhardt, Carr, Flood and Aitchison1993; Holcombe et al. Reference Holcombe, Stephens, Fielding, Gust, Little, Sliwa, McPhie, Ewart, Ashley and Flood1997a); (2) lower Permian magmatic rocks (Shaw & Flood, Reference Shaw and Flood1981; Hensel, McCulloch & Chappell, Reference Hensel, McCulloch and Chappell1985) that possibly formed in a back-arc extensional setting (Korsch et al. Reference Korsch, Totterdell, Cathro and Nicoll2009a; Rosenbaum, Li & Rubatto, Reference Rosenbaum, Li and Rubatto2012); (3) lower Permian – Upper Triassic sedimentary basins, including the Bowen, Gunnedah and Sydney basins (Korsch & Totterdell, Reference Korsch and Totterdell2009; Korsch et al. Reference Korsch, Totterdell, Cathro and Nicoll2009a); and (4) middle Permian – lower Upper Triassic calc-alkaline magmatic rocks (Shaw & Flood, Reference Shaw and Flood1981) that accompanied phases of the contractional deformation, commonly referred to as the Hunter-Bowen Orogeny (HBO) (Holcombe et al. Reference Holcombe, Stephens, Fielding, Gust, Little, Sliwa, McPhie, Ewart, Ashley and Flood1997b; Korsch et al. Reference Korsch, Totterdell, Cathro and Nicoll2009b; Babaahmadi et al. Reference Babaahmadi, Sliwa, Esterle and Rosenbaum2017a; Hoy & Rosenbaum, Reference Hoy and Rosenbaum2017).
The New England Orogen is overlain by Upper Triassic and younger (Jurassic – Lower Cretaceous) sedimentary basins which developed in two major phases (Korsch et al. Reference Korsch, O'Brien, Sexton, Wake-Dyster and Wells1989; Holcombe et al. Reference Holcombe, Stephens, Fielding, Gust, Little, Sliwa, McPhie, Ewart, Ashley and Flood1997b). The earlier episode of basin formation, which occurred during early Late Triassic time, was associated with a major rifting phase that led to the development of small basins such as the Ipswich Basin (Korsch et al. Reference Korsch, O'Brien, Sexton, Wake-Dyster and Wells1989; Holcombe et al. Reference Holcombe, Stephens, Fielding, Gust, Little, Sliwa, McPhie, Ewart, Ashley and Flood1997b). The second episode of basin formation, spanning latest Late Triassic – Early Cretaceous time, was associated with thermal relaxation subsidence that gave rise to the development of the Clarence-Moreton, Surat and Maryborough basins (Korsch et al. Reference Korsch, O'Brien, Sexton, Wake-Dyster and Wells1989; Hill, Reference Hill1994; Holcombe et al. Reference Holcombe, Stephens, Fielding, Gust, Little, Sliwa, McPhie, Ewart, Ashley and Flood1997b; Korsch & Totterdell, Reference Korsch and Totterdell2009).
From Late Cretaceous to early Eocene time, the eastern Australian margin was subjected to continental fragmentation that accompanied the opening of the Tasman and Coral seas (Weissel & Watts, Reference Weissel and Watts1979; Gaina et al. Reference Gaina, Müller, Royer, Stock, Hardebeck and Symonds1998a, b). This resulted in the development of a series of onshore and offshore sedimentary basins across the New England Orogen (Fig. 2) (Gray, Reference Gray, Leslie, Evans and Knight1976; Hill, Reference Hill1994; Struckmeyer et al. Reference Struckmeyer, Symonds, Fellows and Scott1994; Struckmeyer & Symonds, Reference Struckmeyer and Symonds1997; Gaina et al. Reference Gaina, Müller, Royer, Stock, Hardebeck and Symonds1998a, b; Korsch et al. Reference Korsch, Borham, Totterdell, Shaw and Nicoll1998; Colwell et al. Reference Colwell, Hashimoto, Rollet, Higgins, Bernardel and McGiveron2010). Many of the onshore basins have been interpreted as steep half-grabens or grabens that formed in a transtensional tectonic environment (Gibson, Reference Gibson1989; Cook & Jell, Reference Cook, Jell and Jell2013). Although these basins contain sub-economic oil shale deposits, they have not been explored in detail; exploration data are sparse.
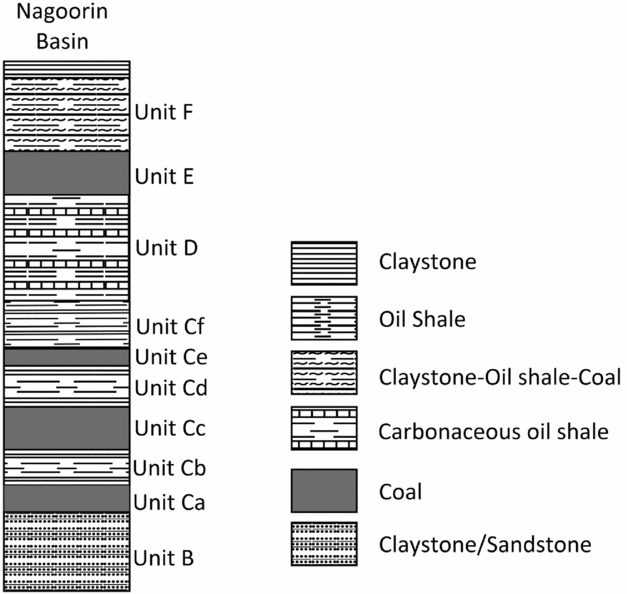
In this study, we present structural observations from the Nagoorin Basin, which is a small elongated NNW-striking basin (c. 40 km long and 5 km wide) in eastern Queensland. This basin is filled by nearly 1000 m of fluvial sedimentary rocks known as the Nagoorin beds (Henstridge & Hutton, Reference Henstridge and Hutton1987; Cook & Jell, Reference Cook, Jell and Jell2013) (Fig. 2b). Lithological units include oil shale, claystone, mudstone, coal, sandstone and conglomerate (units B to F) (Henstridge & Hutton, Reference Henstridge and Hutton1987; Cook & Jell, Reference Cook, Jell and Jell2013) (Fig. 3), which is similar to the stratigraphy of the Cenozoic Lowmead Basin to the east (Fig. 2b) (McConnochie & Henstridge, Reference McConnochie and Henstridge1985). A middle–late Eocene age has been suggested for the upper 350 m of the Nagoorin beds (units C to E) based on palynological studies (Wood, Reference Wood1982).
Stratigraphic units of the Nagoorin beds, including five units (Henstridge & Hutton, Reference Henstridge and Hutton1987; Gibson, Reference Gibson1989).

3. Methods
Geophysical data used in this work include open-file 2D seismic lines and data from a regional airborne magnetic survey in the Nagoorin Basin provided by the Geological Survey of Queensland. The seismic lines in the Nagoorin Basin are from the Boyne River survey in 2008 (Nightingale, Reference Nightingale2011). In order to fully characterize deformation style in the basin, the interpretation of seismic lines was integrated with aeromagnetic data. The seismic lines allow us to interpret faults based on the offset and distortion of the reflectors along the fault zones. There are several open-file exploration boreholes in the Nagoorin Basin, but only two boreholes (Boyne River 1 and 2; Robbie, Reference Robbie2004; Pinder, Reference Pinder2011) intersect the Palaeozoic basement and were used to support the interpretation of top basement in seismic lines (Fig. 4b). For this purpose, we used the average velocity of c. 2400 m s–1 estimated from two deep boreholes in another early Cenozoic basin (the Duaringa Basin) in eastern Queensland, which includes almost the same lithological units as the Nagoorin Basin.
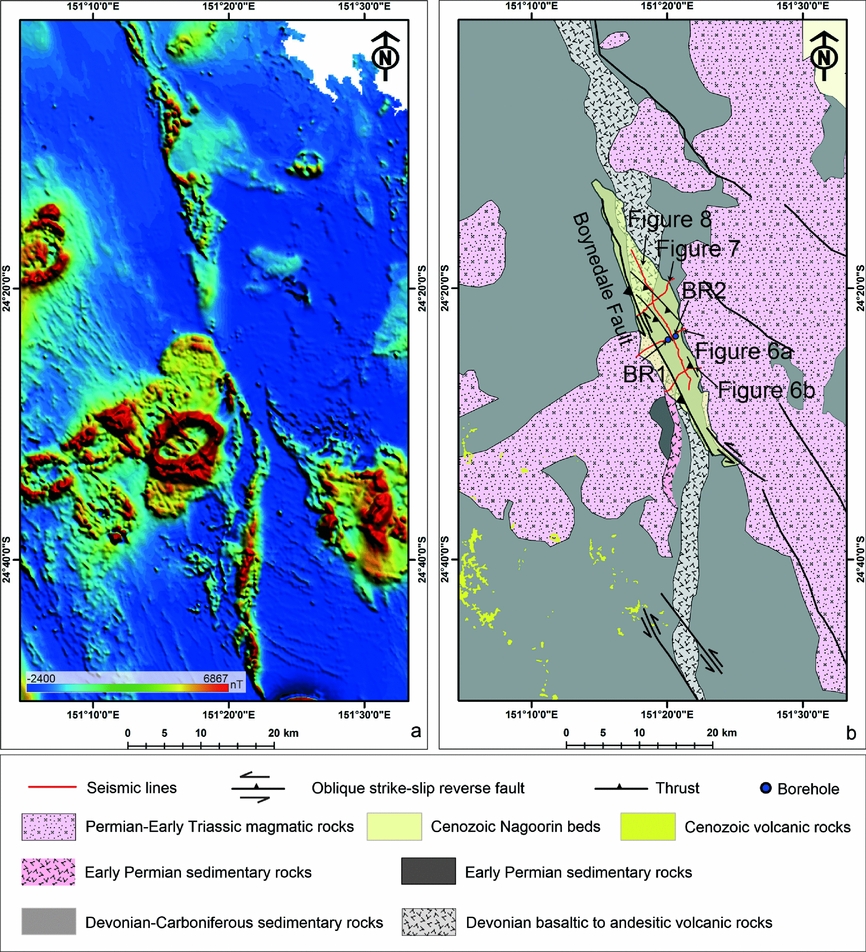
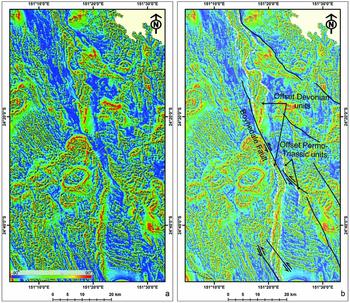
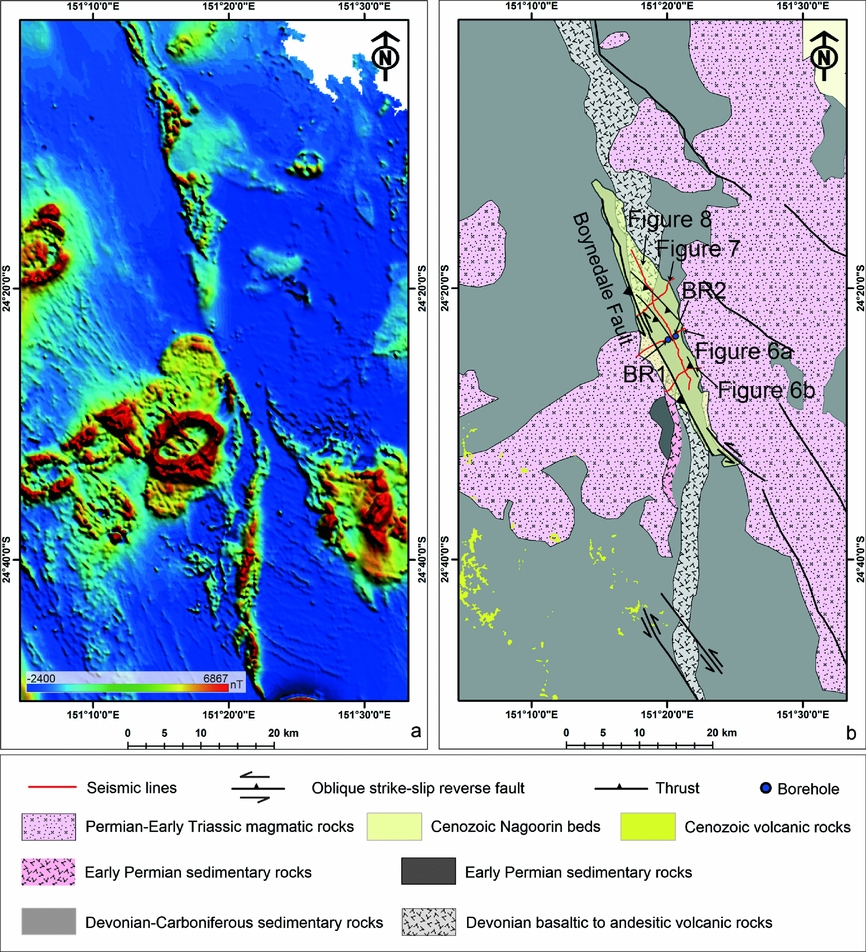
(a) Reduced-to-pole (RTP) image of the Nagoorin Basin and surrounding area. (b) An interpreted geological map from the RTP image. The interpretation was assisted by the 1:250,000 Monto and Bundaberg geological maps (Ellis & Whitaker, Reference Ellis and Whitaker1976; Murphy, Reference Murphy1976). BR1 – Boyne River 1; BR2 – Boyne River 2.
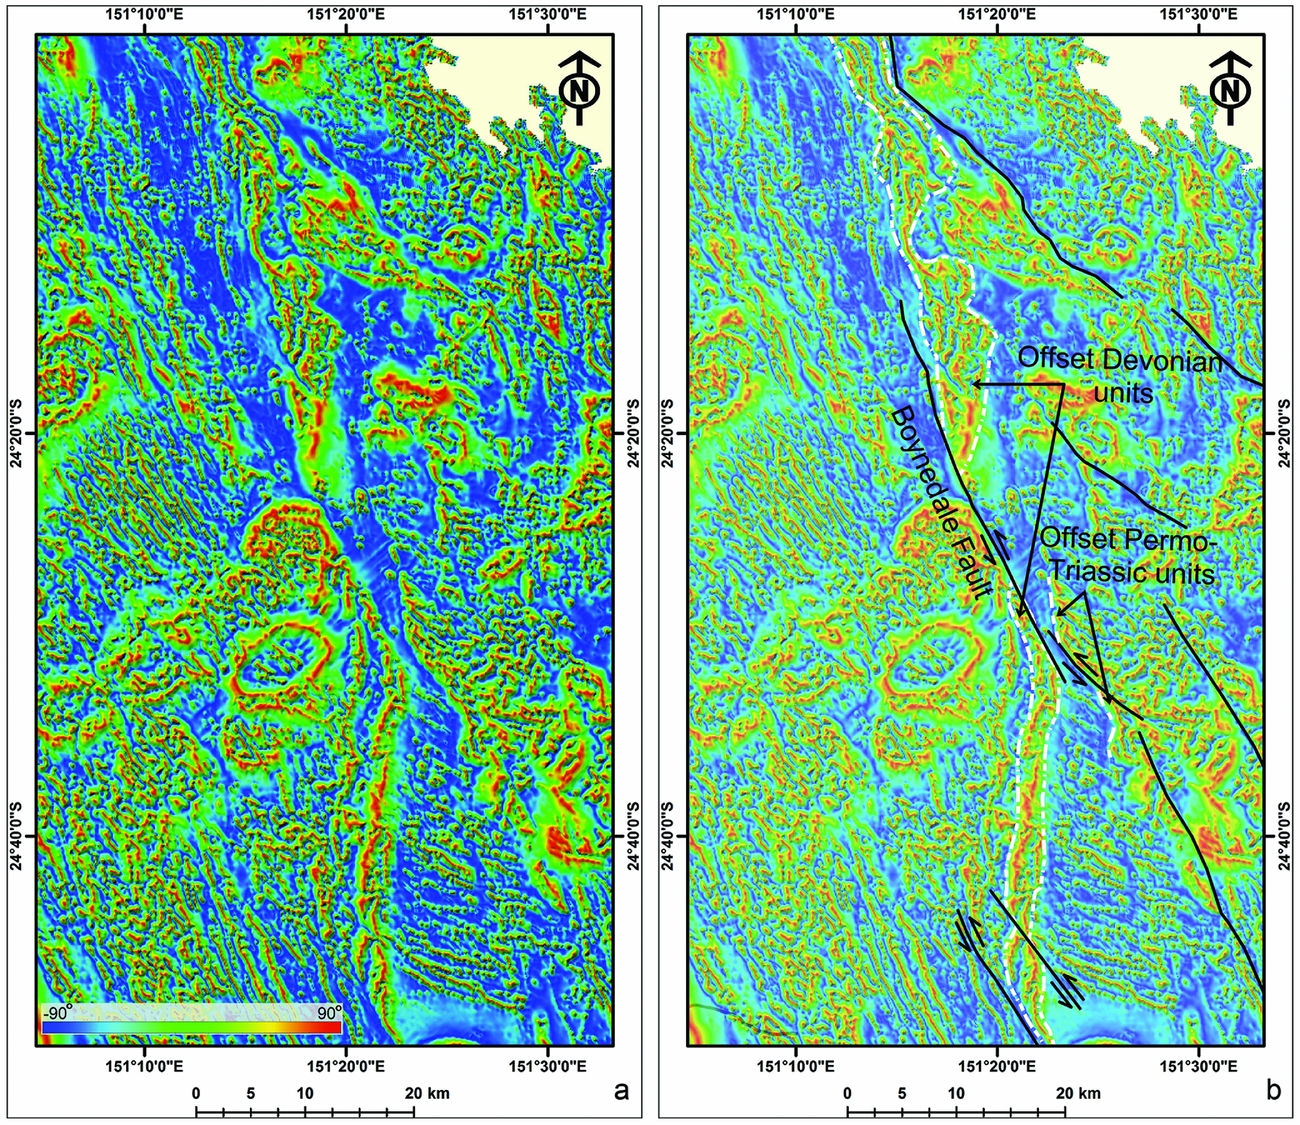
Reduced-to-pole (RTP) gridded aeromagnetic data were obtained from the Geological Survey of Queensland (http://qdexdata.dnrm.qld.gov.au/). The survey was originally flown at 200–400 m line spacing and 80 m height above ground level grid, then gridded to 100 m cell size. Anomalies in the RTP data are directly above their sources. For better recognition of magnetic bodies and faults, we utilized the tilt angle derivative (TAD) of RTP grids (Fig. 3), which enhances the edges of magnetic sources from both shallow and deep sources, and is calculated as the arc-tangent of the ratio of the first vertical derivative to the absolute value of the total horizontal derivatives (Miller & Singh, Reference Miller and Singh1994). Aeromagnetic data allowed us to recognize major faults based on offset and dragging of magnetic anomalies along faults and pronounced structural lineaments.
4. Results
4.a. Interpretation of aeromagnetic data
The RTP magnetic image shows various negative and positive magnetic anomalies in the Nagoorin Basin region (Fig. 4a). By comparison with geological maps (Ellis & Whitaker, Reference Ellis and Whitaker1976; Murphy, Reference Murphy1976), it appears that negative low-amplitude magnetic anomalies are related to Devonian – lower Permian sedimentary rocks, Permian–Triassic felsic intrusive rocks and the rocks of the Nagoorin beds (Fig. 4). Two N-striking positive high-amplitude linear magnetic anomalies correspond to Devonian basaltic and andesitic rock units (Fig. 4). Permian–Triassic mafic to andesitic volcanic and intrusive rocks are characterized by positive moderate- to high-amplitude anomalies (Fig. 4).
NNW-striking magnetic lineaments, interpreted as major faults in the area, are expressed as sharp negative discontinuities in the RTP and TAD images (Figs 4a, 5). These faults sinistrally displaced Devonian–Triassic rock units (Fig. 5). One of these NNW-striking faults is the Boynedale Fault, which runs along the western border of the Nagoorin Basin (Figs 4b, 5). The Boynedale Fault has a strike-slip component that dragged and separated the N-striking belt of Devonian volcanic rocks sinistrally by a maximum of c. 16 km (Figs 4, 5).
(a, b) Tilt angle derivative image showing the trace of the Boynedale Fault and other NNW-striking faults displacing Palaeozoic – lower Mesozoic rocks.
4.b. Interpretation of seismic reflection data
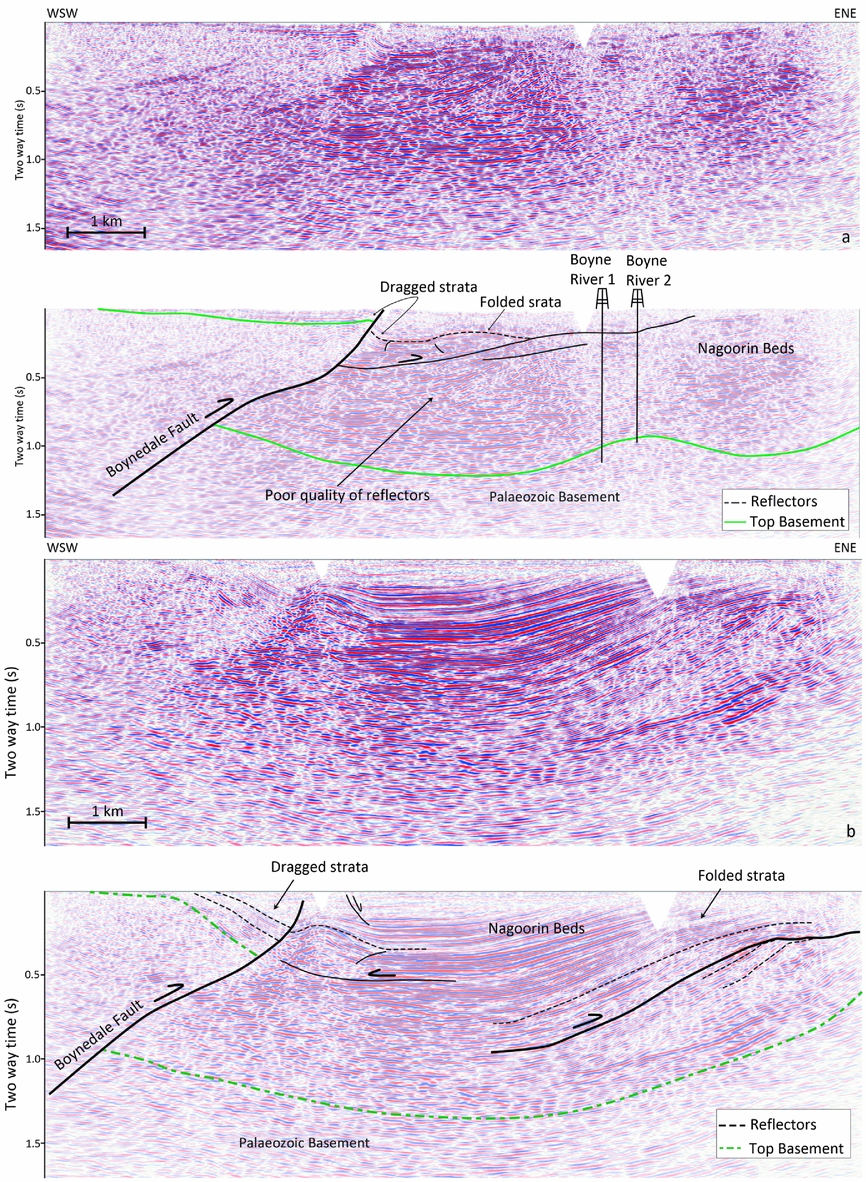
The interpretation of seismic lines shows moderate to strong, continuous seismic anomalies associated with oil shale and coal measures of the Nagoorin beds (Figs 6–8). The units underneath the basin succession are characterized by poor coherent reflectors, which are interpreted as Devonian–Carboniferous basement rocks (Figs 6–8).
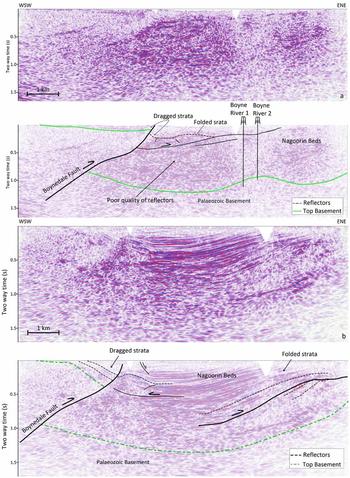
Migrated seismic lines (a) BRS-03 and (b) BRS-04 (see Fig. 4b for location) indicate that the Boynedale Fault displaced the western margin of the Nagoorin Basin succession. The vertical:horizontal scale is almost 1:1.
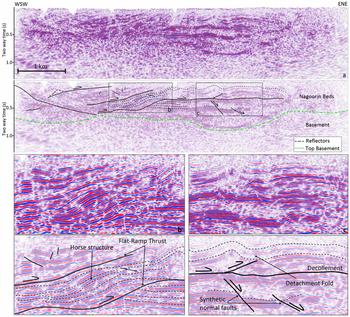
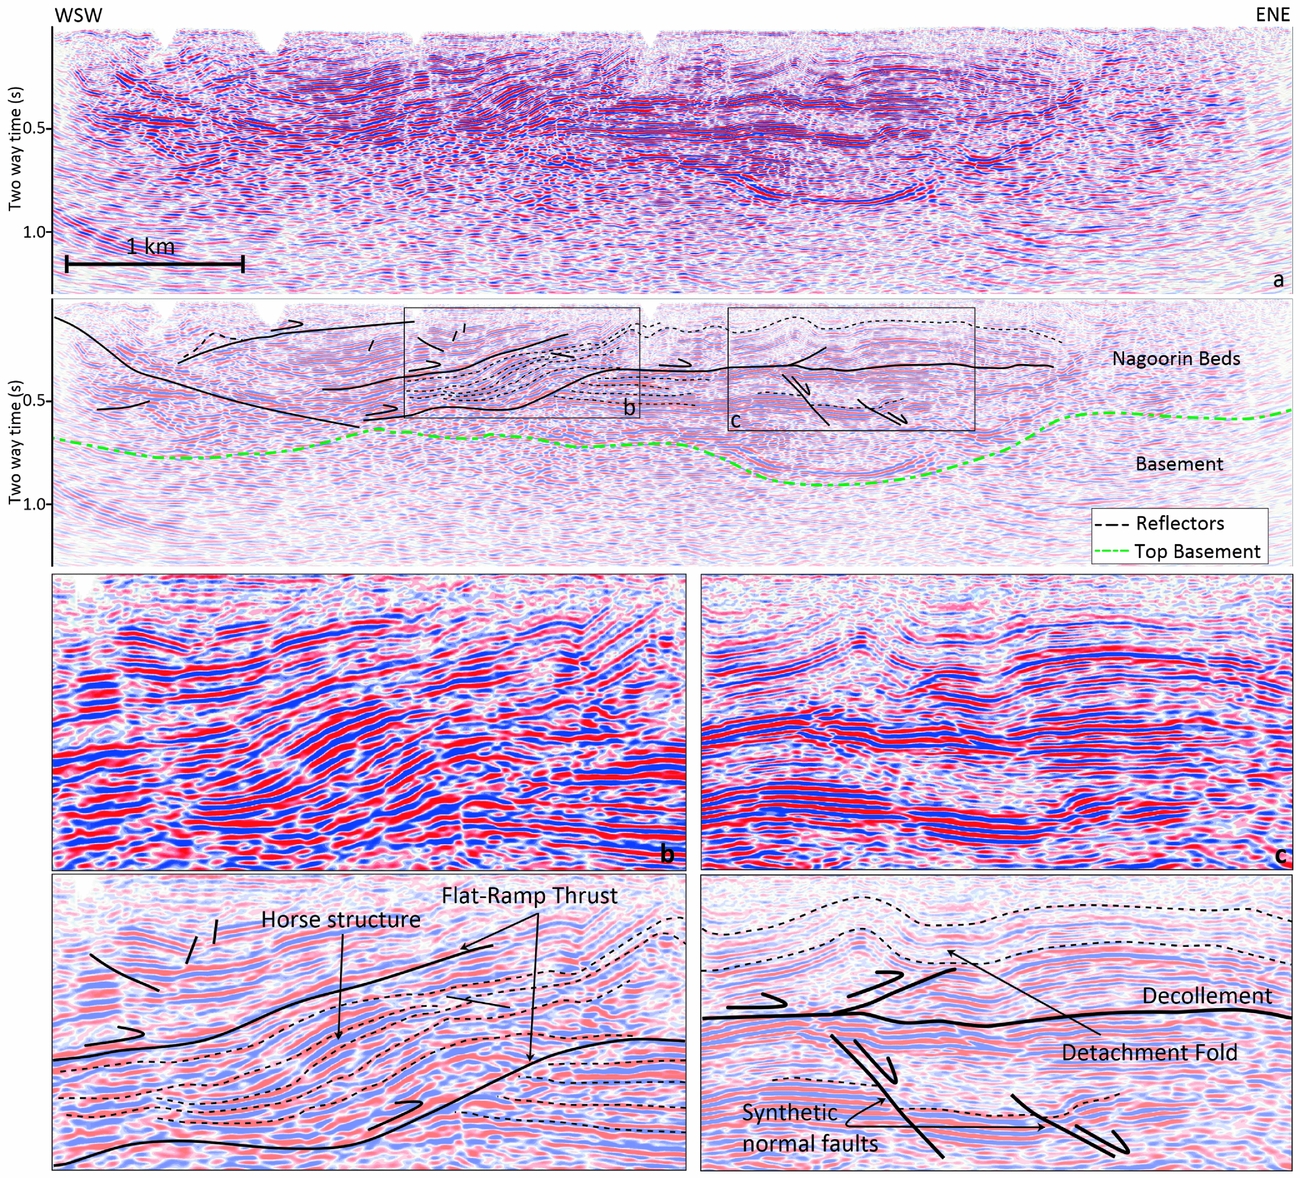
(a) Migrated seismic line BRS-02 (see Fig. 4c for location) shows that the Nagoorin beds were displaced by a series of thin-skinned thrusts. (b) A horse structure associated with a flat-ramp thrust. (c) A series of detachment folds over a bedding-parallel décollement. The vertical:horizontal scale is almost 1:1.
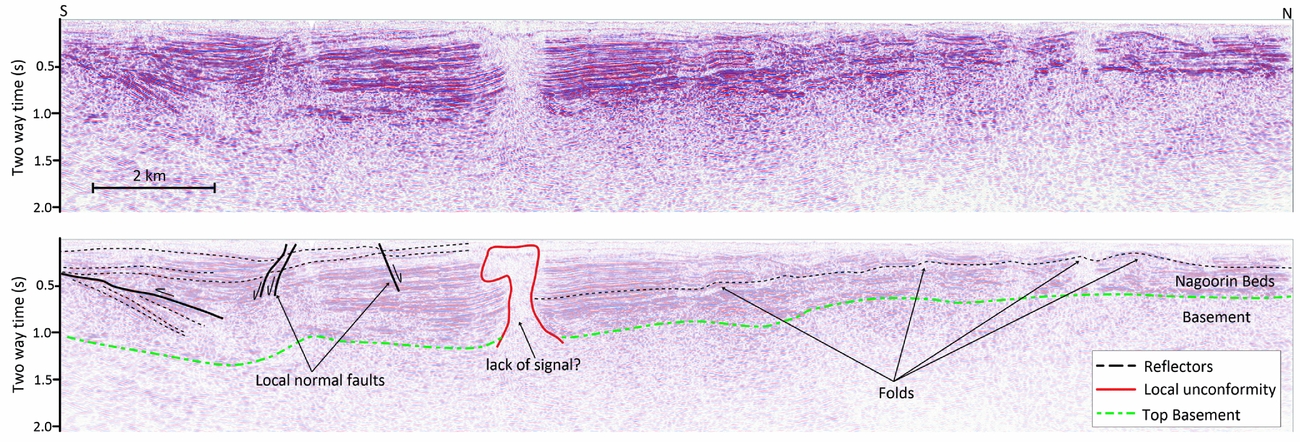
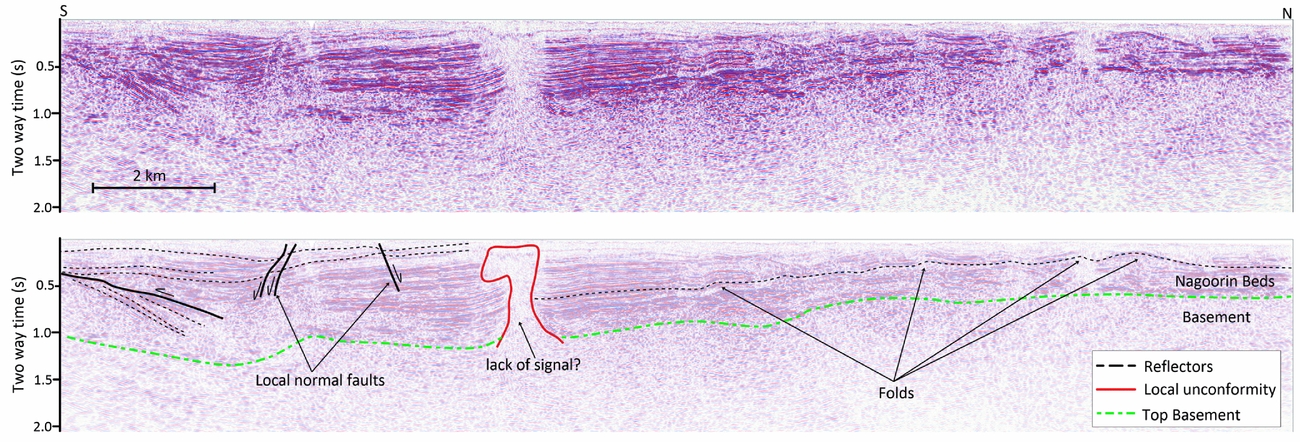
Migrated seismic line BRS-01 (see Fig. 4c for location) parallel to the strike of the Boynedale Fault shows folds in the Nagoorin beds in the north and a few small normal faults in the south.
The Nagoorin beds were deformed by numerous faults (Figs 6–8). The interpretation of seismic lines BRS-03 and BRS-04 show that a SW-dipping reverse fault along the western margin of the basin juxtaposed basement rocks against the Nagoorin beds (Fig. 6). The correlation of this fault with gridded aeromagnetic data (Figs 4, 5) reveals that it corresponds to the Boynedale Fault. The maximum fault throw along the Boynedale Fault is c. 0.75 s two-way time (Fig. 6a). Assuming an average velocity of c. 2400 m s–1 in the Nagoorin Basin, the fault throw is estimated as c. 900 m.
A series of other thrust faults displaced the Nagoorin beds (Figs 6, 7). A shallow thrust is observed in seismic lines BRS-03 and BRS-04, producing an E-verging hanging-wall anticline in the Nagoorin beds (Fig. 6). Based on the correlation between seismic lines, a NW orientation is interpreted for these thrusts, oblique to the Boynedale Fault (Fig. 4b). Another thrust is observed in migrated seismic line BRS-02, where horizontal reflectors are placed against a series of oblique reflectors (Fig. 7a, b). The thrust has a flat-ramp geometry, propagating between the horizontal and oblique reflectors. Oblique reflectors have a sigmoidal shape, which is interpreted as a thrust-bounded horse structure (Fig. 7a, b). A series of upright synclines and anticlines are observed in the upper parts of the sedimentary rocks to the east of the interpreted horse structure (Fig. 7a, c). These structures are interpreted as detachment folds developed over a bedding-parallel décollement, which is the continuation of the flat part of the thrust (Fig. 7a, c). Two small normal faults, which are observed below the bedding-parallel décollement, are interpreted as synthetic shears (Fig. 7c). The interpretation of seismic line BRS-01, which is parallel to the Boynedale Fault, indicates that the Nagoorin beds were displaced by three small normal faults in the south and deformed by a series of folds in the north (Fig. 8).
5. Discussion
5.a. Timing of deformation
The Nagoorin Basin is of early Cenozoic age, as indicated by middle–late Eocene palynological ages of samples from units C to E (Fig. 2; Wood, Reference Wood1982). Unit F is also proposed to have been deposited during late Eocene – early Oligocene time. It has been suggested that the basin developed in response to syndepositional normal faults during an early Cenozoic extensional regime (Cook & Jell, Reference Cook, Jell and Jell2013). However, interpretation of aeromagnetic data and seismic lines does not reveal evidence of syndepositional boundary faults around the Nagoorin Basin. As the main structure displacing the western margin of the basin succession, the SW-dipping Boynedale Fault could not act as a NE-dipping boundary fault during the development of the basin.
The exact timing of contractional deformation in the Nagoorin Basin is not well constrained. Cenozoic contractional deformation may have been driven by far-field compressional stresses transmitted from the boundary of the Australian Plate since late Eocene time in response to collision and obduction events (Veevers, Reference Veevers2000; Schellart, Lister & Toy, Reference Schellart, Lister and Toy2006; Knesel et al. Reference Knesel, Cohen, Vasconcelos and Thiede2008). Notable events include late Eocene and late Oligocene – early Miocene obduction events in New Caledonia and New Zealand, respectively, and late Oligocene to recent collisional events along the margins of New Guinea (Hall, Reference Hall2002; Hill & Hall, Reference Hill, Hall, Hillis and Müller2003; Holm, Rosenbaum & Richards, Reference Holm, Rosenbaum and Richards2016), New Zealand (Kamp, Reference Kamp1986; Schellart, Lister & Toy, Reference Schellart, Lister and Toy2006) and Ontong Java Plateau (Petterson et al. Reference Petterson, Neal, Mahoney, Kroenke, Saunders, Babbs, Duncan, Tolia and McGrail1997, Reference Petterson, Babbs, Neal, Mahoney, Saunders, Duncan, Tolia, Magua, Qopoto, Mahoaa and Natogga1999). Given that sedimentation in the Nagoorin Basin occurred until late Eocene time and likely continued in early Oligocene time, we suggest that the timing of contractional deformation is after the late Oligocene Epoch. This suggestion is consistent with the observation that the whole succession of the Nagoorin beds is displaced by the Boynedale Fault and thrust faults (Figs 6, 7). Moreover, there is evidence in southeastern Queensland that volcanic rocks dated at c. 30–20 Ma (Cohen, Vasconcelos & Knesel, Reference Cohen, Vasconcelos and Knesel2007; Knesel et al. Reference Knesel, Cohen, Vasconcelos and Thiede2008) were displaced by contractional/transpressional faults (Babaahmadi & Rosenbaum, Reference Babaahmadi and Rosenbaum2014b).
Evidence for contractional/transpressional deformation is also observed in adjacent Upper Triassic – Lower Cretaceous basins in eastern Australia, such as the Clarence-Moreton (O'Brien et al. Reference O'Brien, Korsch, Wells, Sexton, Wake-Dyster, Wells and O'Brien1994), Maryborough (Hill, Reference Hill1994; Lipski, Reference Lipski, Hill and Bernecker2001), and Surat (Korsch et al. Reference Korsch, Totterdell, Cathro and Nicoll2009b) basins. Some authors have suggested that this contractional deformation occurred during mid-Cretaceous time (Hill, Reference Hill1994; Korsch et al. Reference Korsch, Totterdell, Cathro and Nicoll2009b), but in the context of the results of this study it is likely that deformation took place during Cenozoic time. The mid-Cretaceous event was just an uplift event before Late Cretaceous – early Cenozoic seafloor spreading in eastern Gondwana, and there are no convincing observations to show that this event was contractional. In addition, during Late Cretaceous and early Cenozoic time rifting and seafloor spreading were responsible for fragmentation of eastern Australia, a process that involved normal and strike-slip faulting accompanied by the formation of extensional sedimentary basins (Fig. 2). Reverse movement along these basin faults could only occur after the cessation of extensional deformation. Reverse faulting, folding and unconformities have also been reported in Cenozoic sediments of offshore basins, such as the Capricorn, Townsville, Capel and Faust basins (Clarke, Paine & Jensen, Reference Clarke, Paine and Jensen1971; Hill, Reference Hill1992; Struckmeyer & Symonds, Reference Struckmeyer and Symonds1997; Colwell et al. Reference Colwell, Hashimoto, Rollet, Higgins, Bernardel and McGiveron2010). Cenozoic contractional events resulted in multiple reactivation of structures since late Eocene time (Babaahmadi & Rosenbaum, Reference Babaahmadi and Rosenbaum2014a, b).
5.b. Kinematics of deformation
The deformation style in the Nagoorin Basin is dominated by contractional/transpressional structures. The main structure is the NNW-striking SW-dipping Boynedale Fault, which is an oblique sinistral-reverse fault, displacing the western margin of the basin with a maximum of c. 900 m fault throw and c. 16 km sinistral strike-slip separation (Figs 4–6). The Nagoorin beds were also displaced by thin-skinned thrusts and normal faults (Figs 7, 8) which occur east of the Boynedale Fault and are confined within the Nagoorin beds. We interpret these faults to be subsidiary structures, which developed in response to the contractional/transpressional movement of the Boynedale Fault. The thin-skinned thrusts are of low angle (<30°) and, in some cases, present a flat-ramp geometry associated with horses and detachment folds, giving rise to a significant deformation in the Nagoorin beds (Figs 6, 7). The large amount of oil shale and claystone in the Nagoorin beds creates detachment surfaces that may have facilitated the development of the flat-ramp geometry of thrusts and associated detachment folds.
The Boynedale Fault appears to be the northwards continuation of the NNW-striking oblique sinistral reverse NPFS and WIFS (Fig. 2b; Babaahmadi & Rosenbaum, Reference Babaahmadi and Rosenbaum2014a). The amount of reverse vertical separation along the NPFS is unknown; however, the maximum sinistral separation along the NPFS is c. 8.2 km (along the northern segment), which is less than the c. 16 km inferred for the Boynedale Fault (Babaahmadi & Rosenbaum, Reference Babaahmadi and Rosenbaum2014a). It is likely that a major part of the strike-slip movement along the Boynedale Fault occurred before late Cenozoic time, that is, prior to the establishment of the late Cenozoic far-field stress field that led to reverse faulting along the Boynedale Fault and associated thrusts. Indeed, relatively minor strike-slip faulting has been estimated from Cenozoic volcanic rocks, with a maximum c. 4 km strike-slip separation (Babaahmadi & Rosenbaum, Reference Babaahmadi and Rosenbaum2014b) and only c. 1.5 km offset along the southern part of the NPFS (Babaahmadi & Rosenbaum, Reference Babaahmadi and Rosenbaum2014a). Strike-slip faulting along the Boynedale Fault and the NPFS therefore likely occurred during earlier tectonic events during Mesozoic and early Cenozoic time.
5.c. Implications for neotectonics
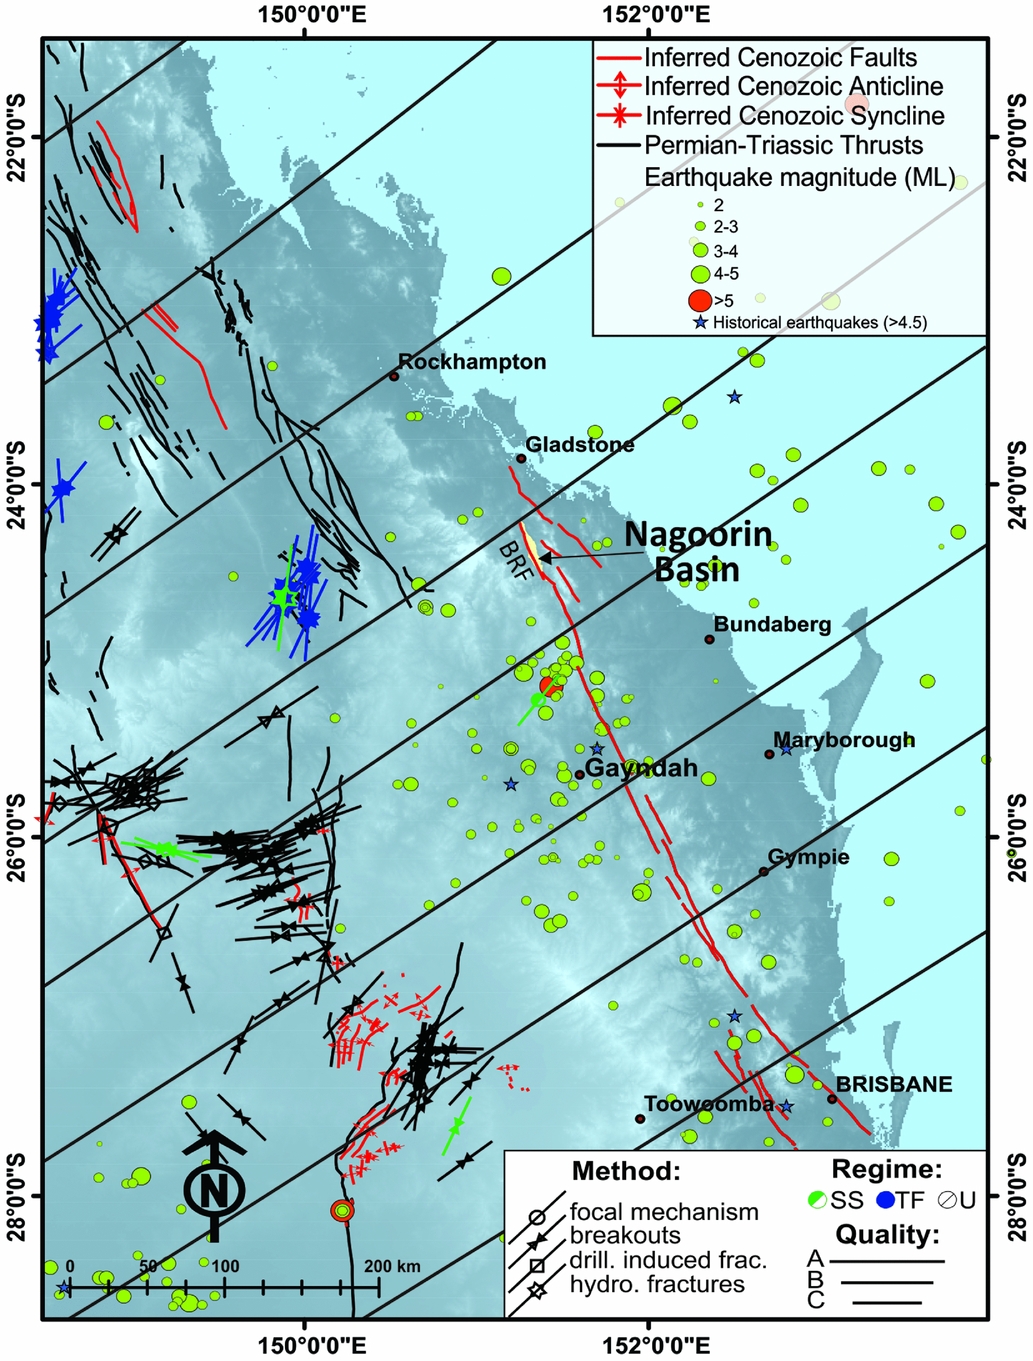
Numerous large earthquakes (M > 4) occurred in eastern Queensland (Fig. 9) according to the catalogue of historically and instrumentally recorded intraplate earthquake epicentres since 1875 (Rynn et al. Reference Rynn, Denham, Greenhalgh, Jones, Gregson, McCue and Smith1987; McKavanagh et al. Reference McKavanagh, Boreham, Cuthbertson, McCue and Cooper1993; McCue, Reference McCue1996). A relatively high density of these earthquakes occurred along major fault zones, such as the WIFS and NPFS (Hodgkinson, McLoughlin & Cox, Reference Hodgkinson, McLoughlin and Cox2007; Fig. 9), raising the possibility that these faults, including the Boynedale Fault and associated thrusts, are neotectonic reactivated pre-existing structures. Evidence for intraplate neotectonic activity is also known from southeastern, southern and western Australia (Sandiford, Reference Sandiford2003b; Quigley, Cupper & Sandiford, Reference Quigley, Cupper and Sandiford2006; Hillis et al. Reference Hillis, Sandiford, Reynolds, Quigley, Johnson, Doré, Gatliff, Holdsworth, Lundin and Ritchie2008; Quigley, Clark & Sandiford, Reference Quigley, Clark, Sandiford, Bishop and Phillans2010; Keep, Hengesh & Whitney, Reference Keep, Hengesh and Whitney2012; McPherson et al. Reference McPherson, Clark, Macphail and Cupper2014; Whitney, Hengesh & Gillam, Reference Whitney, Hengesh and Gillam2016).
A map showing the earthquake epicentres in eastern Queensland and the orientation of present-day SHmax. Instrumentally recorded earthquakes were obtained from Geoscience Australia Earthquakes and historical earthquakes are from Rynn et al. (Reference Rynn, Denham, Greenhalgh, Jones, Gregson, McCue and Smith1987). The neotectonic stress map of eastern Queensland is from Rajabi et al. (Reference Rajabi, Heidbach, Tingay and Reiter2017b). Different colours show the tectonic stress regime (SS – strike-slip; TF – thrust; U – unknown) and different symbols represent the orientation of maximum horizontal stress. Note that the length of the lines is proportional to the quality of the SHmax data records based on the World Stress Map ranking criteria (Heidbach et al. Reference Heidbach, Rajabi, Reiter and Ziegler2016). The A, B and C lines indicate that the SHmax orientation is reliable within ±15°, ±(15–20)° and ±(20–25)°, respectively. Grey solid lines show stress trajectories for the first-order SHmax orientation in eastern Queensland (i.e. long-wavelength SHmax pattern generated by plate tectonic forces; see Rajabi et al. Reference Rajabi, Heidbach, Tingay and Reiter2017b for more detail). BF – Boynedale Fault; NPFS – North Pine Fault System; WIFS – West Ipswich Fault System.
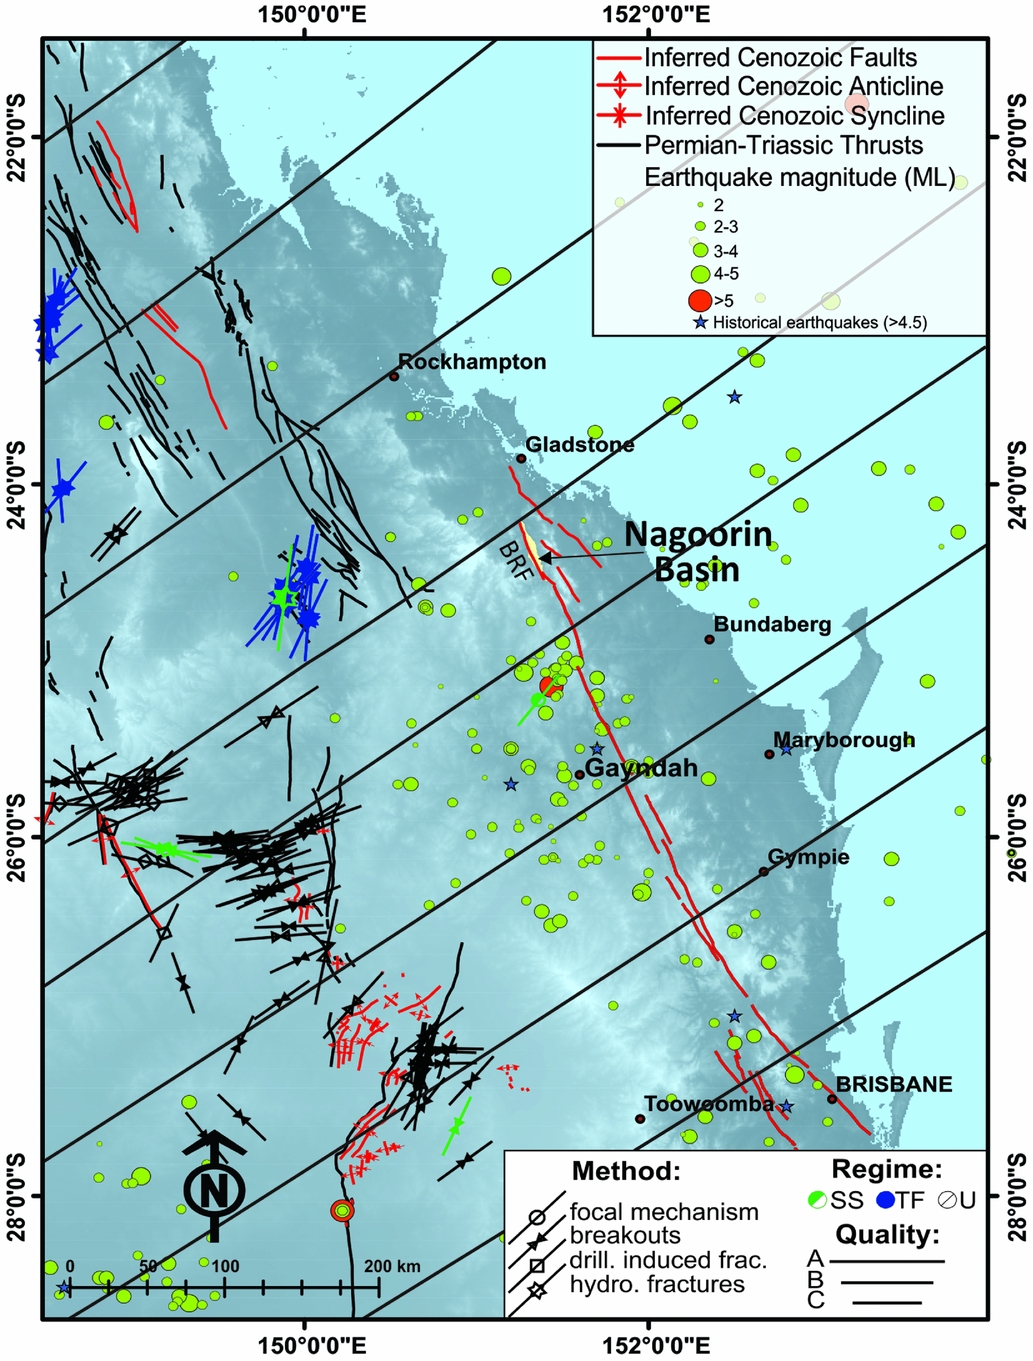
The long-wavelength state of stress in eastern Queensland in the vicinity of the Nagoorin Basin can be determined from analyses of petroleum well data, engineering data and focal mechanism solution of earthquakes (Rajabi et al. Reference Rajabi, Heidbach, Tingay and Reiter2017a, b). The stress field shows a NE–SW-oriented SHmax (Figs 1, 9), which is consistent with neotectonic thrusting along NNW-striking faults such as the Boynedale Fault and NPFS. Two- and three-dimensional geomechanical–numerical models have demonstrated that the contemporary state of stress in Australia, at the first-order, is primarily controlled by plate tectonic forces generated at the boundary of the Indo-Australian Plate (Coblentz et al. Reference Coblentz, Sandiford, Richardson, Zhou and Hillis1995; Reynolds, Coblentz & Hillis, Reference Reynolds, Coblentz and Hillis2002; Dyksterhuis, Müller & Albert, Reference Dyksterhuis, Müller and Albert2005; Rajabi et al. Reference Rajabi, Heidbach, Tingay and Reiter2017a, b).
5.d. Pattern of Cenozoic strain in eastern Australia
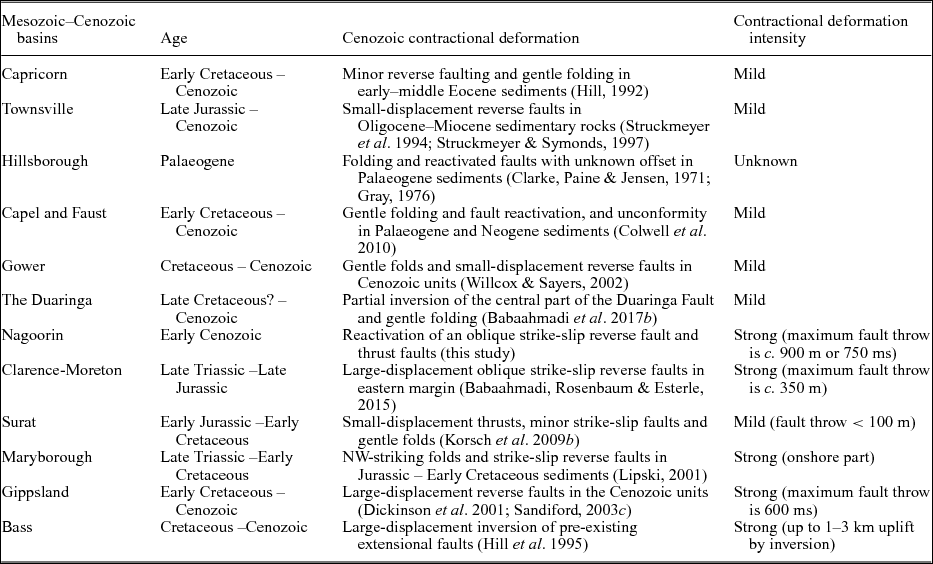
The results of this study, in conjunction with previous investigations, show variations in the intensity of cumulative Cenozoic (late Eocene – present) contractional deformation across Mesozoic–Cenozoic basins in eastern Australia (Table 1). Contractional deformation in the Nagoorin beds that involved activity along the Boynedale Fault appears to be relatively strong. This deformation is comparable with the noticeable contractional strain documented from Cenozoic basins in the southeastern margin of Australia, such as the Bass and Gippsland basins (Table 1) (Hill et al. Reference Hill, Hill, Cooper, O'Sullivan, O'Sullivan, Richardson, Buchanan and Buchanan1995; Dickinson et al. Reference Dickinson, Wallace, Holdgate, Daniels, Gallagher and Thomas2001; Sandiford, Reference Sandiford2003a), and in the eastern margin of the Mesozoic Clarence-Moreton and Maryborough basins (Lipski, Reference Lipski, Hill and Bernecker2001; Babaahmadi, Rosenbaum & Esterle, Reference Babaahmadi, Rosenbaum and Esterle2015) (Table 1). In contrast, offshore basins such as the Capricorn, Townsville, Gower, Capel and Faust basins (Hill, Reference Hill1992; Struckmeyer & Symonds, Reference Struckmeyer and Symonds1997; Willcox & Sayers, Reference Willcox and Sayers2002; Colwell et al. Reference Colwell, Hashimoto, Rollet, Higgins, Bernardel and McGiveron2010), were only subjected to mild contractional deformation (Table 1). Similarly, contractional deformation in onshore basins, such as the Surat and Duaringa basins, and other parts of the Clarence-Moreton Basin is limited to mild partial inversion and reactivation of pre-existing faults, gentle folding and strike-slip reverse faults with minor displacement (e.g. < 100 m throw) (Korsch et al. Reference Korsch, Totterdell, Cathro and Nicoll2009b; Babaahmadi, Sliwa & Esterle, Reference Babaahmadi, Sliwa and Esterle2016; Babaahmadi et al. Reference Babaahmadi, Sliwa, Esterle and Rosenbaum2017b) (Fig. 10).
Cenozoic contractional reactivation/inversion events in several Mesozoic–Cenozoic sedimentary basins in eastern and southeastern Australian margins.

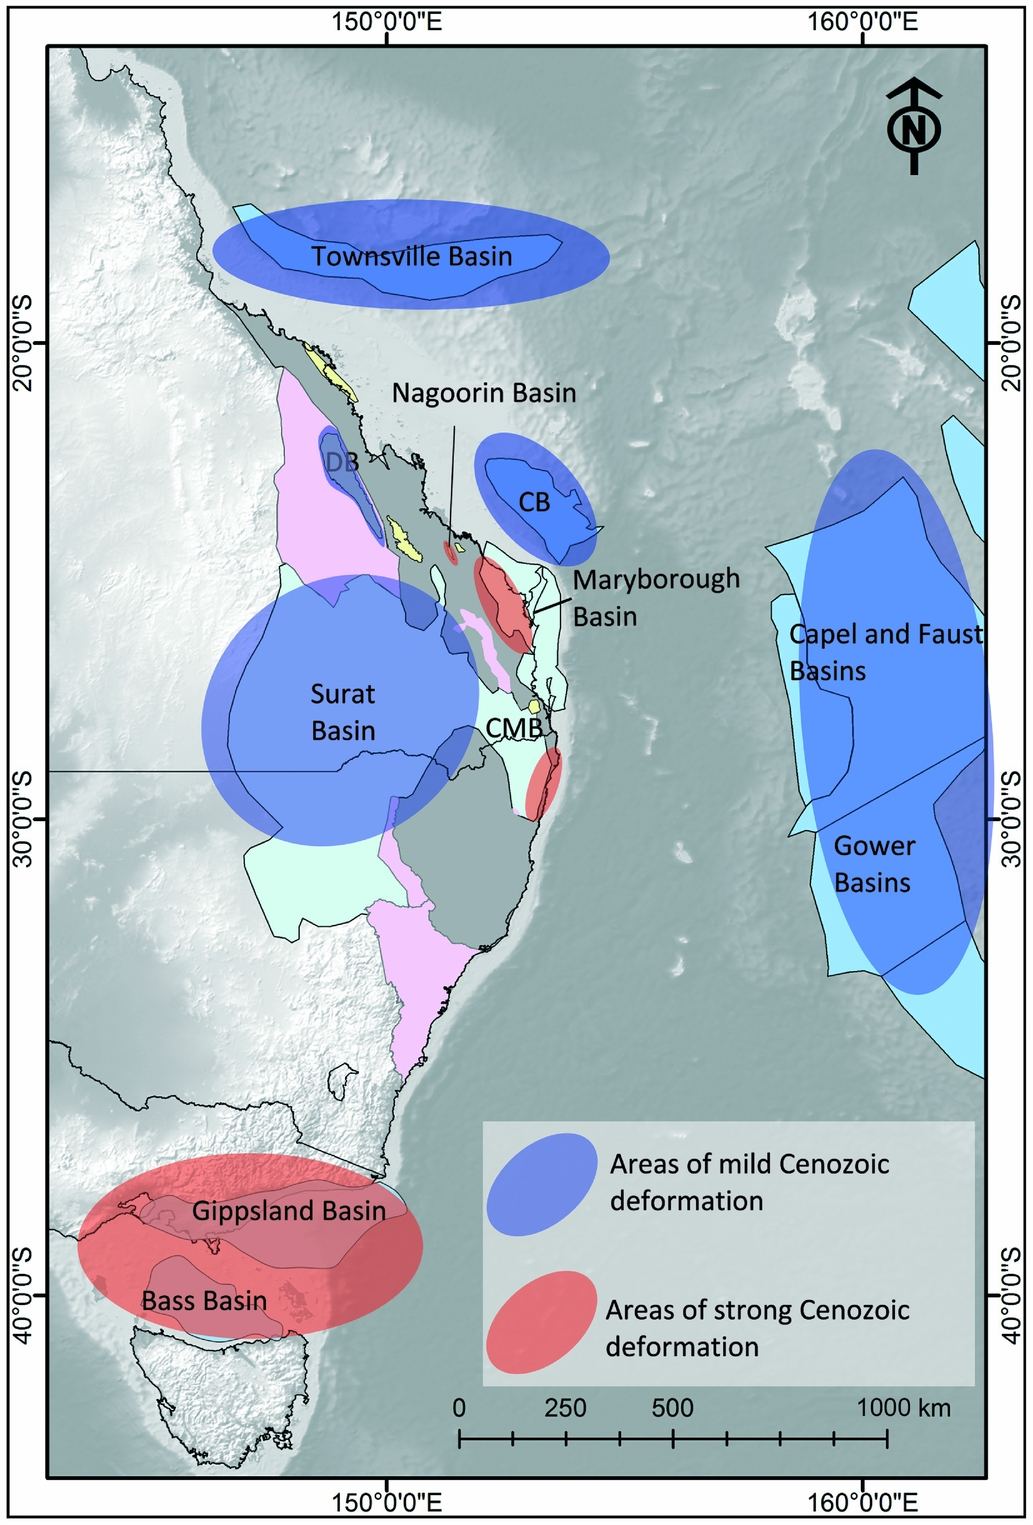
(a) A map showing the sedimentary basins affected by Cenozoic deformation. Blue areas were affected by mild contractional deformation, whereas red areas were affected by strong deformation. Strong Cenozoic deformation is expressed along the continental margins. See Figure 2a for legends and abbreviations.
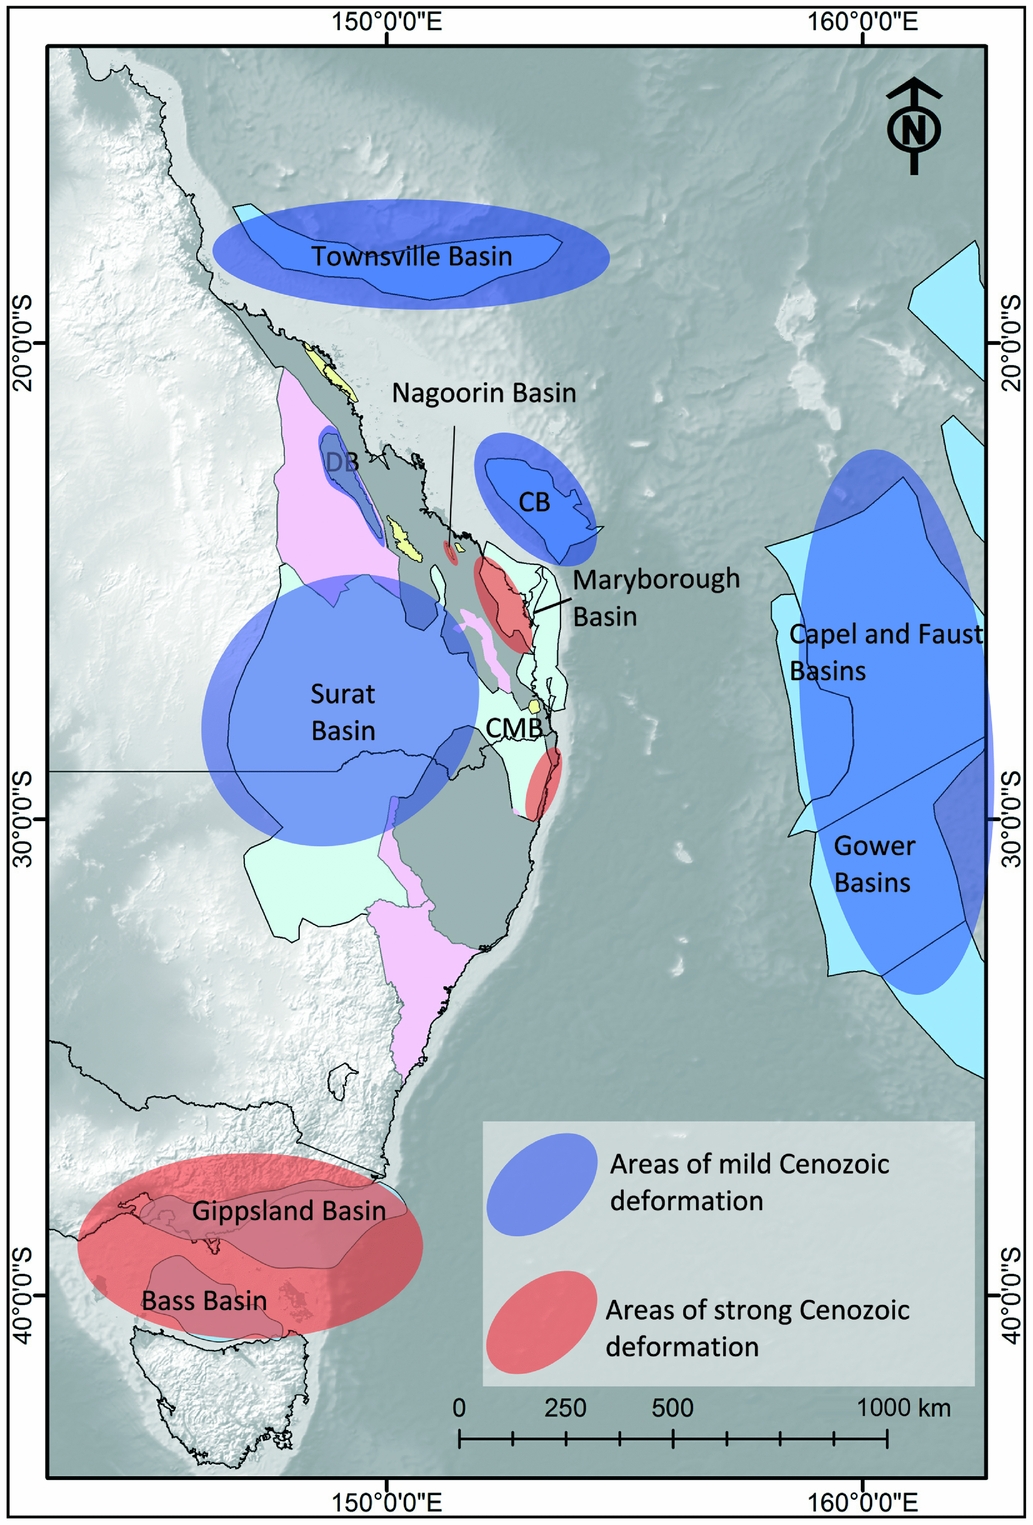
These observations indicate that the intensity of Cenozoic contractional deformation increases toward the continental margins (red circles in Fig. 10, colour online). This is explained by the occurrence of pre-existing crustal weakness zones in continental margins, likely associated with late Mesozoic – early Cenozoic rift-related structures. We suggest that these pre-existing marginal weakness zones were subjected to large-displacement Cenozoic reactivation in response to horizontal far-field stresses transmitted from the plate boundaries.
6. Conclusions
Evidence for contractional deformation in the Nagoorin Basin provides an insight into the intensity of late Cenozoic deformation in eastern Australia. Our observations indicate that the western margin of the Nagoorin Basin succession was displaced by a NNW-striking SW-dipping strike-slip reverse fault (Boynedale Fault) with a maximum vertical throw of c. 900 m. This deformation likely occurred after late Oligocene – early Miocene time, in response to far-field compressional stresses transmitted from collisional events at the Australian plate boundaries. The Boynedale Fault, which is the northwards continuation of a long NNW-striking fault, sinistrally displaced a N-striking Devonian volcanic belt by a maximum of c. 16 km. NNW-striking faults, including the Boynedale Fault, are interpreted as potentially active structures with a possible neotectonic thrust movement in response to the currently NE–SW-oriented SHmax. A series of low-angle (<30°) thin-skinned thrusts with a flat-ramp geometry also displaced the Nagoorin beds. The development of these thrusts was facilitated by the presence of oil shale and claystone in the Nagoorin beds that acted as detachment surfaces. The overall intensity of deformation in the Nagoorin Basin is relatively high, and is comparable to inferred contractional deformation in basins along the southeastern margin of Australia and in the eastern margin of the Clarence-Moreton and Maryborough basins. This indicates that weakness zones at continental margins are more prone to large-displacement deformation in response to far-field stress.
Acknowledgements
The authors acknowledge the Vale-UQ Coal Geoscience Program and ACARP Project C24032: Supermodel 2015 - Fault Characterization in Permian to Jurassic Coal Measures for financial support of a postdoctoral fellowship for the first author. We thank two anonymous reviewers for their constructive comments on the earlier version and Steve Hearn for help with the interpretation of seismic lines.