Lameness is increasingly a global welfare (Espejo et al. Reference Espejo, Endres and Salfer2006; Bruijnis et al. Reference Bruijnis, Beerda, Hogeveen and Stassen2012; Fabian et al. Reference Fabian, Laven and Way2014), production and economic problem (Cha et al. Reference Cha, Hertl, Bar and Grohn2010) in the dairy industry. Production effects of lameness are decreased milk yields, lowered reproductive efficiency, and increased risk of involuntary culling. Analysis of milk yields, reproductive failure and treatment expenditures showed costs of all lameness problems were $177·62 (Cha et al. Reference Cha, Hertl, Bar and Grohn2010). With the prevalence of US lameness estimated at 12·5% (USDA, 2008) in 9·3 million lactating cows (2014 consensus), total US costs of lameness are $2·8 billion. By comparison, prevalence's of mastitis and reproductive failure are 18·2 and 10% (USDA, 2008). Analysis of milk yields, reproductive failure and treatment expenditures showed costs of all intramammary infections were $151·06 (Cha et al. Reference Cha, Bar, Hertl, Tauer, Bennett, Gonzalez, Schukken, Welcome and Grohn2011) amounting to $2·6 billion across 9·3 million US cows. Prevalence of clinical mastitis is greater than lameness but the costs to producers are nearly identical.
The search to develop accurate, objective automated methods of lameness detection produced a number of different systems (Flower et al. Reference Flower, Sanderson and Weary2006; Rajkondawar et al. Reference Rajkondawar, Liu, Dyer, Neerchal, Tasch, Lefcourt, Erez and Varner2006; Pastell & Kujala, Reference Pastell and Kujala2007; Pastell et al. Reference Pastell, Hautala, Poikalainen, Praks, Veermae, Kujala and Ahokas2008, Reference Pastell, Hänninen, De Passillé and Rushen2010; Maertens et al. Reference Maertens, Vangeyte, Baert, Jantaun, Martens, De Campeneere, Pluk, Opsomer, Van Weyenberg and Van Nuffel2011). Most approaches are based on the assumption cows with painful lesions shift weight from the painful limb to the less painful contralateral limb. System designs incorporated weight platforms instrumented with load cells to detect symmetric or asymmetric loadbearing across limbs of standing cows (Neveux et al. Reference Neveux, Weary, Rushen, Von Keyserlingk and De Passillé2006; Chapinal et al. Reference Chapinal, Rushen, de Passille and Wagner2010). Animals must remain on platforms for prescribed time periods to record peak and average vertical force, and frequency of weight removal from limbs. Other approaches have employed video systems to monitor locomotion and determine kinematic variables (Flower et al. Reference Flower, Sanderson and Weary2006) or monitor topical thermography to detect inflammatory lesions (Nikkhah et al. Reference Nikkhah, Plaizier, Einarson, Berry, Scott and Kennedy2005, Alsaaod & Buscher, Reference Alsaaod and Buscher2012). Maertens et al. (Reference Maertens, Vangeyte, Baert, Jantaun, Martens, De Campeneere, Pluk, Opsomer, Van Weyenberg and Van Nuffel2011) employed pressure mats to evaluate symmetry of step width, stride length, and time, tracking up, relative pressure, and hind limb step abduction.
We proposed an automated, objective system using parallel force-plates could provide cost-effective lameness detection in cattle (Rajkondawar et al. Reference Rajkondawar, Lefcourt, Neerchal, Dyer, Varner, Erez and Tasch2002). The hardware was designed to detect forces only in the vertical dimension (1D) based on the assumption pain in one limb inevitably shifted weight bearing to the contralateral sounder limb. When the hardware and predictive model of lameness were validated, the system correctly identified sound cows (high specificity) but inadequately identified lame cows (low sensitivity) (Liu et al. Reference Liu, Dyer, Neerchal, Tasch and Rajkondawar2011). Curiously, the sensitivity issue conflicted with the low specificity concerns reported by Bicalho et al. (Reference Bicalho, Cheong, Cramer and Guard2007). Analysis of the true positive (TP) and false negative (FN) data sets in our study (Liu et al. Reference Liu, Dyer, Neerchal, Tasch and Rajkondawar2011) showed both groups of animals had exactly the same level of locomotion, lesion and pain scores. The vertical GRFs were decreased (relative to sound animals) in the TP group but unchanged relative to sound animals in the FN group. The result implied cows with identical levels of clinical lameness inconsistently shifted weight-bearing off painful limbs. Together with the findings that relatively painful, lesion-bearing lateral claws were paired with painless, lesion-free medial claws (Clarkson et al. Reference Clarkson, Downham, Faull, Hughes, Manson, Merrit, Murray, Russel, Sutherst and Ward1996, Dyer et al. Reference Dyer, Neerchal, Tasch, Wu, Dyer and Rajkondawar2007, Liu et al. Reference Liu, Dyer, Neerchal, Tasch and Rajkondawar2011), we speculated many cows with painful lateral claws shifted loadbearing onto the sound medial digit of the same limb. Load shifts across digits within the same limb would not change at least the average, the peak, and the impulse of the vertical ground reaction force nor the stance time on the lame limb. As a result these cows would remain invisible to force-plate systems restricted to the vertical dimension (Liu et al. Reference Liu, Dyer, Neerchal, Tasch and Rajkondawar2011).
Analysis of locomotion across three dimensions (3D) provided considerably more data than the single, 1D vertical dimension on GRFs during weight bearing (van der Tol et al. Reference van der Tol, Metz, Noordhuizen-Stassen, Back, Braam and Weijs2003; Walker et al. Reference Walker, Pfau, Channon and Wilson2010). Tang et al. (Reference Tang, Tasch, Neerchal, Zhu and Yarowsky2009a, Reference Tang, Lovering, Roche, Bloch, Neerchal and Taschb, Reference Tang, McDowell, Limsam, Neerchal, Yarowsky and Tasch2010, Reference Tang, Yarowsky and Tasch2012) successfully employed 3-dimensional force-plate systems to develop predictive algorithms of locomotion deficiencies in Parkinson's disease and amyotrophic lateral sclerosis (ALS) in rats. These studies Tang et al. (Reference Tang, Tasch, Neerchal, Zhu and Yarowsky2009a, Reference Tang, Lovering, Roche, Bloch, Neerchal and Taschb, Reference Tang, McDowell, Limsam, Neerchal, Yarowsky and Tasch2010, Reference Tang, Yarowsky and Tasch2012) together with our earlier lameness work in cattle (Rajkondawar et al. Reference Rajkondawar, Lefcourt, Neerchal, Dyer, Varner, Erez and Tasch2002, Reference Rajkondawar, Liu, Dyer, Neerchal, Tasch, Lefcourt, Erez and Varner2006; Liu et al. Reference Liu, Dyer, Neerchal, Tasch and Rajkondawar2011) suggested predictive models of lameness with higher ability to correctly identify truly lame and truly sound cows would require input from more than the vertical dimension. The objectives of this investigation were to develop force-plate systems to capture forces in three orthogonal directions (3D) on the left and right side of the cow, generate predictive models of lameness, and determine model sensitivity and specificity from a preliminary data set of commercial dairy cows. We hypothesised adding the lateral-medial (x) and braking-acceleratory (y) dimensions to the vertical (z) dimension would produce models correctly identifying lame and sound cows.
Materials and methods
Data collection
The overall approach was to build a parallel force-plate system to measure, in three dimensions, the forces generated by cows as they walked across the system. These forces would be related by an algorithm to clinical classification of locomotion. This algorithm model can then be used to estimate the probability of lameness using the more objective force measurements within and across limbs. The approach would reduce the subjectivity, error and labour intensity associated with visual inspection.
The study was conducted on a commercial dairy farm in Pennsylvania with a herd of 700 Holstein Friesian cows. Cows were housed in an open-sided, free stall barn with grooved cement floors, adjustable curtains, and stalls with beds of dirt floor covered with recycled wood shavings. Freestall floors were automatically flushed 3 times per day. Cows were fed a complete total mixed ration consisting of corn silage, mixed grass, barley or alfalfa haylage, supplemented with high moisture corn, ryelage, soybeans, cotton seed, peanut hulls, and vitamin mineral mix. Cows were milked and walked through a 7% copper sulphate foot bath 3x/d, and feet were trimmed 2x/year by professional hoof trimmers.
3D parallel force-plate system
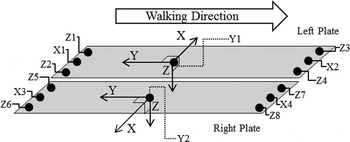
The original 1D parallel force-plate system (Tasch, Reference Tasch2009) was redesigned to capture forces exerted by cows in three directions. A frame housed two parallel plates (each 183 by 35·5 cm), suspended from the frame at each corner and positioned to restrict plate movement with transducers. Each plate was equipped with 7 transducers sampled at 100 Hz. Four transducers detected the vertical forces, 2 transducers measured lateral forces, and one transducer measured longitudinal forces (Fig. 1).
Locations of transducers. Each plate is instrumented with 7 transducers: 4 transducers measure the vertical, z-direction (positive downward); 2 transducers measure the transverse, x-direction (positive for lateral limb movements), and 1 transducer measures the longitudinal, y-direction (positive for acceleratory limb movements).

To eliminate artefacts generated by stepping up or stepping off the force-plates, fixed platforms (120 by 737 cm) were positioned at the entrance and exit of the system. Railings on the left and right side of the force-plate module prevented multiple cows from entering the device.
The module was located at the exit of the milking parlour to enable daily capture of forces and generate data logs without the confounding variable of intramammary milk weight during force collection (Flower et al. Reference Flower, Sanderson and Weary2006). Data logs were generated after each milking and electronically stored in a computer located in the dairy office.
The outputs from the transducers were appended with the date, time, and cow's unique identification number gathered via radio frequency identification (RFID) loop and the data saved as plain text files on a hard drive. A scaling factor generated during post-installation calibration with dead weights was applied to the log data to convert the transducer's output to forces. GRFs derived from the force-time series characterised the strides as the magnitude and direction of reaction forces relative to the ground.
Clinical classification of lameness
Veterinary examinations were performed 1x/week on 16–18 animals selected by the herdsman without regard to locomotion status, parity, production or stage of lactation. Cows were incorporated into the study one time only. All investigators were blinded to the locomotion status of the cow. To avoid between observer disagreement on visual locomotion scores (O'Callaghan et al. Reference O'Callaghan, Cripps, Downham and Murray2003; Bicalho et al. Reference Bicalho, Cheong, Cramer and Guard2007) all clinical examinations were performed by a single veterinarian. Parallel force plates that simultaneously determined ground reaction forces across left and the right limbs compelled clinical locomotion scores (visual, lesion and pain scores) to be determined across right and left limbs. The results from these three steps were incorporated into a clinical locomotion score for each limb according to Liu et al. (Reference Liu, Dyer, Neerchal, Tasch and Rajkondawar2011).
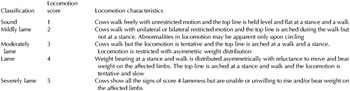
Veterinary evaluation included visual locomotion scores, objective pain detection, lesion diagnosis and lesion score (Sprecher et al. Reference Sprecher, Hosteller and Kaneene1997; Rajkondawar et al. Reference Rajkondawar, Liu, Dyer, Neerchal, Tasch, Lefcourt, Erez and Varner2006; Dyer et al. Reference Dyer, Neerchal, Tasch, Wu, Dyer and Rajkondawar2007).Visual locomotion score was assigned with slight modification of Sprecher et al. (Reference Sprecher, Hosteller and Kaneene1997) (Table 1). Cows were walked along straight runs and circled to the left and right on a grooved, cement floor alleyway, lightly coated with dry wood shavings. Locomotion was evaluated across each of 4 limbs noting relative length of anterior and posterior aspects of the stride, symmetry of the arc of the stride, height of arc, symmetry of stride length between left and right sides for pelvic and pectoral limbs, claw placement relative to midline, arc of thoraco-lumbar line, ease and resistance in movement, and relative symmetry in weight bearing across left and right pelvic or pectoral limbs. Pain scores were determined for lateral and medial claws, and the interdigital skin as described in detail (Dyer et al. Reference Dyer, Neerchal, Tasch, Wu, Dyer and Rajkondawar2007; Liu et al. Reference Liu, Neerchal, Tasch, Dyer and Rajkondawar2009, Reference Liu, Dyer, Neerchal, Tasch and Rajkondawar2011) using a hoof tester fitted with a force gage and an algometer, respectively. Claw compression was applied across the widest region of the sole extending from the axial to abaxial wall (region 4, Shearer et al. Reference Shearer, Anderson, Ayars, Belknap, Berry, Guard, Hoblet, Hovingh, Kirksey, Langill, Mills, Miskimins, Osterstock, Price, Prigel, Roussel, van Amstel, Wallace, Wasson, Cook, Garret, Hostetler and Schugel2004). Cows were acclimated to the procedure by applying pressure to the medial claw. Thereafter, the medial claw was compressed until the limb was voluntarily retracted or a force of 160 N/cm2 was achieved. The same procedure was repeated for the lateral claw. Limbs retracted at forces less than 160 N/cm2 were recorded as evidence of claw pain. A pain index (P i/P max) was calculated where P i was pressure threshold at limb retraction and P max was 160 N/cm2. Pressure on the interdigital skin was applied by an algometer (Dyer et al. Reference Dyer, Neerchal, Tasch, Wu, Dyer and Rajkondawar2007) to a maximum of 10 N/cm2 or until the limb was voluntarily withdrawn. All measures of pain were performed in triplicate to ensure reproducibility.
Description of locomotion scores

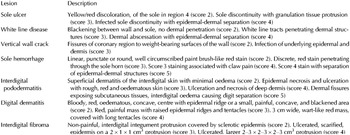
Lesion scores (step 3) were determined as previously described (Rajkondawar et al. Reference Rajkondawar, Liu, Dyer, Neerchal, Tasch, Lefcourt, Erez and Varner2006; Dyer et al. Reference Dyer, Neerchal, Tasch, Wu, Dyer and Rajkondawar2007). Briefly, claws were cleaned and trimmed according to Shearer & van Amstel (Reference Shearer and van Amstel2001). Lesions were diagnosed, located by claw region, and scored by severity (Table 2).
Descriptions of commons lesion scores

The results from these three steps were incorporated into a clinical locomotion score as described by Liu et al. (Reference Liu, Dyer, Neerchal, Tasch and Rajkondawar2011). The presence of a lesion and amount of pain (Dyer et al. Reference Dyer, Neerchal, Tasch, Wu, Dyer and Rajkondawar2007) were incorporated into final decisions about visual locomotion (Table 1). If visual observation rendered a questionable locomotion score of 2–3, 3–4 or 4–5, the presence of a lesion associated with a high lesion score and mild to moderate pain (P i /P max < 1·0, Dyer et al. Reference Dyer, Neerchal, Tasch, Wu, Dyer and Rajkondawar2007) justified assigning the greater of the two scores in question. In contrast questionable visual locomotion scores of 2–3, 3–4 or 4–5 associated with the absence of a lesion, low lesion score and minimal to no pain (P i /P max = 1·0, Dyer et al. Reference Dyer, Neerchal, Tasch, Wu, Dyer and Rajkondawar2007) justified assigning the lower of the two scores in question. The final clinical locomotion score served as the independent variable in model development and was taken as the larger of the two limb scores. Note that final locomotion score in unilaterally lame cows is synonymous with cow locomotion score.
Data analysis
Logs for inspected cows with a clinical locomotion score were collected from the day of and the preceding 2 d before veterinary examination. Logs associated with running, jumping, standing on the plate modules, or unidentifiable cow IDs were discarded. Up to 9 logs (3 d of logs covering 3 milkings/d) were available for each cow. Hind steps, identifiable by telltale double peaks, were identified and time of onset and end of weight bearing was recorded. The GRFs generated during the hind step were converted into limb movement variables (LMVs). A collection of LMVs represents the signature of a cow's hind step.
Limb movement variables
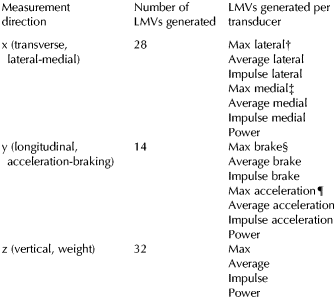
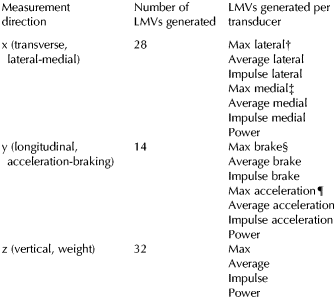
LMV calculations were performed for each of the 14 transducers using only the time interval covering the hind step. The plates were long enough to enable a cow to place all four limbs on the plates simultaneously at some point while in transit on the plates. At that point, the greatest sum of the 8 vertical (z) forces yielded the cow's dynamic weight used to normalise ground reaction forces for each cow. With the addition of stance time (length of time hind claw was in contact with the plate) normalised GRFs and 76 LMVs were generated for each cow (Table 3).
LMVs generated for each of 4 limbs per passage through the module
† Force vector in lateral direction
‡ Force vector in medial direction
§ Force vector in cranial direction
¶ Force vector in caudal direction
Max = Maximum force value in the time series: Average = Average force value in the time series, Impulse = Integrated area under the force-time series, Power = Area under the power spectral density curve between 0 and 20 Hz.
Statistical modelling
Least square estimate functions from the fit model platform of JMP11 were employed to model lame or sound responses from the explanatory effects of visual locomotion score, lateral claw, medial claw and interdigital integument pain indices. Locomotion scores 1 and 2 were collapsed into a single sound group and locomotion scores 3–5 collapsed into a single lame group for left and right limbs. Differences (P ⩽ 0·05) between claw pain, interdigital integument pain, locomotion score and mean maximum lesion score for lame and sound limbs were evaluated by Tukey-Kramer HSD multiple means comparison T test (JMP11).
A model of the probability of lameness was developed by pairing the signature of the cow's step with a clinical diagnosis of lameness. Cows with locomotion scores of 1 and 2 were reclassified as sound while cows with locomotion scores of 3, 4, or 5 were reclassified as lame. After reclassification, modelling was performed with logistic regression as described (Rajkondawar et al. Reference Rajkondawar, Lefcourt, Neerchal, Dyer, Varner, Erez and Tasch2002; Liu et al. Reference Liu, Neerchal, Tasch, Dyer and Rajkondawar2009) where LMVs were the explanatory variable and clinical locomotion score served as the dependent variable. Given the LMVs, the probability of lameness was defined as,
 $$P(\hbox{Cow is Lame} \vert LMVs) = \displaystyle{{e^{{\rm \beta} _0 \sum {{\rm \beta} _i \cdot LMV_i}}} \over {1 + e^{{\rm \beta} _0 \sum {{\rm \beta} _i \cdot LMV_i}}}} $$
where β coefficients for each LMV were determined with logistic regression.
Logistic regression modelling was performed with the PROC LOGISTIC procedure in SAS software (SAS, 2010). All LMV were transformed by B-spline expansion using an optimised number of knots and degrees as described (Liu et al. Reference Liu, Neerchal, Tasch, Dyer and Rajkondawar2009). After LMV transformation (TLMVs), the form of the logistic regression model was,
 $$P(\hbox{Cow is Lame} \vert TLMVs) = \displaystyle{{e^{{\rm \beta} _0 \sum {{\rm \beta} _i \cdot TLMV_i}}} \over {1 + e^{{\rm \beta} _0 \sum {{\rm \beta} _i \cdot TLMV_i}}}} $$
Transformations were completed with PROC TRANSREG, a standard procedure in SAS using a leave-one-out cross-validation routine (LOO). LOO cross-validation drops one observation to use as test data while the remaining observations are used to develop the model. A more robust cross-validation technique leaves out all of the runs for a particular cow – leave-one-cow-out (LOCO) cross-validation – instead of just an individual run. Using a SAS macro in conjunction with PROC LOGISTIC, we employed the more robust LOCO cross-validation technique during the development of our logistic regression model.
Once trained, we evaluated model performance by computing sensitivity, specificity, and area under the receiver operating curve (AUC) to characterise the ability to correctly classify lame and sound cows. Proportions of correctly classified sound, and lame animals were defined as model specificity and sensitivity, and determined as follows.
TP = number of correctly classified lame cows (true positives); TN = number of correctly classified sound cows (true negatives); FP = number of incorrectly classified sound cows (false positives); FN = number of incorrectly classified lame cows (false negatives).
 $$Sensitivity = \displaystyle{{TP} \over {TP + FN}}\quad Sepcificity = \displaystyle{{TN} \over {TN + FP}}$$
Results
Of the 85 cows inspected by the veterinarian, two were removed from the data set due to unusable data. The final database contained 396 observations (runs) comprised of 257 runs among the 50 sound cows and 139 runs among the 33 lame cows. Limb lameness was estimated (r 2 = 0·79 left limb, 0·83 right limb) from visual locomotion scores, interdigital pain indices (P < 0·05) and lateral claw pain indices (P < 0·06) of the left limb and the lateral claw and visual locomotion score of the right limb (P ⩽ 0·05). Cows judged to be clinically sound presented with no visual postural or locomotion abnormalities (locomotion score ⩽2·0) across limbs (Table 4). Sound limbs showed no pain from the claws or interdigital integument (P i ⩽ 1·0). Lame cows exhibited obvious locomotion and postural limb abnormalities associated with pain restricted to the lateral claw and/or interdigital integument. Even though a variety of lesions were noted across lame and sound limbs (Table 5) lesion severity scores were greater in lame limbs (P ⩽ 0·05). Note that consideration of lesion severity and pain did not render the overall locomotion score different from the visual locomotion score (Table 4).
Pain indices and locomotion sores in sound and lame limbs

Note, a normalised pain threshold of unity, 1, indicates no pain, data presented as mean ± standard error of the mean for the 83 cows in the dataset. Data with different superscripts within rows differ (P ⩽ 0·05)
Descriptive statistics of lesion diagnoses and scores among the 83 commercial dairy cattle employed in lameness modelling

Data presented as mean ± standard error of the mean. Overall lesion severity score in lame cows was greater than that of sound cows (P ⩽ 0·05)
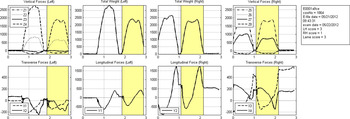
For every log file the force-time series outputs for each transducer were plotted (Fig. 2). Hind limb steps were identified, time indices recorded and LMVs calculated for the pelvic limbs. Outputs showed initial loadbearing on the hind leg correlated with increased magnitude of forces in the vertical (z), braking (y) and medial (x) directions while unloading of the hind leg correlated with increased magnitude of acceleratory (y) and decreased magnitude of vertical (z) and medial forces (x).
Representative bilateral pelvic limb output of 14 transducers across 3 dimensions from a sound cow (yellow). Data were calibrated, zeroed in the software and reported as Newtons (vertical axis) and seconds (horizontal axis). Positive values in the vertical direction represent loadbearing, positive values in the transverse direction indicate lateral load bearing while negative forces indicate medial load bearing. Positive forces in the longitudinal direction indicate acceleration while negative forces indicate braking.

Model performance
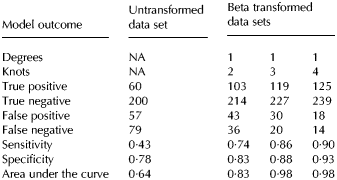
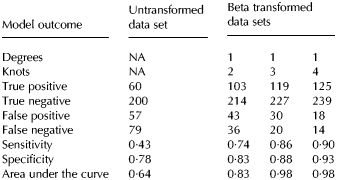
Model accuracy improved with B-spline transformations of all 76 LMVs at 1-degree with 2-, 3-, or 4-knot transformations in accord with Liu et al. (Reference Liu, Neerchal, Tasch, Dyer and Rajkondawar2009). Optimal model performance (90% sensitivity, 93% specificity, and 98% AUC) occurred with transforms of 1 degree and 4 knots (Table 6).
Model performance using untransformed and transformed variables with LOCO cross validation
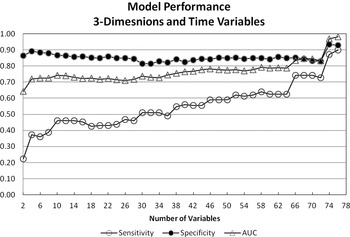
We sought to identify the LMVs necessary to generate the greatest amount of model sensitivity and specificity. SAS ranked each LMV in order of its stand-alone (a one-variable model) ability to correctly predict lameness. The ranked list of LMVs was used to construct a model in a stepwise fashion starting with the best predictor followed by iterations of the model as LMVs were progressively incorporated from those with the greatest to those with the least bearing on model prediction. Best performance was achieved with input from all 76 variables consisting of 32 vertical, 14 longitudinal, 28 transverse, and 2 stance time variables (Fig. 3).
Sensitivity, specificity, and area under the curve (AUC) as functions of the number of variables available for modelling. Best performance is realised with 76 variables resulting in 90% sensitivity, 93% specificity, 98% AUC. Model built using LOCO cross-validation with a 1-degree, 4-knot LMV transformation.

Assessment of the effect of one or more dimensions on model performance (Table 7) showed incorporation of all three dimensions created a model with the highest sensitivity, specificity, and AUC. Input from any single or pair of directions produced models with lower amounts of sensitivity, specificity and AUC.
Model performance and fit by x, y and/or z dimension with 1-degree, 4-knot spline transformed data and ordered by increasing AUC

Discussion
The 3 dimensional system was developed to address short comings inherent in the 1 dimensional, vertically restricted system. The 1 dimensional design was based on assumptions (Rajkondawar et al. Reference Rajkondawar, Lefcourt, Neerchal, Dyer, Varner, Erez and Tasch2002) and experimental evidence (Neveux et al. Reference Neveux, Weary, Rushen, Von Keyserlingk and De Passillé2006) that unilateral pain always shifted vertical load bearing to contralateral sound limbs. Critical evaluation of this assumption however, proved vertically restricted systems were insensitive predictors of lameness (Liu et al. Reference Liu, Dyer, Neerchal, Tasch and Rajkondawar2011) because load shifts in lameness were not inevitably visible to the 1 dimensional system. In Liu et al. Reference Liu, Dyer, Neerchal, Tasch and Rajkondawar2011) we showed two subpopulations (TP and FN) defined by the 1 dimensional system were in fact clinically lame animals that displayed indistinguishable levels of lesion severity scores, visual locomotion scores and objective levels of pain in the lateral claws. The key finding was the medial claws in both subpopulations were sound as judged by the absence of lesions and pain. The most feasible explanation for the FN declaration by the 1 dimensional system was that 48% of the cows in that report simply accommodated pain in the lateral claw by shifting load bearing to the medial claw on the same limb. The remaining 52% of the cows declared TP by the 1 dimensional system in that study accommodated their pain in the lateral claw by load shifting to the contralateral sound limb. Unlike experimental approaches triggering discomfort across both claws in a limb (Neveux et al. Reference Neveux, Weary, Rushen, Von Keyserlingk and De Passillé2006), most cows with lesion driven lameness develop lesions and pain in the lateral as opposed to the medial or both claws of a limb (Clarkson et al. Reference Clarkson, Downham, Faull, Hughes, Manson, Merrit, Murray, Russel, Sutherst and Ward1996, Dyer et al. Reference Dyer, Neerchal, Tasch, Wu, Dyer and Rajkondawar2007). Therefore, cows with discomfort associated with naturally occurring lesions have the option to load transfer to either the contralateral sound limb or to the medial claw on the painful limb. The findings raised questions about the assumption of shifts in weight bearing to contralateral sound limbs as well as the feasibility of any stand-alone, vertically restricted system (Pastell & Kujala, Reference Pastell and Kujala2007; Rushen et al. Reference Rushen, Pompourcq and de Passille2007; Chapinal et al. Reference Chapinal, Rushen, de Passille and Wagner2010) to diagnose lameness with high sensitivity.
We hypothesised lateral rotation and abduction of lame limbs described by Chapinal et al. (Reference Chapinal, De Passille, Weary, Von Keyserlingk and Rushen2009) caused load shifts across digits within the painful limb that triggered changes in the transverse (x) and longitudinal forces (y) with or without affecting the vertical (z) forces (Scott, Reference Scott1988; Walker et al. Reference Walker, Pfau, Channon and Wilson2010; Liu et al. Reference Liu, Dyer, Neerchal, Tasch and Rajkondawar2011; Dunthorn et al. Reference Dunthorn, Dyer, Neerchal and Tasch2012). We upgraded our 1 dimensional system to a 3 dimensional system that enabled assembly of a more robust algorithm for predicting the probability of lameness. As before (Liu et al. Reference Liu, Neerchal, Tasch, Dyer and Rajkondawar2009), we determined a 1-degree, 4-knot B-spline transformation of the LMV data greatly improved model accuracy for the predicted probability of lameness. Use of LOCO cross validations showed the 3 dimension system achieved a remarkably high 90% sensitivity, 93% specificity, and 98% AUC. The hypothesis was supported by the pivotal observation that combination(s) of any 1 or 2 dimensions failed to accurately detect load shifting associated with unilateral limb pain; while all 3 dimensions were both necessary and sufficient to accurately predict lameness. Interestingly, supplementing the vertical inputs with either the transverse or the longitudinal inputs alone improved but did not fully correct sensitivity issues associated with the vertical dimension. Altogether, the outcomes suggested limb adduction and rotation changed transverse and longitudinal forces that became pivotal elements in lameness predictability. The magnitude and direction of these changes is beyond the scope of this manuscript and will become the subject of future work. Note that the clinical findings associated with the lame limbs mirrored our earlier reports wherein the lesions, lesion severity and amount of pain centred on the lateral claws. The medial claws in this small sample of cows lacked painful lesions. Thus, the improvement in model sensitivity could not be attributed to differences in presentation of the clinical lameness. We propose upgrade of the 3 dimensional system enabled the force plates to accurately assess lameness even in animals that load shifted across claws within the same limb. Our findings are also completely in accord with a few earlier reports that indicated lameness changed LMVs across other dimensions (Scott, Reference Scott1989; Clayton et al. Reference Clayton, Schamhardt, Willemen, Lanovaz and Colborne2000; Ishihara et al. Reference Ishihara, Reed, Rajala-Schultz, Robertson and Bertone2009) than the vertical direction. Scott (Reference Scott1989) noted cows with profound unilateral lameness did not inevitably reduce maximum vertical forces in that limb nor increase maximal vertical force in the contralateral sound limb. Instead, load transfer reduced the maximum propulsive force in the lame limb while coincidently decreasing the braking force in the contralateral sound limb. Our preliminary results support Scott (Reference Scott1989) observation and argue 3 dimensional systems will serve the practical issues of accurate and reproducible lameness detection in the commercial industry. Practically speaking the 3 dimensional system is most easily incorporated into production systems where cows travel single file in an exit ramp from the parlour or free stall barn.
We can only speculate why input from 3 dimensions was required to correct the insensitivity inherent in our 1 dimensional system when others reported vertically restricted force plates detected lameness with moderate sensitivity (Neveux et al. Reference Neveux, Weary, Rushen, Von Keyserlingk and De Passillé2006; Pastell & Kujala, Reference Pastell and Kujala2007; Rushen et al. Reference Rushen, Pompourcq and de Passille2007; Chapinal et al. Reference Chapinal, Rushen, de Passille and Wagner2010; Pastell et al. Reference Pastell, Hänninen, De Passillé and Rushen2010). Duration of stance time was a fundamental difference between the two designs. Measurements in our system only occurred from animals in transit over the plates. All other systems required cows to remain static on the plates. Duration of stance times for cows in transit were 0·5–1 s (Liu et al. Reference Liu, Dyer, Neerchal, Tasch and Rajkondawar2011) while standing cows generated stance times as long as 5 min (Neveux et al. Reference Neveux, Weary, Rushen, Von Keyserlingk and De Passillé2006). Moreover, Neveux et al. (Reference Neveux, Weary, Rushen, Von Keyserlingk and De Passillé2006) concluded cows load shifted across pelvic limbs when made uncomfortable across both claws of one limb. We know natural lameness arises primarily from pain emanating from lateral claws and offers opportunity for load transfer from painful lateral to sound medial claws within limbs. Prolonged stance times (5 min) in cows unilaterally uncomfortable on both claws of a limb enabled transfer of weight bearing across limbs. Transient stance times in moving animals likely provide only enough time to allow loading within limbs across claws or across limbs but not both. The former type of transfer would not persist over prolonged stance times in other systems but would occur and be missed during the brief stance time in our 1D system. Whether or not acceptable sensitivity and specificity in the 1 dimensional systems can be achieved without the supplemental equipment requirements implied by data in Chapinal et al. (Reference Chapinal, Rushen, de Passille and Wagner2010) will determine how widely these systems will be adopted by the industry.
In conclusion, the data supported the hypothesis that force measurements in 3 dimensions are necessary to improve sensitivity and specificity of models that predict lameness. These improvements were likely caused by the 3 dimension system's ability to detect load shifts within limbs in the transverse and longitudinal directions that the 1 dimensional system was unable to identify. The hypothesis was accepted with the understanding the data are preliminary. We plan to validate the model using a larger population of cows.
The authors acknowledge the support of Tom England and Caitlin Stoltz of Frey Dairy, Inc., PA. Supported by USDA-SBIR grant 2011-33610-30434.