1 Introduction
1.1 Measures of rhythm
Recent advances in the study of rhythm have seen researchers move away from traditional ideas of isochrony and begin to use metrics based on the duration of vocalic and consonantal intervals. There are three major proposals in the literature which characterise language rhythm using metrics. Ramus, Nespor & Mehler (Reference Ramus, Nespor and Mehler1999) suggested three measures of rhythm: the standard deviation of vowel duration (ΔV), the standard deviation of consonant duration (ΔC), and the proportion of vowels in an utterance (%V). Dellwo (Reference Dellwo2004) presented VarcoC and VarcoV, which are similar to ΔC and ΔV, but the standard deviation is divided by the mean duration, in an effort to control for speech rate. The Pairwise Variability Index (PVI), popularised by Low, Grabe & Nolan (Reference Low, Grabe and Nolan2000), aims to capture the ‘sequential nature of rhythmic contrasts’ (White & Mattys Reference White and Mattys2007a: 503). Essentially, the PVI compares the duration of successive vocalic and intervocalic durations within a stretch of speech and produces two figures, the nPVI-V for vocalic intervals and the rPVI-C for consonantal or intervocalic stretches.
The foundation of all rhythm metrics lies in the observation that there are phonological differences between languages impressionistically defined as ‘stress-timed’ and ‘syllable-timed’. Because ‘stress-timed’ languages exhibit vowel reduction there will more variation in vowel durations (Roach Reference Roach and Crystal1982) than in ‘syllable-timed’ languages. In addition, because ‘stress-timed’ languages permit several different syllable types, including those with complex onsets and codas, there will also be more variation between consonantal stretches than in ‘syllable-timed’ languages (Dauer Reference Dauer1983). In short, phonological differences between languages are seen as leading to the differences in rhythm that are captured by rhythm metrics.
1.2 Validity and reliability
Two fundamental properties of empirical measurement are validity and reliability (e.g. Carmines & Zeller Reference Carmines and Zeller1979). This division was first used as a way to partition objectivity in the field of psychometrics (Kirk & Miller Reference Kirk and Miller1986: 19), and although there may be different types of validity and reliability depending on what is being measured (Winter Reference Winter2000; Cohen, Manion & Morrison Reference Cohen, Manion and Morrison2007: 133), both terms can be applied to most types of quantitative and qualitative research. A valid measure is one that measures what researchers intend to measure, whilst one that is reliable will give similar results in a similar context (Cohen et al. Reference Cohen, Manion and Morrison2007: 146). It is particularly important for validity and reliability to be established when a new measure is developed, so that results obtained by that measure can be considered robust and meaningful.
1.2.1 Validity of rhythm metrics
Much of the early work using metrics was, in effect, a test of their validity, in particular their construct validity, which is the degree to which the measure corresponds to observations (Crohnbach & Meele Reference Crohnbach and Meele1955) and ‘represents accurately those features of the phenomena, that it is intended to describe’ (Hammersley Reference Hammersley1987: 69). Although the work is not usually described in terms of validity, many of the papers in the field have aimed to establish if metrics support phoneticians’ impressions of the rhythm of languages and varieties, particularly the distinction between ‘stress-timed’ and ‘syllable-timed’ languages.
Initially the PVI measures, and ΔV, ΔC and %V, were used to compare and classify the rhythm of different languages in order to establish if they were able to separate languages into impressionistically defined rhythm classes. Ramus et al. (Reference Ramus, Nespor and Mehler1999) compared these measures in eight languages and demonstrated that ΔC and %V were indeed able to distinguish the languages belonging to the two traditionally defined rhythm classes. Likewise, Grabe & Low (Reference Grabe, Low, Gussenhoven and Warner2002) calculated PVI values for eleven languages (albeit based on only one speaker per language) and demonstrated that nPVI-V gave significantly different results when applied to those languages classically described as ‘stress-timed’ or ‘syllable-timed’. For example, languages like English and Dutch (‘stress-timed’) were found to have significantly higher values than languages like Spanish or French (‘syllable-timed’). Since then White & Mattys (Reference White and Mattys2007a) compared all the metrics and found that %V, nPVI-V and VarcoV were best suited to discriminating between the hypothesised classes (although large differences were also found within classes), suggesting that these measures have the greatest validity as they best reflect phoneticians’ auditory judgements.
Such demonstrations of the validity of metrics for distinguishing between languages of different classes have led to further investigations. These include: a comparison of the rhythm of different varieties within a language (Low et al. Reference Low, Grabe and Nolan2000, Spencelayh Reference Spencelayh2001, Ferragne & Pellegrino Reference Ferragne and Pellegrino2004, White & Mattys Reference White, Mattys, Pilar, Mascaró and Solé2007b), an examination of the rhythm of children acquiring two languages (Whitworth Reference Whitworth and Nelson2002) and of the influence of bilinguals’ languages on each other (White & Mattys Reference White and Mattys2007a), and a comparison of the rhythm used by people with clinical diagnoses to that of non-impaired controls (e.g. Henrich et al. Reference Henrich, Lowit, Schalling and Mennen2006, Knight & Cocks Reference Knight and Cocks2007, Liss et al. Reference Liss, White, Mattys, Lansford, Lotto, Spitzer and Caviness2009). These studies can also be seen as tests of validity as they investigate whether the metrics can distinguish between samples of speech where rhythm is perceived to differ, although they move away from capturing rhythmic distinctions between languages.
However, there is sometimes a degree of circularity apparent in studies on rhythm metrics. As explained above, studies showing that metrics divide samples of speech into predetermined categories are seen as good evidence for the validity of metrics. Often, however, the results of these studies are also seen as giving information about the rhythm of the samples under study. It seems important to establish the validity and reliability of metrics first, before metrics are used to make claims about rhythm which are not based on observation.
1.2.2 Reliability of metrics
Although several of the studies mentioned above have demonstrated the validity of rhythm metrics, it is only recently that any have explicitly aimed to test their reliability, i.e. the degree to which the metrics give similar results under similar conditions. The earliest attempts to assess reliability, although they are not framed using this term, compared the metrics to see which performed best across speech rates (although here the dividing line between reliability and validity is not clear-cut as many of these studies also aim to identify which of the measures best divide languages into different classes, which is a test of validity). Grabe & Low (Reference Grabe, Low, Gussenhoven and Warner2002) found PVI measures to be more reliable across speech rates than the measures of Ramus et al. (Reference Ramus, Nespor and Mehler1999). Dellwo & Wagner (Reference Dellwo and Wagner2003: 471) found that whilst ΔC was ‘extremely speech rate dependent[,] %V remained rather stable across different speech rates’ – findings which led to the development of the Varco measures. In addition, White & Mattys (Reference White and Mattys2007a) found rPVI-C, ΔC and ΔV to be strongly influenced by speech rate, and therefore to be less reliable than other measures when speech rate varies, as it is likely to do in natural speaking conditions.
Wiget et al. (Reference Wiget, White, Schuppler, Grenon, Rauch and Mattys2010) investigated reliability related to speakers, measurers and the composition of test materials. They found considerable inter-speaker variation, but the rhythm scores arrived at by different measurers did not affect the ability of vowel-based metrics to divide samples into language varieties. The consonantal metrics were less reliable between measurers, however. The authors also found that different sentences produced corresponding differences in all metrics, indicating that there may be a reliability problem if different materials are used across studies, and that comparing the results of individual studies may be problematic.
An area that has not yet been addressed is the temporal stability, or test–retest reliability, of rhythm metrics. Whilst this might initially seem a trivial point, there is an underlying assumption in much work concerning rhythm that, because the metrics are designed to capture the rhythm of a particular language, metrics calculated on speech produced at different times will be similar, if that speech is from the same speaker saying the same materials in the same task. This is one of many assumptions in studies that use a single recording of a speaker to illustrate the rhythm of a language or a language variety, and also an assumption of multiple-speaker studies if participants are only tested at a single time point.
2 Aim
The aim of the current project is to investigate the temporal stability, or test–retest reliability, of rhythm metrics. As metrics are designed to capture differences in rhythm between languages (rather than our perception of the ‘musical’ rhythm of speech, for example) we would predict that the metrics will all have good test–retest reliability in a stable task where speakers produce the same material on successive occasions.
3 Method
3.1 Procedure
On three consecutive days, four speakers of Southern British English (three male, one female, aged 21–43 years) read the passage ‘The North Wind and the Sun’ (see e.g. Ladefoged Reference Ladefoged1999). For three subjects the recordings were made in a sound-treated booth, whilst for one subject they took place in a quiet room in the speaker's own home. All recordings were made with a high-quality directional microphone and a Marantz solid state recorder.
Efforts were made to minimise, as far as possible, any factors that might cause differences in productions between sessions. Thus, recordings were made at the same time of day, and identical instructions were given each time, even when the speaker had completed the same task on previous days. Before each recording session speakers familiarised themselves with the material by reading the passage through once, aloud, while recording levels and equipment set-up were checked by the researcher. The purpose of familiarisation was to ensure that any changes in the rhythm metrics over time could not be ascribed to a speaker's productions changing as the material became more familiar.
3.2 Analysis
Firstly, an informal auditory analysis was undertaken by the author and two other trained phoneticians. Whilst the metrics aim to capture language specific rhythm, it is possible to produce speech in different ways, which could affect the resulting metrics. For example, a more ‘syllable-timed’ rhythm could be produced by limiting vowel reduction, which would alter the metrics by equalising vowel durations across syllables. The resulting rhythm would likely sound somewhat unnatural, or marked, so the purpose of the preliminary auditory analysis was simply to assess if participants were using a typical English rhythm across sessions. The recordings from each speaker were played in a random order and listeners were asked whether a typical English rhythm was used in each one and if that rhythm was consistent across sessions. All listeners agreed that, whilst some speakers’ speech rate appeared to change slightly across sessions, they produced a natural English rhythm which was impressionistically equivalent in rhythm each time. Without this step, any differences in the metrics across time might be reflective of changing rhythm, related to text and task familiarity, or paralinguistic variables.
Acoustic analysis was undertaken in PRAAT. The durations of successive vowel and consonant intervals were measured according to standard procedures (e.g. Peterson & Lehiste Reference Peterson and Lehiste1960). As noted by Deterding (Reference Deterding2006), the NWS passage contains several instances of sonorant–vowel sequences. These were segmented by attention to the formant structure and amplitude of the waveform, supported by auditory analysis. A reliability check was conducted by remeasuring durations from the middle ten seconds of each recording two weeks after initial measuring. When compared with the original segmentations, no boundary differed by more than 5 ms, and the entire first set was used for analysis.
In order to use inferential statistics, all metrics were calculated over four sections of the text. The first three sections corresponded to the first three sentences, whilst the fourth comprised the final two sentences. The passage was divided in this way so that all data were included, so that sections corresponded to syntactic and prosodic boundaries, and so that the sections contained similar numbers of vowel and consonant intervals. Nevertheless, productions on different days, and by different subjects contained slightly different numbers of intervals depending on factors such as variable elision.
Seven rhythm metrics were computed. PVI values were calculated according to the PVI formula given in the appendix. A full description of the procedure for computing the PVI can be found in Low et al. (Reference Low, Grabe and Nolan2000). As has become standard in the literature, the vocalic intervals were normalised for speech rate (nPVI-V), whilst the intervocalic intervals were not (rPVI-C). The measures ΔV and ΔC were computed by calculating the standard deviation of vowel and consonant intervals respectively. The measure %V was calculated by dividing the total duration of vocalic intervals by the total duration of vocalic and intervocalic intervals (and multiplying by 100). Finally, VarcoV is the standard deviation of vocalic intervals divided by the mean of vocalic intervals (and multiplied by 100), whilst VarcoC is the standard deviation of intervocalic intervals divided by the mean of intervocalic intervals (and multiplied by 100).
Statistical analysis took two forms. Firstly, a repeated measures MANOVA was carried out for each metric. Each of the MANOVAs had independent variables of time (day 1, 2 and 3) and section (1–4). Intraclass correlations (treating speakers and items as random factors) were also conducted for each measure by comparing results between each pair of days, as recommended (e.g. Streiner & Norman Reference Streiner and Norman1995) for test–retest reliability studies.
4 Results
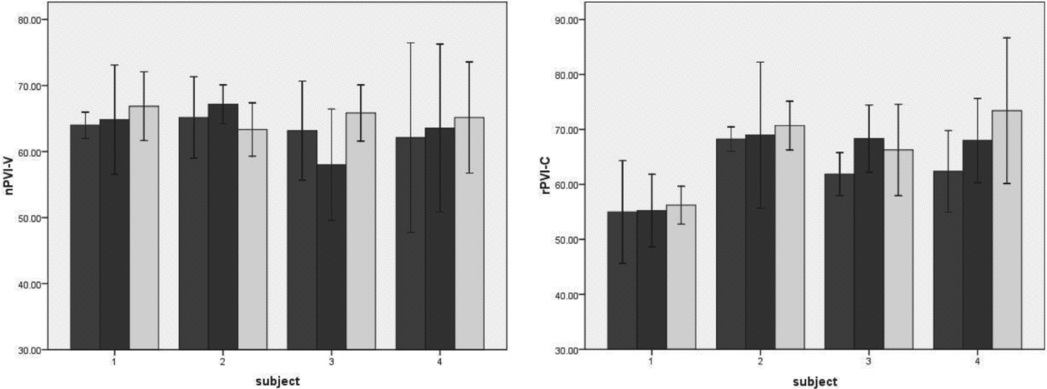
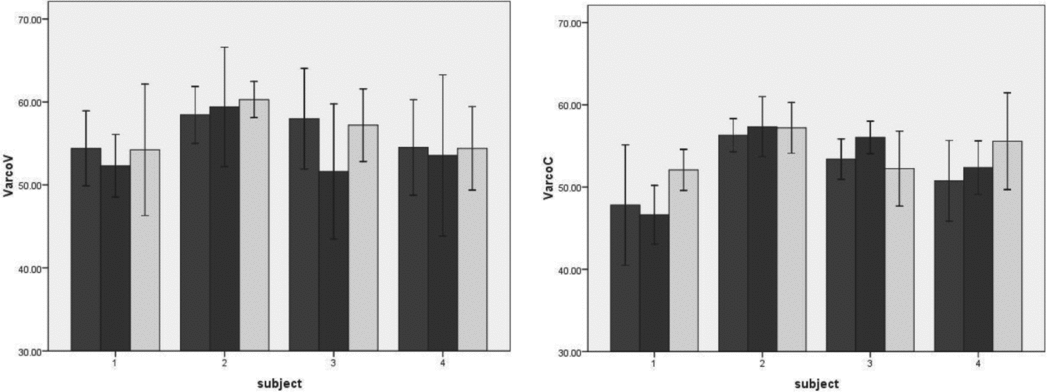
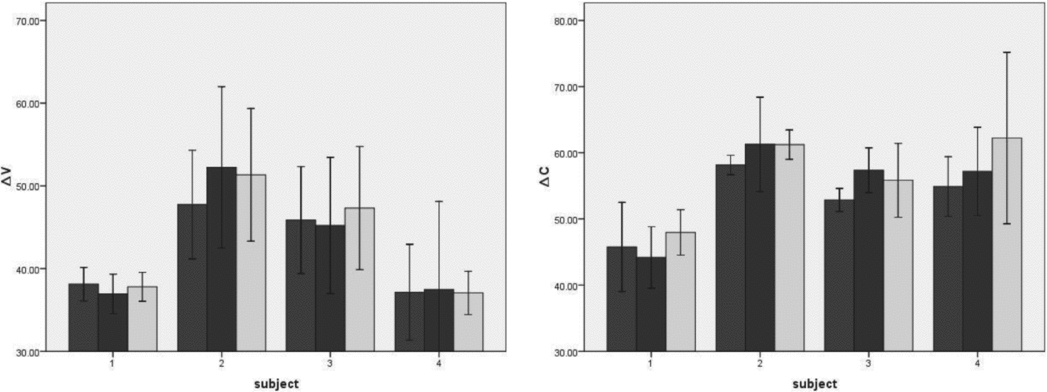
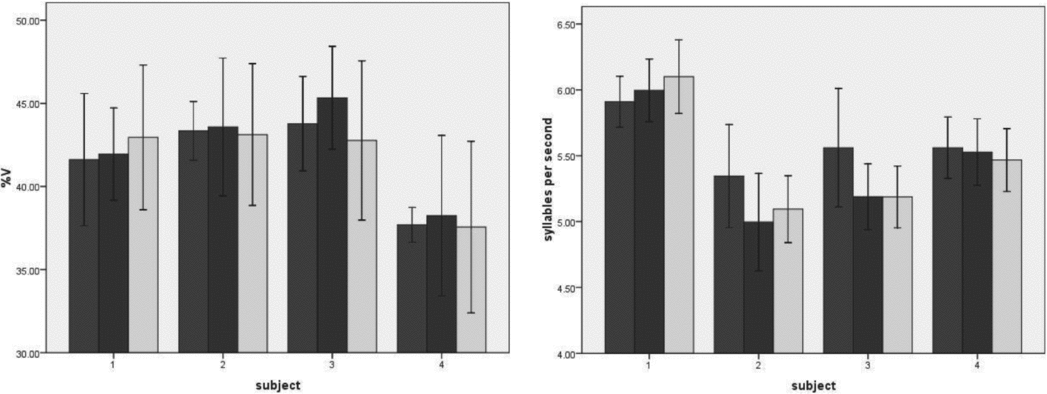
Results for all metrics are shown in Figures 1–4. Results of the MANOVAs indicate that there is no statistically significant difference across time for any metric, as shown below.


VarcoV (left) and VarcoC (right) results for each speaker across time.

ΔV (left) and ΔC (right) results for each speaker across time.

%V results (left) and articulation rate (right) for each speaker across time.

There is a significant difference between the sections for all measures except VarcoC. Numbers in brackets at the end of rows ΔC and %V refer to sections, and indicate any significant differences found using pairwise comparisons (with a Bonferroni correction for multiple comparisons). So, for example, for ΔC section 2 had a significantly lower score than section 3.
Differences are to be expected, as the sections contain different material (see e.g. Hirst Reference Hirst2009, Wiget et al. Reference Wiget, White, Schuppler, Grenon, Rauch and Mattys2010). For example, section 2 contains around half as many examples of consonant clusters as section 3. There were no interactions between time and section for any measure.
Intraclass correlations indicate that all measures correlate significantly (p < .01) across time. However, the correlation coefficients show that some measures are more highly correlated than others. As is typical when using intraclass correlations, coefficients of .40–.59 were regarded as indicating moderate stability, values of .60–.79 as indicating substantial stability, and values of .80 and over as indicating outstanding stability. The coefficient for each metric is shown below (N = 16 in each case), and the results are ordered from strongest to weakest.
Results are also informed by measures of articulation rate (shown in the right panel of Figure 4), which was calculated for each section on each day. Each speaker had an average articulation rate of between 5 and 6.2 syllables per second suggesting that they were using a medium rate of speech: Laver (Reference Laver1994: 158) indicates that an average of 5.3 syllables per second is a medium rate in English. No significant difference in articulation rate was found across time (F(2,6) = 1.58, p > .10), although there was a difference by section (F(3,9) = 11.22, p < .01). Section 3 had a significantly slower rate than section 2, presumably due to the number of consonant clusters it contains, as explained above. Intraclass correlations for articulation rate across time were significant, with the coefficient value .78.
5 Discussion
This study tested the assumption that rhythm metrics are temporally stable and reliable, and therefore able to capture language-specific rhythm at different times if the speakers and task are the same. Recordings of ‘The North Wind and the Sun’ passage, spoken by the same four speakers on three separate occasions, and judged by phoneticians to be representative of natural English rhythm and equivalent across time, were analysed using rhythm metrics. Although there was no significant difference across time for any metric, the results of intraclass correlations indicate that some measures correlate more highly across time than others, and are therefore more suitable for classifying and describing rhythm.
In general, vowel-based metrics are more stable than their consonantal equivalents, as indicated by the stronger correlation coefficients. In every case, the consonantal version of a particular metric performed less well than the vocalic version, and rPVI-C and VarcoC performed the least well of all metrics, with only moderately high correlations evident.
The higher stability of the vowel-based metrics is possibly due, in part, to optional connected speech processes, such as elision and liaison, which generally affect consonants more than vowels. If consonants are deleted or added by speakers on some occasions and not others, this may affect the durations of consonantal intervals, which will in turn affect metrics based on these durations. However, although there are some examples of variable elision and liaison in the speech samples analysed here, the number of opportunities for connected speech processes in the NWS passage does not seem sufficient to account for the inferior performance of the consonantal metrics. This relative stability of the vowel metrics may seem surprising given the tendency of vowels to vary more in duration than consonants (see e.g. Klatt Reference Klatt1976). However, these results suggest that variation in duration is relatively stable across time, at least when the task is so tightly constrained (vowel duration itself will of course depend on many factors, especially in conversational speech, see e.g. Bell et al. Reference Bell, Jurafsky, Foster-Lussler, Girand, Gregory and Gildea2003).
It is also noticeable that the metrics normalised for speech rate, such as VarcoV and VarcoC, are less highly correlated across time than their non-normalised counterparts, ΔV and ΔC. The Varco measures are calculated by dividing ΔV and ΔC by the mean duration (a coefficient of variation), a step originally taken in order to account for variable speech rate. As rate varies so little across these samples, and thus the task is opposite to that for which the Varco measures were designed, it seems that the non-normalised measures (ΔV and ΔC) do better simply because they are based on one parameter rather than two (Laurence White, personal communication).
Some of the metrics are prone to large differences across time, at least for some subjects. For example, rPVI-C ranges from 61 to 71 and ΔC ranges from 54 to 62 for speaker 4. Thus, using these metrics, the differences within a single speaker can be as large as those between languages (see e.g. the metrics reported by Ramus et al. Reference Ramus, Nespor and Mehler1999, Grabe & Low Reference Grabe, Low, Gussenhoven and Warner2002 and White & Mattys Reference White and Mattys2007a). The measures %V and ΔV are more temporally stable, however, and correlate highly over time. These same measures also appear to be reliable across measures and tasks. Wiget et al. (Reference Wiget, White, Schuppler, Grenon, Rauch and Mattys2010) indicate that there are higher correlations for inter-measurer reliability for the vowel measures, whilst Henrich et al. (Reference Henrich, Lowit, Schalling and Mennen2006) indicate that %V varies least across tasks.
If they are to be useful, rhythm metrics must be reliable and valid (able to capture linguists’ perceptions of language rhythm). White & Mattys (Reference White and Mattys2007a) indicated that VarcoV, nPVI-V and %V are the most able to distinguish rhythm classes (although these measures also revealed large differences within classes), and to demonstrate the influence of the rhythm of person's first language on the rhythm of their second language. Ramus et al. (Reference Ramus, Nespor and Mehler1999) indicated that ΔC and %V distinguish between languages in different classes, and Grabe & Low (Reference Grabe, Low, Gussenhoven and Warner2002) found a similar result for nPVI-V. Taken together with the results in the current paper, which indicate that ΔV and %V are also the most temporally stable measures of within-speaker rhythm, these findings would suggest that vowel measures in general, and %V in particular, are most suited to meeting the conditions of reliability and validity, which are essential qualities for any empirical measure.
These observations should be taken in to account when planning further research using rhythm metrics. First, in future studies, it will be advisable to take recordings of several repetitions from speakers and average the metrics across them, as the precise figure for some of these metrics can vary substantially across repetitions. Secondly, as there can be wide variation within and between speakers, it will be important to include several speakers if they are to be considered representative of any particular linguistic population. Thirdly, it makes sense to use only those metrics that are the most stable, reliable and valid, such as %V.
A final, more general point of interest concerns what, if anything, rhythm metrics reveal about our perception of rhythm. Ramus et al. (Reference Ramus, Nespor and Mehler1999: 286) argue that ‘subjects can compute the vowel/consonant temporal ratio %V and that their categorization of sentences and languages is based on %V’. The notion that the relative balance of vowels and consonants is used by human listeners is supported by findings that infants pay most attention to vowels (Bertoncini et al. Reference Bertoncini, Bijeljac-Babic, Jusczyk, Kennedy and Mehler1988) and are successful at classifying languages according to their rhythm. As %V consistently appears to be valid and reliable, this may suggest that our perceptions of language rhythm are based on a similar kind of perceptual calculation.
Whilst the rhythm metrics may reflect our preconceived notions of rhythm classes, it is likely that perceptual rhythm is affected by more than just the phonological properties of languages. However, White & Mattys (Reference White and Mattys2007a: 520) note that we do not, as yet, fully understand the relationship between our perceptions and rhythm metrics. It seems likely that metrics simply capture the timing cues that listeners use to differentiate languages, whilst various other factors influence how humans perceive speech rhythm. For example, prosodic timing processes such as phrase-final lengthening (e.g. White & Mattys Reference White and Mattys2007a, Prieto et al. Reference Prieto, Vanrell, Astruc, Payne and Post2010), levels above and below the syllable (e.g. Allen & Hawkins Reference Allen, Hawkins, Yeni-Komshian, Kavanagh and Ferguson1980: 232), and utterance-specific coupling of nested levels of prosody (e.g. Cummins & Port Reference Cummins and Port1998; Cummins Reference Cummins2002, Reference Cummins2003) must also be taken into account for a full understanding of how we perceive speech rhythm. Thus, whilst %V is a reliable and valid metric reflecting preconceived notions of rhythm class, we will need to investigate how other factors contribute to our perception of rhythm, beyond this categorization of the rhythmic differences between languages.
6 Conclusion
From the results of the current study, and other recent work, it seems that vowel-based metrics are more valid and reliable than those based on the duration of consonants. In particular, %V can discriminate between languages and varieties, but is relatively unaffected by differences between speakers and measurers, and remains relatively constant across time, as demonstrated in this paper. It is also likely that the durations of vowels contribute largely to our subjective impressions of the rhythmic differences between languages. However, it is clear that more work must be done to establish how other factors influence our perception of rhythm, beyond those properties which can simply divide languages into predefined rhythmic classes.
Acknowledgements
I would like to thank Laurence White and an anonymous reviewer for detailed and helpful comments on earlier drafts of this paper. I would also like to thank Volker Dellwo and other participants at the Experimental Approaches to Speech Rhythm workshop at UCL, London, in 2008, for their useful suggestions.
Appendix. Equations for calculating PVI values

m is the number of intervals and d is the duration of the kth interval.