Introduction
According to Fishers theory of sex ratio evolution, natural selection is expected to maintain a stable 1:1 sex ratio in randomly mating populations, as this maximises reproductive success (Carvalho et al Reference Carvalho, Sampaio, Varandas and Klaczko1998; Fisher Reference Fisher1930; Uller et al Reference Uller, Pen, Wapstra, Beukeboom and Komdeur2007). This classical model constitutes a cornerstone for understanding adaptive evolution (Hao and Lei Reference Hao and Lei2022). In nematodes, sex is often determined chromosomally, and in many lineages this follows an XX/XO system in which X-chromosome dosage determines sex, with XX individuals developing as females and XO individuals as males; however, sex chromosome organisation and sex-determining mechanisms have diversified substantially across the phylum. This chromosomal framework has been documented in several parasitic nematodes, including Strongyloides ratti (Harvey and Viney Reference Harvey and Viney2001). Importantly, however, observed sex ratios in parasitic helminths do not always conform to Fisherian expectations. Female-biased or otherwise non-Fisherian sex ratios have been reported across diverse nematode taxa, including both parasitic and free-living nematodes. Examples include parasitic genera such as Strongyloides, Rhabdias, and Meloidogyne (D’Ávila et al Reference D’Ávila, Bessa, Souza-Lima and Rodrigues2012; Poulin Reference Poulin1997; Van Goor et al Reference Van Goor, Shakes and Haag2021), as well as free-living and trioecious nematodes such as Caenorhabditis and Auanema (Huang et al Reference Huang, Lo, Hsu, Le, Yang, Chang, Braendle and Wang2023; Tandonnet et al Reference Tandonnet, Farrell, Koutsovoulos, Blaxter, Parihar, Sadler, Shakes and Pires-daSilva2018; Van Goor et al Reference Van Goor, Herre, Gómez and Nason2022), indicating that chromosomal sex determination can coexist with lineage-specific ecological, developmental, or environmental modifiers of sex allocation. Against this broader background, Ascaris suum, a globally distributed parasite with a consistently female-biased sex ratio, represents an attractive system for investigating the mechanisms underlying skewed sex ratios. As shown in the life cycle of A. suum (Figure S1), several developmental stages precede adulthood, yet obvious sexual dimorphism is not apparent before maturation. The observed bias in A. suum is therefore unlikely to be explained solely by stochastic processes after sexual maturation, suggesting that genetic or environmental regulators may act earlier in development. Although the sex of adult worms can be readily identified by tail morphology, with females showing a straight posterior end and males a curved, hook-like tail (Figure S2), no effective method is currently available for sex determination during pre-adult developmental stages. As a result, sex identification remains restricted to adults and relies entirely on morphological examination (Crites Reference Crites1962). There is absent an effective sex identified method for early developmental phases.
In the 1990s, the application of flow cytometry for sperm sex identification underwent rapid development (Pozdyshev et al Reference Pozdyshev, Kombarova and Muronetz2023; Welch and Johnson Reference Welch and Johnson1999). Initially, this technology was primarily used in controlled sex production in cattle, where the separation of X- and Y-chromosome-bearing sperm followed by artificial insemination allowed the production of calves of predetermined sex (Hamano Reference Hamano2007). This approach is based on the principle that, in most mammals, X-chromosome-bearing sperm contain on average 3–7% more DNA than Y-chromosome-bearing sperm, allowing their separation based on DNA content differences (Garner Reference Garner2006). In the parasite A. suum, researchers in the 1990s used DAPI (4′,6-diamidino-2-phenylindole) staining combined with fluorescence spectrophotometry and found that the difference in DNA content between male and female fertilised eggs was approximately 14% (Azzaria and McGhee Reference Azzaria and McGhee1992). This difference also reflects the difference in DNA content between X-bearing and O-bearing sperm in XO males, indicating that flow cytometry is theoretically suitable for determining the X/O sperm ratio in A. suum. In principle, flow cytometry can distinguish A. suum sperm by sex chromosome; however, it cannot be applied to embryonic or larval stages, necessitating the development of a molecular sexing method. Single-copy, sex-linked loci exhibit exploitable dosage or sequence differences between the sexes (Gu and Walters Reference Gu and Walters2017). Inspired by dosage-based mechanisms in Drosophila (e.g., msl-2) (Gelbart and Kuroda Reference Gelbart and Kuroda2009), we try to target such loci and develop a molecular assay for sex identification.
Leveraging a chromosome-level genome assembly of A. suum (CNP0003380), we developed a quantitative PCR (qPCR)-based sex identification assay using two single-copy sequences. One target is located on an autosome (Chr3C, a region on chromosome 3), and the other on the X chromosome (Chr5X, a region on the X chromosome). This approach exploits ploidy differences in the XX/XO system: females (XX) show a 1:1 autosome-to-X signal ratio, whereas males (XO) show a 2:1 ratio (Figure S3). This tool provides a reliable, high-resolution method potentially applicable for sex and sex ratio identification across all developmental stages of A. suum.
Materials and methods
Collection and preparation of adult A. suum specimens
Adult female and male A. suum specimens were freshly collected from a local pig slaughterhouse in Hulunbuir, Inner Mongolia, China, in June 2024, washed with sterile physiological saline, and immediately snap-frozen in liquid nitrogen. Samples were transported to the laboratory on dry ice and stored at −20°C until further processing. For subsequent experiments, a total of 30 adult males and 30 adult females were selected. Approximately 1 cm of the anterior region from each worm was dissected for genomic DNA extraction using the TIANamp Genomic DNA Kit (Cat. No. DP304; TIANGEN Biotech, Beijing, China) according to the manufacturers instructions.
qPCR-based sex identification assay
To develop a fluorescence-based quantitative PCR (qPCR) assay for sex identification in A. suum under its XX/XO sex determination system, a chromosome-level genome assembly of A. suum (CNP0003380; 277 Mb) was used to screen for single-copy DNA sequences. To minimise the influence of repetitive sequences, terminal regions of each chromosome, including telomeric and centromeric segments, were excluded from analysis. The remaining chromosomal regions were partitioned into consecutive, non-overlapping 1 kb windows, which served as candidate regions for primer design. qPCR primers were designed using Primer3 software with default parameters to generate amplicons of 150–300 bp within these selected windows. Candidate amplicon sequences were first validated in silico using BLASTn (NCBI BLAST v2.13.0) against the whole genome assembly with the parameters “-evalue 1e-10 -max_target_seqs 100”. Only amplicons that aligned to a single genomic locus with >95% sequence identity and >95% query coverage were retained as putative single-copy sequences (Supplementary File 1).
To further verify primer specificity and single-copy nature in vitro, conventional PCR was performed prior to qPCR experiments. The PCR reaction system (25 μL total volume) consisted of 12.5 μL 2×TaKaRa Premix Taq (Cat. No. RR003A; Takara Bio Inc., Kusatsu, Japan), 8.5 μL ddH₂O, 1 μL each of forward and reverse primer (10 μmol/μL), and 2 μL template DNA. The PCR reaction procedure was as follows: pre-denaturation at 94°C for 5 min (1 cycle); 30 cycles of denaturation at 94°C for 30 s, annealing at 56°C for 35 s, and extension at 72°C for 1 min; final extension at 72°C for 5 min (1 cycle); and hold at 4°C. PCR products were analysed by 1.5% agarose gel electrophoresis in 1× TAE buffer using a JY300 gel electrophoresis apparatus (Beijing Junyi Oriental Electrophoresis Co., Ltd.) and visualised using an ImageQuant LAS 500 gel imaging system (Beijing Yingmuhe Biotechnology Co., Ltd.) to confirm a single band of the expected size with no non-specific amplification.
Candidate marker sequences from autosomes and sex chromosomes were cloned into the pMD-18T vector (Cat. No. 6011; Takara Bio Inc., Kusatsu, Japan) to generate recombinant plasmids in our laboratory. These recombinant plasmids, each containing the corresponding target sequence, were verified by Sanger sequencing and used as standard plasmid templates for absolute quantification. For the final selected markers, qPCR performance was further evaluated using these standard plasmid templates. Validation criteria included an amplification efficiency of 90–110%, standard curve linearity with an R2 > 0.99, and the presence of a single peak in melting curve analysis to confirm amplification specificity.
Optimisation of qPCR conditions and standard curve construction for final selected single-copy sequences
To optimise qPCR conditions for sex identification, primer concentration and annealing temperature were systematically evaluated for the 3C and 5X assays using a one-variable-at-a-time approach. Primer concentrations ranging from 0.2 to 0.5 μM for each primer and annealing temperatures of 54°C, 56°C, 58°C, 60°C, and 62°C were tested. Based on the optimisation results, qPCR was finally performed in a 20 μL reaction volume containing 10 μL of 2× TB Green Premix Ex Taq (Takara Bio Inc., Kusatsu, Japan), 0.8 μL each of forward and reverse primers (10 μM stock; final concentration 0.4 μM each), 1 μL of template DNA or plasmid standard, and 7.4 μL of nuclease-free water. Amplification was carried out on a SLAN-96P real-time PCR system (Hongshi Medical Technology Co., Ltd., Shanghai, China) using the following program: initial denaturation at 95°C for 30 s, followed by 40 cycles of 95°C for 5 s and 58°C for 30 s, with fluorescence signal acquisition at the annealing step. Melting curve analysis was then performed from 60°C to 90°C to confirm amplification specificity. The performance of each condition was assessed based on the resulting cycle threshold (Ct) values, which were subsequently used to calculate the 3C/5X signal ratio for accurate sex determination.
The copy number of recombinant plasmids was calculated using the following formula: Copy number = [DNA concentration (ng/μL) × Avogadros constant (6.022 × 1023) × 10−9]/(660 × plasmid length (bp)). Recombinant plasmid standards were serially diluted to final concentrations ranging from 10−8 to 10−3 copies/μL. These dilution series were used as templates for qPCR under optimised reaction conditions and cycling parameters. Each standard concentration was analysed in triplicate.
Following amplification, standard curves were generated by plotting Ct values (y-axis) against the base-10 logarithm of the corresponding copy numbers (x-axis) using Microsoft Excel. Standard curves were constructed independently for the 3C and 5X markers to enable absolute quantification. The resulting curves were fitted using linear equations of the form y = kx + b, where y represents the Ct value and x represents the log₁₀-transformed copy number. Absolute copy numbers were calculated by substituting sample Ct values into the corresponding standard curve equations and solving for x (i.e., x = (Ct – b)/k), followed by back-transformation (10^x). The 3C/5X copy number ratio was subsequently determined for sex identification. To ensure robustness, slopes and intercepts used in all calculations were averaged across three independent experiments.
Validation of the qPCR method using adult A. suum DNA
Genomic DNA was extracted individually from each of the 60 adult A. suum worms (30 females and 30 males) and used as a template for qPCR analysis, with all samples analysed in triplicate. Cycle threshold (Ct) values were applied to the corresponding standard curves to calculate the absolute copy numbers of the 3C and 5X sequences. Under the XX/XO sex-determination system of A. suum, the expected 3C/5X copy number ratio is 1 in females (2 copies of both autosomal and X-linked markers) and 2 in males (two autosomal copies and one X-linked copy).
Validation of the qPCR method using A. suum sperm DNA
Sperm samples were obtained from 30 freshly collected, non-frozen male worms. Testicular tissues were isolated from each individual, minced, and vortexed to release sperm, which was subsequently filtered through a 40 μm cell strainer (Cat. No. 352340; Corning Inc., Corning, NY, USA). One aliquot of the sperm suspension was used directly for DNA extraction using the TIANamp Genomic DNA Kit, as described above. Genomic DNA extracted from these 30 sperm samples was used as a template for qPCR. Ct values were obtained and converted to absolute copy numbers using previously established standard curves, where x represents the log₁₀-transformed copy number, and k and b represent the slope and intercept, respectively.
The ratio between autosomal (3C) and sex chromosome (5X) signals was calculated and denoted as n. Based on Mendelian inheritance under the XX/XO sex-determination system, the relative abundance of X-bearing sperm relative to O-bearing sperm (m₁) was derived as follows. Each sperm carries one copy of the autosomal marker (3C), whereas only X-bearing sperm carry the X-linked marker (5X). If the abundance of O-bearing sperm (i.e., sperm lacking the X chromosome) is normalised to 1, and that of X-bearing sperm is denoted as m₁, then the total autosomal signal is (m₁ + 1)a, whereas the total X-linked signal is m₁a, where a represents the signal contributed per chromosome copy.
Therefore,

which simplifies to:

and thus:

Thus, m₁ represents the abundance of X-bearing sperm relative to O-bearing sperm (normalised to 1).
Sperm sample preparation and staining for flow cytometry
The second aliquot of sperm suspension, prepared from the same 30 male worms described above, was fixed overnight in 70% ice-cold ethanol at 4°C. Fixed sperm samples were washed three times with sperm buffer (50 mM HEPES, 70 mM KCl, and 10 mM NaHCO₃; pH adjusted to 7.6 with dilute HCl and filter-sterilised) and finally resuspended in the same sperm buffer. Fixed sperm samples were counted using a hemocytometer (Hausser Scientific, Horsham, PA, USA), and aliquots containing at least 4 × 10⁴ cells were collected by centrifugation at 2,000 rpm for 2 min. Sperm pellets were stained with propidium iodide (PI; Cat. No. P4864; Sigma-Aldrich, St. Louis, MO, USA) at a final concentration of 150 μg/mL, which had been optimised by testing 50, 100, 150, and 200 μg/mL PI, with the highest average fluorescence intensity observed at 150 μg/mL (Table S2). Staining was performed in 500 μL sperm buffer supplemented with 0.5 μg RNase A (Cat. No. R6513; Sigma-Aldrich, St. Louis, MO, USA; final concentration, 1 μg/mL), followed by incubation at 37°C for 30 min in the dark. Samples were subsequently filtered through a 40 μm nylon mesh (Cat. No. NY4004700; Millipore, Burlington, MA, USA) to remove cell aggregates.
Flow cytometric data acquisition and analysis
Flow cytometric analysis was performed using a FACSCelesta flow cytometer (BD Biosciences) equipped with BD FACSDiva v8 software (BD Biosciences, San Jose, CA, USA). Daily quality control was conducted using CS&T beads (Cat. No. 655051; BD Biosciences, San Jose, CA, USA), and instrument performance was confirmed to be within acceptable parameters prior to data acquisition. Flow cytometric gating was performed sequentially. First, FSC-A (forward scatter area) versus SSC-A (side scatter area) was used as the initial gate to identify sperm and exclude debris and non-sperm events on the basis of light-scattering properties related to cell size and internal complexity. Next, PI-H versus PI-A was used to exclude doublets. Finally, PI-A histograms were used to distinguish X- and O-bearing sperm according to DNA content. Data were analysed using FlowJo v10.8.1 (BD Biosciences, Ashland, OR, USA). The FlowAI plugin was first applied for automated data quality control, followed by manual gating to quantify sperm counts, mean fluorescence intensity, coefficient of variation (CV), and the relative proportions of X- and O-bearing sperm populations.
Statistical analysis
All statistical analyses were performed using SPSS version 27.0. Data are presented as mean ± standard deviation (SD). Normality was assessed using the Shapiro–Wilk test. For adult DNA validation, the observed 3C/5X ratios were compared with the theoretical values (1 for females and 2 for males) using one-sample t-tests. For sperm-based validation, the X/O sperm ratios obtained by qPCR and flow cytometry were compared using a paired Students t-test, consistent with the paired experimental design in which aliquots from the same individual A. suum worms were analysed by both methods. A two-sided p value <0.05 was considered statistically significant. Statistical graphs and visualisations were generated using RStudio (version 4.3.2).
Results
Establishment of standard curves
Genomic DNA was successfully extracted from male and female adult A. suum, with sample concentrations exceeding 50 ng/μL. As an initial step in primer screening, all six candidate primer sets (Table S1) were first tested by conventional PCR using the same DNA template. Among them, primer sets 2C, 3C, 1X, and 5X yielded visible amplification products, whereas the remaining primer sets did not produce clear bands. However, subsequent qPCR evaluation showed that only primer sets 3C and 5X generated the expected amplicons together with single, sharp melting peaks, and were therefore selected for further validation. Primer sets 2C and 1X were excluded because their melting-curve profiles indicated non-specific amplification or poor assay specificity; representative melting curves are shown in Figure S4b, c. The selected primer sets, 3C and 5X, were subsequently validated in three biological replicates (one male and two females). Representative gel images, together with the negative control (N), are shown in Figure S5a, b. In all three individuals, both primer sets generated the expected PCR products and single, sharp melting peaks (Figure S5c, d), confirming specific and reproducible amplification. Accordingly, qPCR conditions for the 3C and 5X assays were further optimised by systematically testing a range of primer concentrations and annealing temperatures using a one-variable-at-a-time approach (Tables S2 and S3).
Based on the optimisation results, the optimal qPCR condition was determined to be 0.4 μM for each primer and an annealing temperature of 58°C. The final optimised assay was performed in a 20 μL reaction volume containing 10 μL of 2× TB Green Premix Ex Taq, 0.8 μL each of forward and reverse primers (10 μM stock; final concentration 0.4 μM each), 1 μL of template DNA or plasmid standard, and 7.4 μL of nuclease-free water. The qPCR program consisted of 95°C for 30 s, followed by 40 cycles of 95°C for 5 s and 58°C for 30 s, with fluorescence acquisition at 58°C, and a subsequent melting curve analysis from 60°C to 90°C. The standard curve for the 3C marker followed the linear equation y = −3.3161x + 38.4076, with a correlation coefficient (R2) of 0.9974, while that for the 5X marker followed y = −3.3527x + 38.2990, with an R2 value of 0.9996 (Figure 1). These results indicate strong linear relationships between Ct values and template copy numbers for both assays.
Standard curves for absolute quantification of 3C and 5X copy numbers by qPCR. Standard templates for 3C and 5X were serially diluted and amplified by qPCR. The Ct values showed a linear relationship with the logarithm of template concentration, supporting the accuracy of copy number quantification. Regression equations and R2 values are shown in each panel.

Validation of qPCR assay accuracy using 3C/5X ratios in adult A. suum
The established qPCR method was applied to quantify the 3C/5X ratio in adult female (n = 30) and male (n = 30) A. suum. The coefficient of variation (CV) for all measurements was below 3%, indicating high reproducibility and methodological stability (Tables S4 and S5). One-sample t-tests were performed to compare the observed 3C/5X ratios with their corresponding theoretical values (Table 1). The mean 3C/5X ratio in females was 1.009 ± 0.042, showing no significant deviation from the expected value of 1 (t = 1.171, d.f. = 29, p = 0.251). Similarly, the mean 3C/5X ratio in males was 1.995 ± 0.054, which did not significantly deviate from the expected value of 2 (t = −0.554, d.f. = 29, p = 0.591) (Figure 2). Together, these results demonstrate that the established qPCR assay provides accurate and reliable quantification of the 3C/5X ratio, supporting its application for molecular sex identification in A. suum.
Ratio of autosomes (3C) to sex chromosomes (5X) in females and males single sample t test

Table 1. Long description
The table consists of six columns: Gender, proportional mean, Degree of freedom, t value, p-value 95 percent, and 95 percent C I.
* The first row for Female shows a proportional mean of 1.009 plus or minus 0.042, 29 degrees of freedom, a t value of 1.171, a p-value of 0.251, and a 95 percent CI of negative 0.007 to 0.025.
* The second row for Male shows a proportional mean of 1.995 plus or minus 0.054, 29 degrees of freedom, a t value of negative 0.554, a p-value of 0.591, and a 95 percent CI of negative 0.026 to 0.015.
A footnote indicates that the test value for females is 1 and the test value for males is 2.
Among them, the test value for females is 1 and that for males is 2.
Comparison of observed 3C:5X ratios with the expected theoretical values in male and female Ascaris suum.
Observed 3C:5X ratios were compared with theoretical expectations (female = 1; male = 2) using one-sample t-tests (n = 30 per group). Box plots show the median, interquartile range, and range; dashed lines indicate the expected theoretical ratios. The observed ratios did not significantly deviate from the expected values in either females (p = 0.251) or males (p = 0.591); both comparisons were not statistically significant (p > 0.05).

Figure 2. Long description
A two-panel graph with distinct Y-axes.
Left Panel (Female):
The left Y-axis is red, ranging from 0.92 to 1.12. A horizontal dashed line is set at ratio equals 1. The red box plot shows a median line slightly above 1.00, with a mean dot further above. The whiskers extend from approximately 0.93 to 1.10. A bracket above the plot indicates p equals 0.251.
Right Panel (Male):
The right Y-axis is blue, ranging from 1.90 to 2.15. A horizontal dashed line is set at ratio equals 2. The blue box plot shows a median line slightly above 2.00, with a mean dot just above the median. The whiskers extend from approximately 1.91 to 2.14. A bracket above the plot indicates p equals 0.591.
A legend at the top right identifies the red box as Female and the blue box as Male.
Validation of a qPCR assay against flow cytometry for the quantification of X/O sperm ratios in A. suum
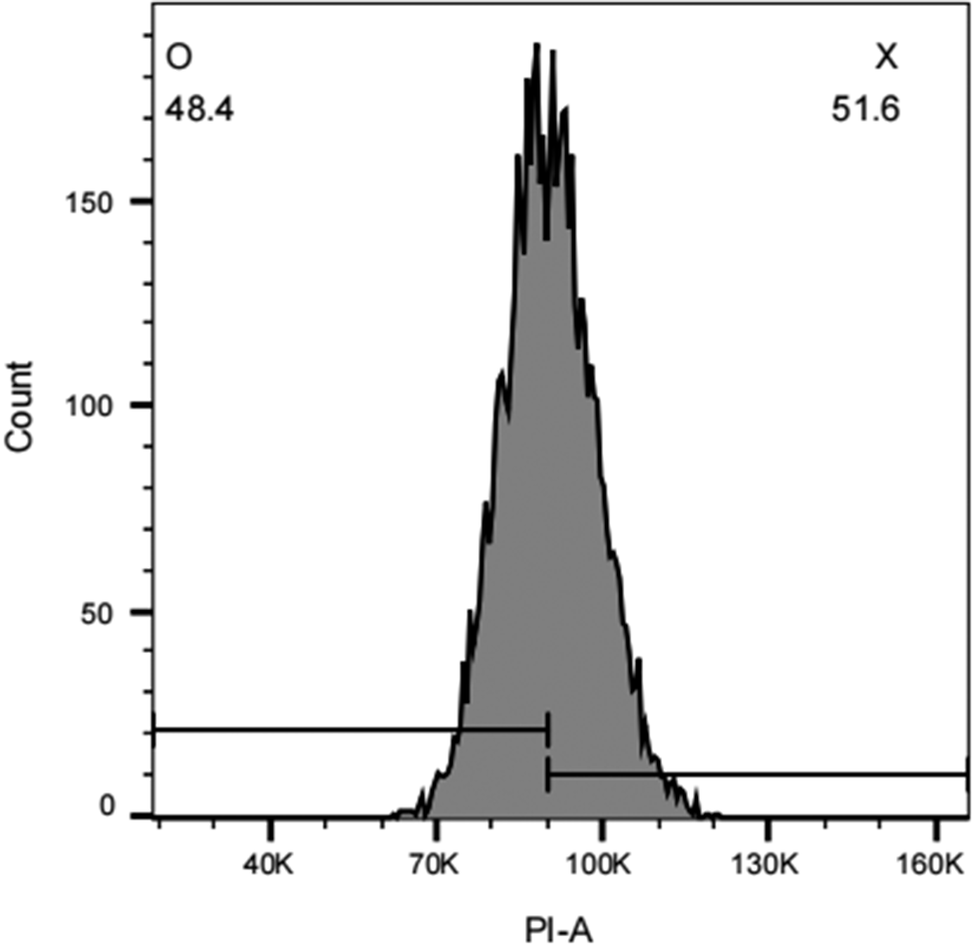
Flow-cytometric gating was performed sequentially to identify sperm events suitable for DNA-content analysis. As shown in the FSC-A versus SSC-A scatter plot (Figure 3A), the gated region was used to identify the main sperm population and exclude debris and non-sperm events. Doublets and aggregated sperm were then excluded using PI-H versus PI-A gating (Figure 3B), thereby retaining single sperm events for subsequent analysis. An optimal propidium iodide (PI) concentration of 150 μg/mL was determined for sperm staining, as this concentration yielded the highest mean fluorescence intensity, indicating staining saturation (Table S6). Under the optimised staining conditions (150 μg/mL PI, 30 min), sperm samples collected from 30 individual male A. suum were analysed using the established gating strategy. PI fluorescence intensity histograms were generated to quantify the proportions of X- and O-bearing sperm (Figure 4). The mean PI fluorescence intensity of single sperm ranged from 1.0 × 10⁵ to 1.1 × 10⁵, and the coefficients of variation (CVs) for both X- and O-bearing sperm populations were below 10%, indicating good consistency in DNA-content measurements. Flow cytometric analysis revealed an average X/O sperm ratio of 1.081 ± 0.163 across the 30 individuals (Table S7).
Flow-cytometric gating strategy for the analysis of Ascaris suum sperm.
(A) Forward scatter area (FSC-A) versus side scatter area (SSC-A) plot used to identify the main sperm population on the basis of cell size-related and internal complexity-related light-scattering properties and to exclude debris and non-sperm events. The circled gate indicates the sperm population selected for downstream analysis.
(B) Propidium iodide fluorescence area (PI-A) versus fluorescence height (PI-H) plot used to retain single sperm events and exclude aggregates or doublets. The gated population was used for subsequent DNA-content analysis.

Representative PI-A histogram of gated single Ascaris suum sperm stained with propidium iodide (PI).
The x-axis shows PI-A (propidium iodide fluorescence area), which reflects relative DNA content, and the y-axis shows event count. Based on PI fluorescence intensity, two sperm populations were identified: O-bearing sperm with lower PI-A fluorescence and X-bearing sperm with higher PI-A fluorescence. The percentage of each population in this representative sample is indicated in the figure.

For comparison, the X/O sperm ratio of the same 30 sperm samples was independently estimated by qPCR, yielding an average value of 0.980 ± 0.093 (Table S8). Although the two methods produced significantly different mean ratio values paired Students t-test, t = −2.886, d.f. = 29, p = 0.0073; Figure 5), the qPCR-based estimates showed lower variability than those obtained by flow cytometry, as reflected by the narrower distribution and lower SD/CV values. These results support the utility of qPCR as a reproducible method for estimating sperm sex ratios in A. suum.
Comparison of X:O ratio measured by flow cytometry and qPCR in 30 paired samples.
Comparison of X:O ratios measured by flow cytometry and qPCR in 30 paired samples.
Each dot represents one sample, and grey lines connect paired measurements. The dashed horizontal line indicates an X:O ratio of 1.0. X:O ratios differed significantly between the two methods (paired t-test, p = 0.0073). ** Indicates p < 0.01.

Figure 5. Long description
A dot plot with two categorical columns on the x-axis and a numerical y-axis. The y-axis is labeled X colon O Ratio and ranges from 0.7 to 1.5 in increments of 0.1. A dashed horizontal line is positioned at the 1.0 mark.
On the left, the Flow cytometry column contains pink dots representing 30 samples. These dots are widely distributed between approximately 0.75 and 1.45.
On the right, the q P C R column contains blue dots representing the same 30 samples. These dots are more tightly clustered, mostly between 0.85 and 1.1, with a few outliers up to 1.25.
Grey lines connect each pink dot to its corresponding blue dot. The majority of these lines trend downward from left to right, indicating that qPCR generally yields lower X colon O ratios than flow cytometry.
A horizontal bracket at the top connects the two columns, labeled with two red asterisks and p is less than 0.01, indicating a statistically significant difference.
Discussion
The qPCR-based approach developed in this study, which relies on relative quantification of single-copy autosomal (3C) and X-linked (5X) sequences, provides a precise and versatile molecular tool for sex identification in individual A. suum. Importantly, this method could potentially be applied from the fertilised egg stage onward, provided that single specimens can be isolated (Figure S1), thereby offering a possible solution to a long-standing limitation in studying sex determination in this species.
By accurately quantifying X/O sperm ratios, this assay enabled us to assess whether the pronounced female-biased sex ratio in A. suum originates from biased production of X- and O-bearing sperm during spermatogenesis. Because the X/O ratio in sperm was approximately 1:1, our data do not support marked sex ratio distortion at the level of sperm production. Instead, these findings suggest that the observed female bias is more likely to arise after fertilisation or during subsequent development. Thus, the assay provides an important tool for narrowing the developmental window in which sex ratio distortion is established. To explore its potential applicability beyond A. suum, the 3C/5X primer sets designed from A. suum were further tested in Ascaris lumbricoides and Parascaris univalens by conventional PCR. However, no clear amplification was obtained in either species, indicating that these primers are not readily transferable to the other ascarids tested here. Because the target loci are short single-copy sequences, primers designed from more conserved regions may be required for future application across related ascarid species.
Both qPCR and flow cytometry successfully quantified the X/O sperm ratio in A. suum. Although the two methods produced significantly different mean ratio values, the qPCR-based estimates showed lower variability than those obtained by flow cytometry, as reflected by the narrower distribution and lower SD/CV values. These results support the utility of the newly established qPCR method as a reproducible approach for estimating sperm sex ratios in A. suum, particularly in studies requiring higher-throughput analysis. Flow cytometry stands out for its rapid processing and minimal sample preparation (Kanno et al Reference Kanno, Hiramatsu, Mikami, Nakayashiki, Yamashita, Nagai, Okabe, Li, Yin, Tominaga, Bicer, Noma, Kiani, Efa, Büscher, Wazawa, Sonoshita, Shintaku, Nagai, Braun, Houston, Rashad, Niizuma and Goda2024), enabling high-throughput visualisation of DNA content differences (~14% between X- and O-bearing sperm), which makes it suitable for quick initial evaluations. However, its limitations include vulnerability to artifacts from non-specific staining, nuclear integrity problems, or gating errors, and the requirement for costly specialised equipment (Hossain et al Reference Hossain, Johannisson, Wallgren, Nagy, Siqueira and Rodriguez-Martinez2011), potentially restricting its use in labs with limited resources. In contrast, qPCR offers superior precision and stability by directly amplifying specific loci. Nevertheless, qPCR involves more hands-on steps, takes longer to process, and requires higher reagent costs, although it relies on standard PCR equipment that is widely available (Smith and Osborn Reference Smith and Osborn2009). Ultimately, the selection between these methods hinges on research objectives: flow cytometry for expeditious preliminary assessments, and qPCR for meticulous, reproducible quantitative analyses.
Beyond method validation, this approach opens new avenues for investigating sex ratio dynamics throughout the A. suum life cycle, from fertilised eggs and larval stages to adult worms. Such longitudinal analyses would enable precise identification of the developmental window(s) at which sex ratio deviations first arise or become most pronounced. Identifying these critical stages would, in turn, facilitate targeted experimental manipulation of environmental or host-related factors during key developmental periods, an essential step towards elucidating the mechanisms driving sex ratio bias in parasitic nematodes.
Conclusion
We developed and validated a qPCR assay in adult and sperm samples of A. suum, which may be extended to other developmental stages. By targeting single-copy autosomal and X-linked loci under the XX/XO system, the assay may enable sex identification prior to morphological differentiation. It also allows quantification of X/O sperm ratios, providing a practical tool to test whether female-biased sex ratios arise during spermatogenesis or after fertilisation. This method should facilitate studies of reproductive biology and sex ratio variation in A. suum and other parasitic nematodes with similar sex-determination systems.
Supplementary material
The supplementary material for this article can be found at http://doi.org/10.1017/S0022149X26101722.
Acknowledgements
We would like to acknowledge the technical support of the Analysis and Testing Center of Northeast Forestry University. We would like to acknowledge the Open Shared System of Large-scale Instrumentation and Equipment of Northeast Forestry University.
Financial support
This work was supported by the Jointly Guided Project of Heilongjiang Natural Science Foundation (LH2024C055) and the Full-time Postdoctoral Support Program from NEFU (415880), the Start-up Scientific Foundation of Northeast Forestry University.
Competing interests
The authors declare that there are no competing interests in this work.