Introduction
A number of studies have explored the relationship between socio-economic status (SES) and mortality, although these have mostly been based on the working-age population (Blakely, Tobias and Atkinson Reference Blakely, Tobias and Atkinson2008; Blakely et al. Reference Blakely, Fawcett, Atkinson, Tobias and Cheung2005; Fawcett and Blakely Reference Fawcett and Blakely2007; Mackenbach et al. Reference Mackenbach, Kunst, Groenhof, Borgan, Costa, Faggiano, Józan, Leinsalu, Martikainen, Rychtarikova and Valkonen1997), despite the fact that the burden of mortality is highest in older people. The study of socio-economic inequalities in mortality in old age is important given the gains in longevity, increasing ageing population and expanding health expenditure as societies age. Older age is often associated with deterioration in health status and an increase in problems with physical functioning, chronic disease and cognitive functioning. Because of the association between age, health and use of health care, and between SES and use of health services (McNiece and Majeed Reference Mackenbach, Kunst, Cavelaars, Groenhof and Geurts1999), information on socio-economic inequalities in old age will assist with ongoing reductions in mortality.
The studies among older people show some commonalities, and some inconsistencies. In common, they generally show that socio-economic inequalities in mortality persisted in old age (Bassuk, Berkman and Amick Reference Bassuk, Berkman and Amick2002; Huisman et al. Reference Huisman, Kunst, Andersen, Bopp, Borgan, Borrell, Costa, Deboosere, Desplanques, Donkin, Gadeyne, Minder, Regidor, Spadea, Valkonen and Mackenbach2004; Kitagawa and Hauser Reference Kitagawa and Hauser1973; Liang et al. Reference Liang, Bennett, Krause, Kobayashi, Kim, Brown, Akiyama, Sugisawa and Jain2002; Marmot and Shipley Reference Marmot and Shipley1996; Martelin Reference Martelin1994; Martikainen et al. Reference Martikainen, Makela, Koskinen and Valkonen2001; Martin Reference Martin1988; Sorlie, Backlund and Keller Reference Sorlie, Backlund and Keller1995); but although relative inequalities (rate ratios) in mortality declined with increasing age, absolute socio-economic inequalities (rate differences or similar measures) increased with age (Huisman et al. Reference Huisman, Kunst, Andersen, Bopp, Borgan, Borrell, Costa, Deboosere, Desplanques, Donkin, Gadeyne, Minder, Regidor, Spadea, Valkonen and Mackenbach2004; Marmot and Shipley Reference Marmot and Shipley1996; Martikainen et al. Reference Martikainen, Makela, Koskinen and Valkonen2001). For example, Huisman et al. (Reference Huisman, Kunst, Andersen, Bopp, Borgan, Borrell, Costa, Deboosere, Desplanques, Donkin, Gadeyne, Minder, Regidor, Spadea, Valkonen and Mackenbach2004), in their pooled data from 11 European countries and regions, found that for men relative education inequalities (rate ratios) decreased from 1.98 for 30–39-year-olds to 1.51 for 50–59-year-olds and 1.09 for those 90 + , while absolute differences increased from 0.64 (per 1000 person years at risk) for 30–39-year-olds to 3.21 for 50–59-year-olds and 35.89 for those 90+ (Huisman et al. Reference Huisman, Kunst, Andersen, Bopp, Borgan, Borrell, Costa, Deboosere, Desplanques, Donkin, Gadeyne, Minder, Regidor, Spadea, Valkonen and Mackenbach2004). The same study also found mixed evidence of an age pattern of relative inequalities depending on sex, country of birth and indicator for SES. For example, they showed in their international comparison that relative mortality differences by education (e.g. a gradual decrease of relative educational inequalities among women in the older group was only found in Finland out of ten country studies) and housing tenure (e.g. a gradual decrease of inequalities among women related to housing tenure in the older group was only found in Finland and Denmark out of ten country studies) did not decrease or hardly decreased with age for women in many countries (Huisman et al. Reference Huisman, Kunst, Andersen, Bopp, Borgan, Borrell, Costa, Deboosere, Desplanques, Donkin, Gadeyne, Minder, Regidor, Spadea, Valkonen and Mackenbach2004). Additionally, Hoffman (Reference Hoffman2005) found that relative socio-economic mortality differences are stable across age groups among the healthy, whereas they clearly decline with decreasing health among those in poor health. This suggests decreasing health with age, rather than age per se, is the equaliser of social differences in mortality, and this may be as a result of a universal shift from social to biological determinants of mortality when health decreases in old age.
The decline of relative inequalities in mortality with age as suggested by many studies (not adjusting for health status as above) is not surprising, as the exponential increase in mortality with age means that absolute inequalities in mortality would have to become extremely large for relative inequalities not to diminish. In addition to this mathematical imperative for relative inequalities to diminish with increasing age, selectivity is also probably a driver. Selectivity means that those of lower socio-economic position surviving to older age are probably selected for better health status and lower mortality rates, thus converging (in relative terms at least) with the mortality rates of their higher socio-economic compatriots. However, directly testing this selectivity hypothesis is difficult. Other arguments put forward for explaining decreasing socio-economic mortality in older ages are (a) ageing works as a leveller of social differences because biological processes assume dominance over social determinants and eventually everybody must die, regardless of social class (Liang et al. Reference Liang, Bennett, Krause, Kobayashi, Kim, Brown, Akiyama, Sugisawa and Jain2002) and (b) the welfare state reduces socio-economic differences in old age through benefits and social policy (Berkman Reference Berkman1988; Berkman and Macintyre Reference Berkman, Macintyre, Kogevinas, Pearce and Boffetta1997).
The relative scarcity of published research on variations in the mortality of older adults probably stems in part from the lack of reliable data with appropriate sample size, the difficulty involved in applying and assigning SES indicators to older people and the past assumption of homogeneity of mortality risk in old age across socio-economic position. Further, most studies on SES differentials in mortality in old age have focused on a single measure of SES such as income, education and home ownership. But multiple socio-economic measures have been recommended (Huisman, Kunst and Mackenbach Reference Huisman, Kunst and Mackenbach2003) as no single measure proves comprehensive enough to portray the entire extent of socio-economic position, particularly among the older people (Martelin Reference Martelin1994). Moreover, less attention has been paid to area-based measures of SES.
We overcome many of these problems by studying mortality differentials by socio-economic characteristics among the population aged 65 years or over during the period 2001–04 in New Zealand on the basis of data obtained by means of linking census data with mortality data. The size of this study (1.3 million person years) permits simultaneous examination of a range of SES factors. (Ethnic disparities in mortality are considered in another paper; Jatrana and Blakely Reference Jatrana and Blakely2008.) We also include neighbourhood-level deprivation (NZDep). This is measured at the small census meshblock level of about 100 people, so is actually as much a marker of personal SES as it is a contextual measure. One advantage of NZDep for older people is it presumably acts as a marker of lifetime socio-economic resources (i.e. one's realised residential-based SES), and is not prone to convergence of income at older ages. Whilst NZDep probably captures some neighbourhood-level factors in additional to personal-level SES, it is probably as much a marker of individual-level SES. Moreover, use of individual, household and area-based measures of SES allows us to represent various aspects of socio-economic resources during old age and provide a more comprehensive picture of variation in SES status. We address three research questions in this study: What is the size of socio-economic inequalities in mortality among the elderly in New Zealand? Which socio-economic factors have strong and independent associations? How do relative inequalities in mortality vary by age among the elderly?
Methods
Record linkage of census and mortality records
This paper uses a cohort study of all New Zealanders formed by anonymous and probabilistic record linkage of 2001 census records to 2001–04 mortality records (Fawcett, Atkinson and Blakely Reference Fawcett, Atkinson and Blakely2007). Of the eligible 2001–04 mortality records for the age group 65+ years, 83.5 per cent were successfully linked to 2001 census records and at least 97 per cent of these linkages were estimated to be true links (Fawcett, Atkinson and Blakely Reference Fawcett and Blakely2007). The proportion of mortality records linked to a census record varied by sex, age, ethnicity and neighbourhood deprivation (see below for description of deprivation index). To allow for varying linkage success by these demographic strata, weights were assigned to the linked census–mortality record to make them representative of all eligible deaths. For example, if 20 out of 30 deaths for Māori (indigenous people of New Zealand) males aged 65–74 living in moderately deprived neighbourhoods were linked to a census record, then each of these 20 linked records was assigned a weight of 1.5 (i.e. 30/20). Elsewhere, we have shown these linkage weights to be valid (Fawcett, Blakely and Atkinson Reference Fawcett, Blakely and Atkinson2002). It remains possible that there may still be some residual linkage bias by variables like household tenure (which is not recorded on mortality data precluding an examination of either potential bias, or weighting for same), whereby rate ratios comparing mortality among renting and owning people are moderately biased. However, any such residual linkage bias would have to occur within relatively five strata of sex by age by ethnicity by neighbourhood deprivation by cause of death, and we do not think such residual bias will be notable.
Measurement of socio-economic status
Highest educational qualification
Education has been commonly used to assess socio-economic mortality and health/mortality gradients among older adults in the United States of America and Europe. It is a preferred measure of SES among the elderly because education is generally fixed some time in late adolescence or early adulthood, making it among the least susceptible of all measures to reverse causality (Grundy and Halt Reference Grundy and Halt2001). Education categories were based on the highest level of qualification achieved and the three categories ranged from nil qualification to a post-school qualification.
Personal income
Personal income categories of the respondent were classified into high, medium and low groupings to approximate equalised income tertiles based on older people's responses. Tertiles were used to allow identification of groups with sufficient numbers ranked in a logical hierarchy so that gradients in health inequalities can be investigated. We choose not to use household income due to the large number of subjects that would be excluded from analyses (e.g. not living in private dwellings, another adult in household absent on census night or not reporting an income, etc., all invalidate a measure of household income).
Housing tenure and car access (household level)
These are the commonly used measures of asset wealth, and also proxies for income and social class, though they have independent associations with health (Macintyre et al. Reference Macintyre, Ellaway, Der, Ford and Hunt1998, Reference Macintyre, Hiscock, Kearns and Ellaway2001). Such measures may be more appropriate economic measures for older adults, assessing economic advantage or disadvantage accumulated over the lifecourse (Robert and House Reference Robert and House1996).
Neighbourhood deprivation
Neighbourhood deprivation was measured using NZDep2001 index grouped as quintiles, where 1 is the least deprived 20 per cent of areas and 5 is the most deprived 20 per cent of areas (Salmond and Crampton Reference Salmond and Crampton2002). NZDep2001 was calculated using 2001 census data on socio-economic characteristics (e.g. car access, tenure and receipt of means-tested benefits) at aggregation of about 100 people, and assigned to mortality data by use of address (Salmond and Crampton Reference Salmond and Crampton2002).
Data analysis
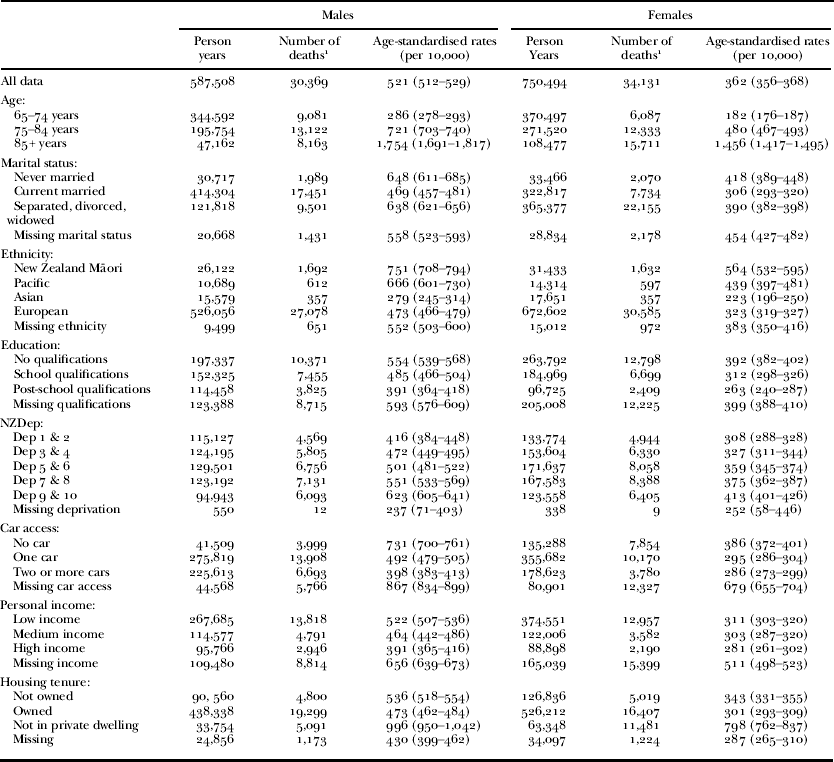
Table 1 shows the number of deaths and person-years by level of each variable, including missing for each variable. Missingness ranges from 0.06 per cent for neighbourhood deprivation to 25 per cent for education. All variables were treated as categorical variables in the analyses. Poisson regression analyses were initially restricted to those with complete data on age, ethnicity and marital status and the analytical variable in question (first and fourth columns in Table 2), then restricted to those with complete data on all variables (other columns in Table 2 and all of Table 3) – 400,275 person years for males and 446,277 person years for females or 68 and 59 per cent of all eligible person years for males and females, respectively. Analyses were conducted in SAS v8.0 on-site at Statistics New Zealand. Regression models used exact counts, but all frequency output presented in tables in this paper are random rounded to a near multiple of three as per Statistics New Zealand protocol.
Descriptive statistics by gender

Notes: 1. Weighted number of deaths. NZDep: neighbourhood deprivation.
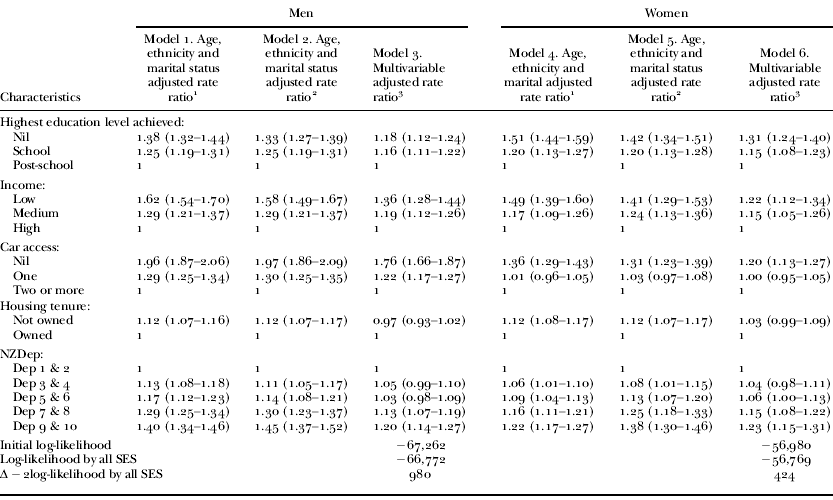
Rate ratios (95% confidence interval) of all-cause mortality by socio-economic factors among older adults, New Zealand, 2001–04
Notes: 1. Adjusted for age, ethnicity and marital status but including those with missing values on other indicators. 2. Adjusted for age, ethnicity and marital status but analyses were conducted on a dataset restricted to those people with non-missing data on all variables. 3. Adjusted for age, ethnicity, marital status and all the socio-economic factors in the model and analyses were conducted on a dataset restricted to those people with non-missing data on all variables. NZDep: neighbourhood deprivation. SES: socio-economic status.
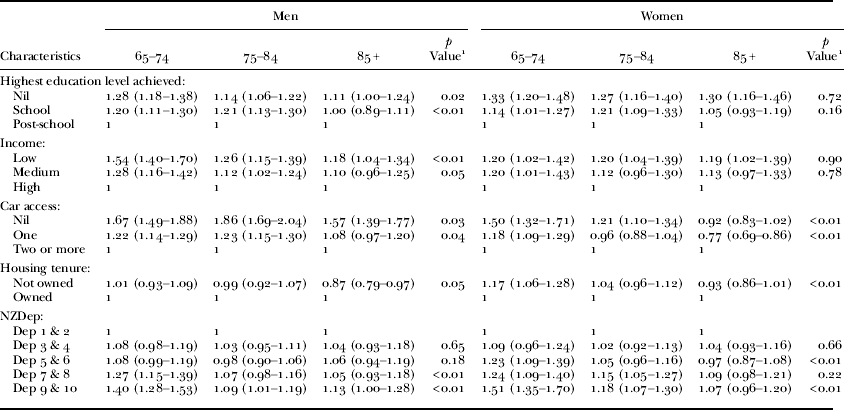
Rate ratios (95% confidence interval) of all-cause mortality by socio-economic factors among older adults by age group, New Zealand, 2001–04 (multivariable model)
Notes: 1. Wald test of heterogeneity of rate ratios across strata of age. NZDep: neighbourhood deprivation.
Results
Table 1 shows the age-standardised mortality rates in addition to basic descriptive statistics. Rates were consistently higher for lower socio-economic groups. The all-cause mortality rate ratios adjusted for age, ethnicity and marital status (Model 1, Table 2) show that lower socio-economic groups of men had an excess mortality of between 12 per cent (not owning one's house) to 96 per cent (no car access) compared to more socio-economic privileged men. This percentage range was 12 per cent (housing tenure again) to 51 per cent (nil qualifications) for women. Gradients were evident for those variables with three or more levels (i.e. education, income, car access and neighbourhood deprivation).
Models 2 and 5 in Table 2 restrict the data further to those with complete data on all covariates. When compared to Models 1 and 4 (restricted to those with complete data on age, ethnicity and marital status and the analytical variable in question), respectively, this provides a test of possible selection bias for those factors that had data for most of the cohorts, but missing data on other variables (i.e. NZDep and to a lesser extent car access). Reassuringly, the results change little for car access and NZDep among men. However, there is a steepening in the NZDep gradient among women when moving to the most restricted cohort. For example, the rate ratio for NZDep 9 & 10 increases from 1.22 to 1.38, an increase of three-quarters of the strength of association. Thus, the NZDep analysis suggests possible selection bias for women when the maximal cohort restriction is imposed.
Comparing across sexes, the association of income was clearly stronger among both men and women, and the association of car access was stronger among men – although the 95 per cent CI values for the low–high income rate ratios for men and women still overlapped. Looking at the other socio-economic factors, the education association was strongest among women and the neighbourhood deprivation association was strongest among men – however, CI values overlapped comparing sexes.
As expected, the rate ratios reduced in the multivariable analysis (Model 3, Table 2), and all 95 per cent CI values (except for housing tenure) excluded the null. Among men the reductions in excess rate ratios ranged from 22 per cent for car access (i.e. [0.97–0.76]/0.97) to 56 per cent for neighbourhood deprivation among males, and beyond the null for household tenure. Among women the range was from 26 per cent for education to 46 per cent for income, and 75 per cent for household tenure. Of particular note, the strength of association of neighbourhood deprivation with mortality tends to reduce notably for both men (56 per cent) and women (39 per cent), a finding consistent with the other individual or household-level factors ‘explaining away’ much – but far from all – of the possible contextual effect of neighbourhood SES.
To investigate how SES differentials in health vary by age, we stratified the sample by age and ran separate regression analyses. The SES differentials varied substantially by age after other SES covariates were controlled for. That is, Wald tests of heterogeneity across age were statistically significant for all socio-economic factors among men, and for car access, housing tenure and NZDep among women (Table 3). Notably however, income and educational difference in mortality among females did not vary with age. Also, a strong association of neighbourhood deprivation with mortality was only apparent for 65–74-year-olds.
Considering the oldest old men (i.e. 85+ years), mortality differentials of 10–20 per cent persisted for education, income and neighbourhood deprivation (and 95 per cent CI values excluded the null), a 57 per cent differential persisted for nil versus two or more cars, but there was a seemingly protective association of rental tenure. Among 85+ women, notable socio-economic differentials were only apparent for education and income.
Discussion and conclusions
We have examined the association of different indicators of SES with mortality among the older adults in New Zealand using census–mortality linked data. Unlike many analyses which have considered only one or two SES indicators, we have used multiple indicators of SES to represent various aspects of socio-economic resources. With respect to our three research questions, we found that:
1. Socio-economic mortality gradients persist into old age (i.e. 65 years plus).
2. Substantial relative risks of mortality were observed for all socio-economic factors except housing tenure.
3. The relative strength of association of socio-economic factors with mortality diminished with increasing age, except by income and education among women.
The persistence of socio-economic mortality gradients in old age is in line with previously reported studies for older adults in other Western settings, particularly Europe and America (Bassuk, Berkman and Amick Reference Bassuk, Berkman and Amick2002; Geyer and Peter Reference Geyer and Peter2000; Huisman, Kunst and Mackenbach Reference Huisman, Kunst and Mackenbach2003; Huisman et al. Reference Huisman, Kunst, Andersen, Bopp, Borgan, Borrell, Costa, Deboosere, Desplanques, Donkin, Gadeyne, Minder, Regidor, Spadea, Valkonen and Mackenbach2004; Lynch, Smith and Kaplan Reference Lynch, Smith and Kaplan2000; Mackenbach & Kunst Reference Mackenbach, Kunst, Groenhof, Borgan, Costa, Faggiano, Józan, Leinsalu, Martikainen, Rychtarikova and Valkonen1997; Marmot and Wilkinson Reference Marmot and Wilkinson1999; Martelin Reference Martelin1994, 1996; Martelin, Koskinen and Valkonen Reference Martelin, Koskinen and Valkonen1998). Of particular interest was the persistent association of neighbourhood deprivation with mortality, after adjusting for several individual- or household-level socio-economic factors. Whilst this study was not set up specifically to be a multi-level examination of neighbourhood effects on mortality, the results are consistent with a possible independent effect of neighbourhood SES on health over and above the individual-level associations. (In analyses we have conducted elsewhere, specifying a random effect at the neighbourhood level makes little difference to the estimate of neighbourhood-level variables in the New Zealand Census-Mortality Study (NZCMS), especially once other covariates are adjusted for; Blakely et al. Reference Blakely, Atkinson, Ivory, Collings, Wilton and Howden-Chapman2006.) It does, however, remain a moot point whether better specification and measurement of household and individual-level variables would result in the association of neighbourhood-level deprivation with mortality disappearing (Blakely and Subramanian Reference Blakely, Subramanian, Oakes and Kaufman2006).
The association of the SES indicators and mortality may also vary depending on the gender of the respondent. Thus, while education had the largest rate ratio of mortality among women independent of demographic and the other four SES indicators, car access had the largest rate ratio for men. Also, the associations tended to be stronger among men for all variables except education – but only statistically significantly different between men and women for car access. Lack of an association between car access and mortality for women in the oldest age group may signify the different meaning the older people attribute to it and also health selection. Several previous traffic gerontological studies found distinctive gender differences among older people in attitudes, expectations and impacts on quality of life and social networking of car ownership and coping without a car situation (Davey Reference Davey2007; Davey and Nimmo Reference Davey and Nimmo2003; Gilhooly et al. Reference Gilhooly, Hamilton, O'Neill, Gow, Webster and Pike2003; Oxley Reference Oxley2000; Rothe Reference Rothe1994; Siren, Hakamies-Blomqvist and Lindeman Reference Siren, Hakamies-Blomqvist and Lindeman2004). For example, studies from New Zealand found that men placed a higher value than women on owning and driving a private vehicle, and more frequently associated vehicle ownership and use with individuality, independence and the status of being competent (Davey and Nimmo Reference Davey and Nimmo2003). Similarly, a study from the United Kingdom found that car ownership and driving were linked to quality of life and status, especially for men, and giving up the car or driving cessation was associated with downward social mobility and a reduced quality of life (Gilhooly et al. Reference Gilhooly, Hamilton, O'Neill, Gow, Webster and Pike2003). The impact of giving up driving or no longer having access to private transport may be greater on men because women generally have better social networks, are more home oriented and have more home-based hobbies and are more used to being driven (Davey Reference Davey2007). While men, on the other hand, have been accustomed to being in charge and consider it demeaning to be driven, or to use public transport (Gilhooly et al. Reference Gilhooly, Hamilton, O'Neill, Gow, Webster and Pike2003), and continuing driving is related to perpetuating a normative masculinity (Rothe Reference Rothe1994). Moreover, women drivers are more likely than men to voluntarily give up driving, at a younger age, and in better health (Gallo, Rebok and Lesikar Reference Gallo, Rebok and Lesikar1999; Hakamies-Blomqvist and Wahlstrom Reference Hakamies-Blomqvist and Wahlstrom1998; Rabbit et al. Reference Rabbit, Carmichael, Jones and Holland1996), thus producing a health selection effect. In other words, men may tend to keep on owning and driving as long as their health allows, leading to large differentials in health and mortality of those who own and those who do not own a car.
A surprising finding was that housing tenure did not predict mortality in our study. This result contrasts with other studies in which housing tenure was significantly associated with poor health and high mortality (Connolly, O'Reilly and Rosato Reference Connolly, O'Reilly and Rosato2010; Macintyre et al. Reference Macintyre, Ellaway, Der, Ford and Hunt1998, Reference Macintyre, Hiscock, Kearns and Ellaway2001). There may be at least three possibilities to explain a lack of association between housing tenure and mortality. First, our analyses included everyone aged 65 and over living only in private households. As institutional residence is associated with marital status and gender and health (Grundy and Sloggett Reference Grundy and Sloggett2003), the exclusion of people living in institutions can be a serious source of bias (Grundy and Halt Reference Grundy and Halt2001; Huisman et al. Reference Huisman, Kunst, Andersen, Bopp, Borgan, Borrell, Costa, Deboosere, Desplanques, Donkin, Gadeyne, Minder, Regidor, Spadea, Valkonen and Mackenbach2004). The exclusion of this group from the study is likely to have the effect of minimising the reported socio-economic differentials with mortality in older age, if those not owning homes and in poor health are more likely to move to residential homes than those owning homes and in poor health. Second, our finding of a weak association may be spurious – at least in part. Linkage of mortality and census records in the NZCMS is highly dependent on people living at the same address when they die as they did on census night. It is possible that people in rented properties are more mobile. Whilst we adjust for other socio-demographics to weight and correct the cohorts for possible linkage biases, we do not have a measure of tenure on the mortality data to specifically adjust for potential linkage bias by tenure. Therefore, we cannot rule out the possibility we have spuriously underestimated the tenure–mortality association, but we do not think this residual bias will be large. Third, there may be no association of housing tenure with mortality. Huisman et al. (Reference Huisman, Kunst, Andersen, Bopp, Borgan, Borrell, Costa, Deboosere, Desplanques, Donkin, Gadeyne, Minder, Regidor, Spadea, Valkonen and Mackenbach2004) found that housing tenure was a less useful indicator among the oldest-old (Grundy and Halt Reference Grundy and Halt2001; Huisman et al. Reference Huisman, Kunst, Andersen, Bopp, Borgan, Borrell, Costa, Deboosere, Desplanques, Donkin, Gadeyne, Minder, Regidor, Spadea, Valkonen and Mackenbach2004); it may be a less sensitive indicator for older people.
Concerning inter-age differences of the association of socio-economic factors with mortality, the present study indicates that relative mortality inequalities related with SES decline slightly but do not disappear with old age in New Zealand. Rather, in some cases it remains quite stable. For instance, the decreasing relative socio-economic gradient with increasing age is clear for education, and income in the case of women. Other studies have shown the differential impact of education and income for men and women (Backlund, Sorlie and Johnson Reference Backlund, Sorlie and Johnson1999; Christenson and Johnson Reference Christenson and Johnson1995). Our results suggest that individual-level measures of SES are more closely related to the mortality than household measures in women. Education and income describes the SES of the women themselves while car ownership (or home ownership) describes the SES of both the partners and NZDep is an area-based measure of deprivation. While for younger women, mortality has been shown to be more closely related to the social status of their husbands than to their own social status (Arber Reference Arber1987), for older women, individual and household measures had similarly strong associations with mortality (Arber and Ginn Reference Arber and Ginn1993).
There are several limitations of this study that need to be considered. First, these results are based on a short-duration cohort study of only three years follow-up, making the results essentially cross-sectional in nature. Clearly longitudinal data would be much more suitable for unravelling the pathways to mortality in later life, e.g. having data on income over the lifecourse. Emerging evidence suggests that health inequalities begin from economic disadvantage from very early life, and accumulate throughout the lifespan (Power and Matthews Reference Power and Matthews1997). It is possible that the association between accumulated lifespan SES and mortality would be stronger than the association reported here. Moreover, we cannot rule out health selection bias. Housing tenure and car access may both be prone to health selection, e.g. people in poor health getting rid of their car, thus exaggerating the association of nil car access with higher mortality. Finally, a quarter of the person-time had to be excluded for some analyses because data were missing (greater among females). However, the results for the full cohort and complete case cohort vary little for most socio-economic factors, suggesting little resultant selection bias. The one exception is deprivation among females when moving to the restricted/complete cohort increased the strength of the association.
Despite these limitations, these results, based on a large dataset for linked census–mortality data, extend our knowledge in several ways. Our results demonstrate unequivocally the strong associations between SES and mortality into older age. It also provides evidence that relative socio-economic inequalities in health decline with age, but nevertheless still persist among the oldest old (85+). Unlike many analyses which have considered only one or two SES indicators, we have used multiple indicators of SES to represent various aspects of socio-economic resources. Hence, our results have implications for the choice of the most sensitive SES indicators to use in studies of older adults.
The persistence of relative inequalities by income and education level in women suggests that for women methods based on individual criteria showed greater social differences in mortality than household-based measures of social position. This is particularly important because of the difficulty in assigning social position to women using common measures of SES like occupation (Goldthrope Reference Goldthrope1983; Mackenbach et al. Reference Mackenbach, Kunst, Cavelaars, Groenhof and Geurts1999; Sacker et al. Reference Sacker, Firth, Fitzpatrick, Lynch and Bartley2000; Stanworth Reference Stanworth1984) . Traditionally, the women's husband's occupation (single women being classified by their own occupation), or the household-based ‘dominance’ methods in which both men and women are assigned the occupation of the economically dominant spouse are used. This issue becomes more complex for older adults who are no longer in the workforce.
The results suggest that while traditional measures of SES for older people, in particular education, income and car access, remained most consistently associated with mortality among New Zealander older adults (Geyer and Peter Reference Geyer and Peter2000; Knesebeck et al. Reference Knesebeck, Luschen, Cockerham and Siegrist2003; Lynch, Smith and Kaplan Reference Lynch, Smith and Kaplan2000), they also point to the merit of alternate measures of SES such as neighbourhood deprivation.
Acknowledgements
Access to the data used in this study was provided by Statistics New Zealand under conditions designed to give effect to the security and confidentiality provisions of the Statistics Act 1975. The results presented in this study are the work of the author, not Statistics New Zealand. The study was funded by the Health Research Council of New Zealand, and receives continuing funding from the Ministry of Health. Ken Huang carried out the analyses.