In situations of migration, severe disparities between parent and peer dialects can arise for local-born individuals, who may have parents who are non-native speakers as well as peers who are native speakers of the local language. For such cases, Chambers (Reference Chambers2002) proposes a strong peer-orientation mechanism: an innate accent filter that blocks parental non-native features and leads local-born children to exclusively acquire the local dialect. However, numerous studies have found that foreign phonetic features introduced via in-migration are not always lost in local-born speech (Sankoff, Reference Sankoff, Chambers, Trudgill and Schilling-Estes2002). A “weak” view of dialect assimilation in migration might propose that, rather than being entirely lost, foreign traits can be retained and functionally reallocated.
Both the strong and weak views often treat nativeness as a major boundary. Accent traits are expected to be either absent (strong version) or immediately reallocated by the first set of individuals to acquire the local dialect natively (weak version). Incremental stages of intergenerational accent change have not been studied closely enough in immigrant groups to move beyond speculation, however, and the following question remains largely unresolved: How quickly and how completely do local-born generations acquire a local dialect and lose exogenous traits, and is this rate and degree of shift governed by largely cognitive (e.g., nativeness) or social (e.g., demographic) factors?
This study addresses these questions by examining the use of a Punjabi accent feature (t-retraction/retroflexion) and a British accent feature (t-glottaling) in the English of London Asians. The study finds that, although t-glottaling does exhibit a clear native/non-native distinction in use, t-retraction/retroflexion does not; it is retained extensively among British-born generations, offering no support for an innate, cognitive filter that blocks non-native traits. Previous studies have similarly found retention of Asian phonetic markers in second-generation (Gen 2) speakers (Alam, Reference Alam2007; Alam & Stuart-Smith, forthcoming; Heselwood & McChrystal, Reference Heselwood and McChrystal2000; Hirson & Sohail, Reference Hirson, Sohail, Trouvain and Barry2007; Khan, Reference Khan2003; Kirkham, forthcoming; Lambert, Alam, & Stuart-Smith, Reference Lambert, Alam and Stuart-Smith2007); however, all of these studies examined only young Gen 2 speakers. By examining both older and younger Gen 2 speakers alongside adult first-generation migrants (Gen 1) in a single community, the present study identifies incremental stages of dialect change in the community. Even the weak claim that retained traits will be immediately reallocated by Gen 2 speakers due to their nativeness is not straightforwardly supported. Linguistic and social reallocation of retroflex /ʈ/ does ultimately take place, but only becomes established in the younger (i.e., chronologically later) Gen 2 group; t-retroflexion among older Gen 2 speakers mimics the Gen 1 parent system. Evidence of nativelike British t-glottaling and wholesale style-shifting in the older Gen 2 group indicate that many members of this group control dual competence in both the parent and peer dialects, altering neither system significantly (though possibly making the first moves toward what becomes the focused younger Asian speech style). This curious delay of one local-born generation before reallocation is established corresponds historically to a shift from minority to majority Asian demographics and to an accompanying change in race relations in the area.
These findings are important for a fuller understanding of incremental stages of adoption of exogenous features into a dialect system, and the relative role that cognitive and social factors may play in such adaptations. In closing, we note parallels to Trudgill's (2004) findings for new-dialect formation in New Zealand and to the debate over cognitive and social factors in creole formation (Bickerton, Reference Bickerton1984; Roberts, Reference Roberts and McWhorter2000).
In the sections that follow, we first discuss previous findings and hypotheses relating to immigrant dialect acquisition. We then present a concise social history of the field site, followed by a review of the methodology, presentation of the multivariate analysis, and discussion of the findings.
FOREIGN ACCENT FEATURES IN ENGLISH DIALECTS
Hypotheses
The study of dialect acquisition has shown overwhelmingly that “children follow the pattern of their peers,” not their parents (Labov, Reference Labov1972:304). Where parent and peer dialects differ significantly, caregiver influence ultimately transitions to a peer orientation that has been argued to “override all other factors” (Kerswill & Williams, Reference Kerswill and Williams2000:94). The most severe disparity between parent and peer dialect arises when parents are non-native speakers of the local language. For such situations, Chambers (Reference Chambers2002) proposes a strong, cognitively based version of peer orientation, claiming that an innate accent filter (linked to a critical period for acquisition) filters out parents' non-native features and leads local-born children to exclusively acquire the local dialect. Based on a comment by the non-native parent of a boy in Toronto, Chambers describes the “Ethan Experience” as one in which an “innate accent-filter appears to function as a subconscious guide to phonological acquisition (and perhaps more than phonology), smoothing the process by screening out non-native elements” (p. 122).Footnote 1
The proposed filtering of non-native elements is intuitive to the extent that children of non-native parents often appear to acquire nativelike grammars, but Chambers does not support the hypothesis with empirical evidence. It has nevertheless been invoked in recent discussions of North American immigrant communities. The central uncertainty in evaluating Chambers's hypothesis is whether an innate mechanism is necessary, or whether the social forces typically active in monolingual dialect acquisition are in fact sufficient to explain these cases as well. Chambers's reliance on an innate filter forces a sharp, hard-wired delineation between native and non-native speakers, a view complicated by many existing empirical observations.
First, the Ethan Experience appears to run counter to well-known situations of language shift involving imperfect learning, where non-native features are widely retained in group second language acquisition and transmission (Thomason, Reference Thomason2001; Winford, Reference Winford2003). A response may be that insufficient access to native input forces an anomalous retention of non-native traits in such cases, and the Ethan Experience applies solely to immigrant situations.
Even here, problems arise. The innate filter requires that the strong caregiver influence found in early stages of dialect acquisition among monolinguals (Chambers, Reference Chambers2003: 174; Foulkes Docherty, & Watt, Reference Foulkes, Docherty and Watt1999, Reference Foulkes, Docherty and Watt2005; Roberts, Reference Roberts, Chambers, Schilling–Estes and Trudgill2002; Roberts & Labov, Reference Roberts and Labov1995:101; Smith, Durham, & Fortune, Reference Smith, Durham and Fortune2007, Reference Smith, Durham and Fortune2009) be absent for non-native caregivers. However, many British Asian children who speak their heritage language at home before attending school initially develop limited and heavily accented English at an early age, based directly on caregiver interactions (cf., Khattab Reference Khattab, Bullock and Toribio2009). As Evans, Mistry, & Moreiras (Reference Evans, Mistry, Moreiras, Trouvain and Barry2007) also noted, this suggests that non-native parental traits can be acquired at very early stages, and that their retention or loss may be governed by shifts in the balance of input and social integration with particular peer groups, as in the case of native speaker migration and contact (Kerswill & Williams, Reference Kerswill and Williams2000).Footnote 2
Finally, many studies have indicated that foreign traits can become a source of new raw material in dialect change, to mark affiliation or to inscribe new social boundaries (Cheshire, Fox, Kerswill, & Torgersen, Reference Cheshire, Fox, Kerswill and Torgersen2011; Chun, Reference Chun2009; Eckert, Reference Eckert1989: 260; Hall-Lew, Reference Hall-Lew2009; Labov, Reference Labov1963:307, Laferriere, Reference Laferriere1979:607; Newman, Reference Newman2010; Prince, Reference Prince Ellen1988:516; Urcioli, Reference Urcioli1991:307; Zentella, Reference Zentella1997:175). Indeed, in our own and other research, originally exogenous traits are identifiable even among third-generation speakers (Guzzo, Reference Guzzo2009; Hall-Lew & Starr, Reference Hall-Lew and Starr2010; Penfield & Ornstein-Galicia, Reference Penfield and Ornstein-Galicia1985). An innately scripted exclusion of non-native speakers from dialect acquisition does not easily accommodate this extensive evidence of their systematic and long-term linguistic impact through dense ties of friendship and kinship across the nativeness boundary. As Sankoff (Reference Sankoff, Chambers, Trudgill and Schilling-Estes2002: 645–646) observes, although “immigrant language influences tended to disappear in subsequent generations . . . exceptions tend to be cases in which the immigrant group and its descendants have become a local majority population.”
One may counter that the Ethan Experience does not apply in situations that involve a community of non-native speakers, or where non-native features are accorded covert or overt prestige. However, that reduces the Ethan Experience simply to a claim about nonacquisition of parental features when the parent is an isolated speaker of that type, an outcome that surely applies equally to nonacquisition of traits from an isolated native speaker parent, for example, a Scots speaker whose children grow up in London. All such cases can be accommodated by existing accounts of children's social sensitivity to the frequency, social distribution, and local indexical value of a given feature, without any basis for an innate non-native filter.
An alternative hypothesis to the Ethan Experience would accommodate social influences in dialect acquisition by children of non-native speakers. Even under this view, however, a cognitive component may be hypothesized, namely that even if foreign features are retained, their use will be phonetically or socially reallocated (Britain, Reference Britain2002; Trudgill, Reference Trudgill1986) among all local-born groups, due to a need to integrate non-native usage into a local native grammar or social system. Empirical research that builds on Chambers (Reference Chambers2002) has tended to take this weaker view. Labov (Reference Labov, Meyerhoff and Nagy2008:317) observes that although a caregiver effect is found for native speakers, “no such effect of parents' non-native language has so far been recorded.” He argues that the influence of ethnicity in subsequent generations in immigrant communities in the United States does not involve direct replication of parent systems but rather oblique effects such as hypercorrect avoidance of parents' patterns. In a detailed analysis of the Italian and Chinese communities in Toronto, Hoffman and Walker (Reference Hoffman and Walker2010) propose that substrate effects are visible in the first generations, but that subsequent generations largely conform to “a shared native-speaker linguistic system” (p. 58). They conclude that continued ethnolectal differences primarily take the form of superficial differences in rate of use of local variants rather than deeper differences in linguistic conditioning, indicating an identity function rather than imperfect acquisition or transfer. Labov and Hoffman and Walker thus follow Chambers but take a slightly weaker position, allowing for the retention of indirect social effects but treating the “native speaker” grammatical systems of local-born generations as distinct from parent systems.
The strong and weak hypotheses outlined are both treated as “cognitive” here because both place the locus of (socio-)linguistic change at the point of transition from non-nativeness to nativeness, a cognitive contrast associated with distinct brain functioning (Ullman, Reference Ullman2001). Even if the strong version is rejected as too asocial, the weak version is widely implicit in the treatment of differences between child (native) and adult (non-native) acquisition as central in the study of language variation and change (Kerswill, Reference Kerswill1996; Labov, Reference Labov2007; Trudgill, Reference Trudgill2004). Both versions of the hypothesis are thus worthy of closer investigation.
Finally, we must entertain the possibility that nativeness plays little part in the retention of foreign traits in such communities, and that the rate and direction of shift to the local dialect corresponds as much to changes in network, demographic, and intergroup forces as in monolingual communities.
These three hypotheses may be summarized as follows:
Hypothesis I (cognitive, strong version):
Native English-speaking children do not retain parents' non-native traits.
Hypothesis II (cognitive, weak version):
Native English-speaking children may retain parents' non-native traits but will reallocate them to new linguistic or social functions.
Hypothesis III (social):
Whether native English-speaking children reallocate parents' non-native traits depends on social factors, not nativeness.
If Hypothesis I is true, we should find that British-born Asians filter out Punjabi-derived traits entirely, starting with the earliest British-born group. If Hypothesis II is true, we should find that even if traits are retained among British-born groups, the linguistic or social function of these traits will be reallocated by the earliest British-born group. If Hypothesis III is true, nativeness will not be as important a boundary for dialect change as periods of demographic or sociopolitical change.
Previous findings for British Asian English
A number of recent studies of British Asian speech have found retention and adaptation of Asian traits among younger Gen 2 speakers. Evans et al. (Reference Evans, Mistry, Moreiras, Trouvain and Barry2007) compared non-native (Gen 1) and native (Gen 2) English-speaking Gujaratis in London and found that the vowel systems of Gen 1 parents were distinct from those of Gen 2 individuals, who paralleled the vowel systems of Standard Southern British English speakers. Heselwood and McChrystal (Reference Heselwood and McChrystal2000) found retroflex/postalveolar articulation to be perceptible in the speech of bilingual British Asian children as compared to British monolingual children, with greater use among boys. Hirson and Sohail (Reference Hirson, Sohail, Trouvain and Barry2007) also claimed a gender difference in quality of rhoticity, with men in an Asian-identified group showing more Punjabi-like articulations than women. Khan (Reference Khan2003) found that a British Pakistani adolescent group in Birmingham with very ethnically homogeneous networks retained use of Asian features and, as in the two previous studies cited, this was particularly true for male participants. Alam (Reference Alam2007) and Alam & Stuart-Smith (forthcoming), investigating young British Asian girls in Glasgow, found that continued use of postalveolar variants in their speech corresponded to community of practice. Finally, Lambert et al. (Reference Lambert, Alam and Stuart-Smith2007:1512), looking at young Gen 2 Glasgow Asians, also found postalveolar articulation and greater ejective force with /t/. They claim that reallocation has occurred in the Gen 2 group: “It seems that certain features originally derived from language interference are now being actively deployed as English accent features by second and later generation speakers, though with rather different realizations and distributions from those expected in the original language.”
Although these studies make no explicit claims regarding the cognitive factor of nativeness, a natural interpretation of this substantial set of results would be in line with Hypothesis II, namely that differences in use arise between India-born (Gen 1, non-native, parent) and British-born (Gen 2, native, offspring) individuals. However, all of these studies exclusively sampled younger Gen 2 speakers, with ages ranging from 10 (Heselwood & McChrystal, Reference Heselwood and McChrystal2000) to 27 (Evans et al., Reference Evans, Mistry, Moreiras, Trouvain and Barry2007) years. As some British Asian communities have been established for well over 60 years, an entire generation of older British-born individuals is overlooked by this age range, leading to an incomplete picture of stages of dialect shift. Intermediate stages are crucial for determining whether cognitive or social factors drive dialect shift. In order to know whether loss or reallocation of traits happens immediately, that is, among the earliest British-born Asians because of their cognitive status as native English speakers, or incrementally over time due to social transformation in the community, we need to compare at least three groups: non-native Gen 1 speakers, the oldest Gen 2 speakers (age 35–60 years), and younger Gen 2 speakers (age 18–35 years).
FIELD SITE
At approximately 4% of the total population of the United Kingdom, South Asians represent the country's largest ethnic minority: 35% live in London (12% of the city's total population), with a major concentration in the West London boroughs of Ealing and Hounslow (both 25% South Asian). The small West London town in which data were collected for this study is Southall, in Ealing. In the mid-20th century, Southall was established as the hub of the West London Asian community, attracting Punjabi speakers from India, Pakistan, and East Africa, a pattern of migration that has continued to this day.Footnote 3 Southall is still considered the historic heart of the Punjabi community, and today census estimates indicate that, out of a total population of approximately 70,000, 75% of Southall residents are of minority ethnic origin and at least 55% of South Asian heritage. Taking into account undocumented residents and a decade since official census figures, it is reasonable to estimate that the Asian population exceeds 60% and the overall ethnic minority proportion exceeds 80% (Census, Reference Census2001; DMAG, 2006; Ealing JSNA, 2010).
The population of Southall includes both India-born (Gen 1) and British-born (Gen 2 and Gen 3) residents. Members of the Gen 1 group were born in South Asia and migrated to the U.K. in adulthood; this group is continually renewed through ongoing migration. Due to their continuous arrival, the Gen 2 group—born in West London of India-born parents—has a very diverse age range. The earliest British-born are now in their 50s, even 60s, but children being born now to recent India-born migrants are also technically Gen 2 individuals. Southall has been established as an Asian community for long enough that a growing Gen 3 group exists as well. The data in this study include Gen 1, older Gen 2, and younger Gen 2 individuals.
Southall as a field site has the advantage of including multiple generations and a conscious cultural identity. A disadvantage is the potential for insularity, as individuals may have quite limited interaction with non-Asians. However, we used this to obtain a wide range of network types, from highly insular Asian networks to largely non-Asian networks, permitting a consideration of the role of community integration in an individual's dialect acquisition.
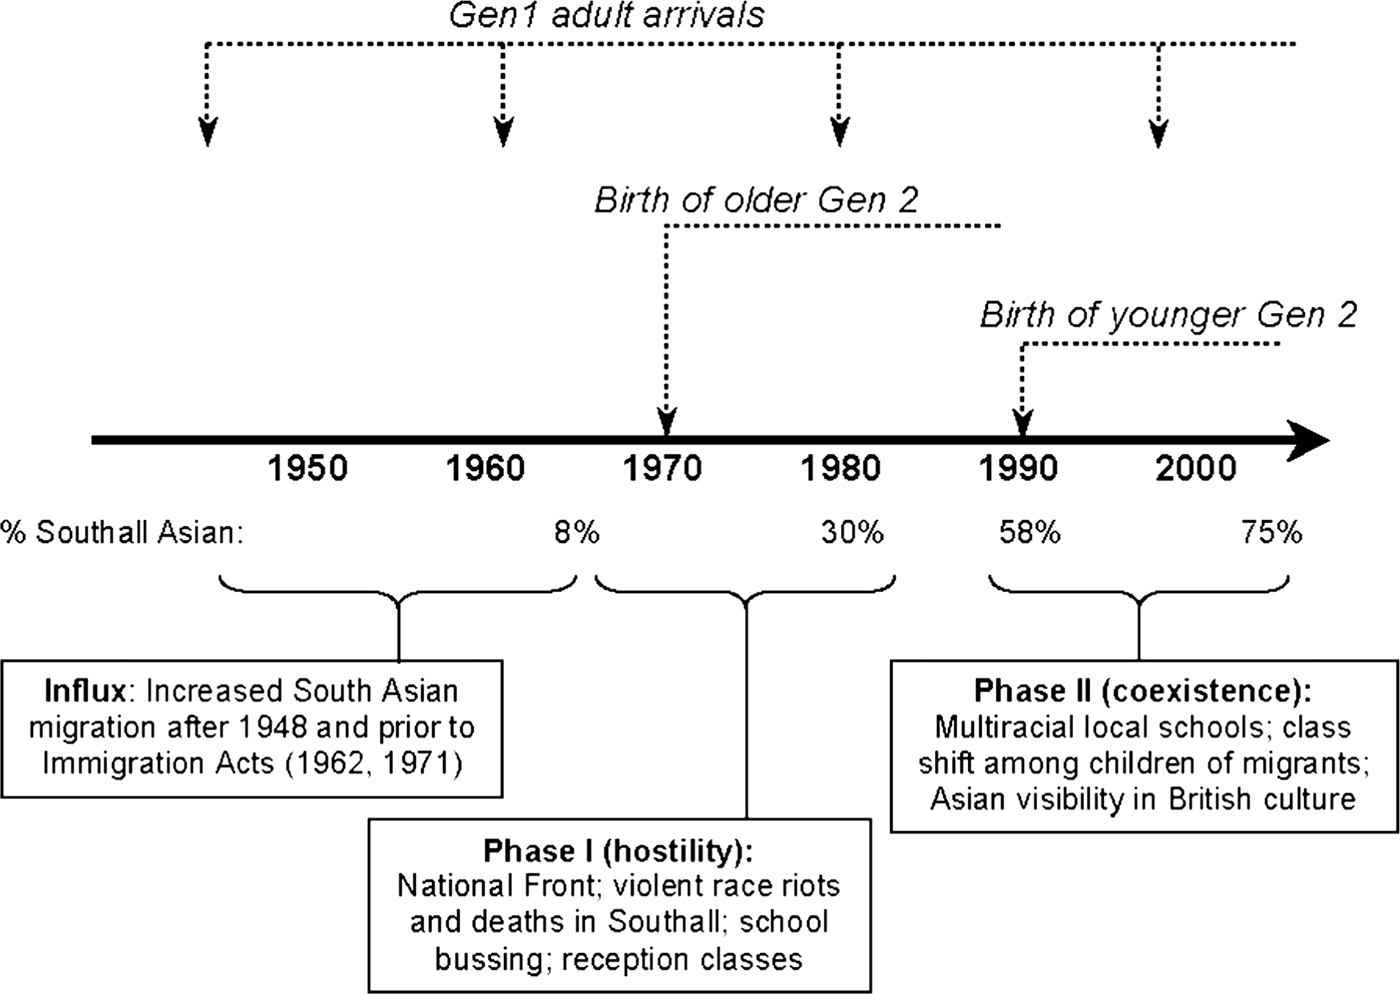
The recent history of Southall is central to our analysis of stages of dialect shift. Figure 1 outlines the most important elements: First, over the course of 60 years, South Asians have shifted from being a minority to a majority demographic group in Southall. Second, and not unrelated, race relations have gone from overt and violent hostility to cooperative coexistence. The older Gen 2 group in our study grew up during the first phase, and the younger Gen 2 group during the second. We argue that growing up during these very distinct historical phases partly explains distinct dialect acquisition trajectories in these two groups.
Demographic and sociopolitical changes over time in Southall.
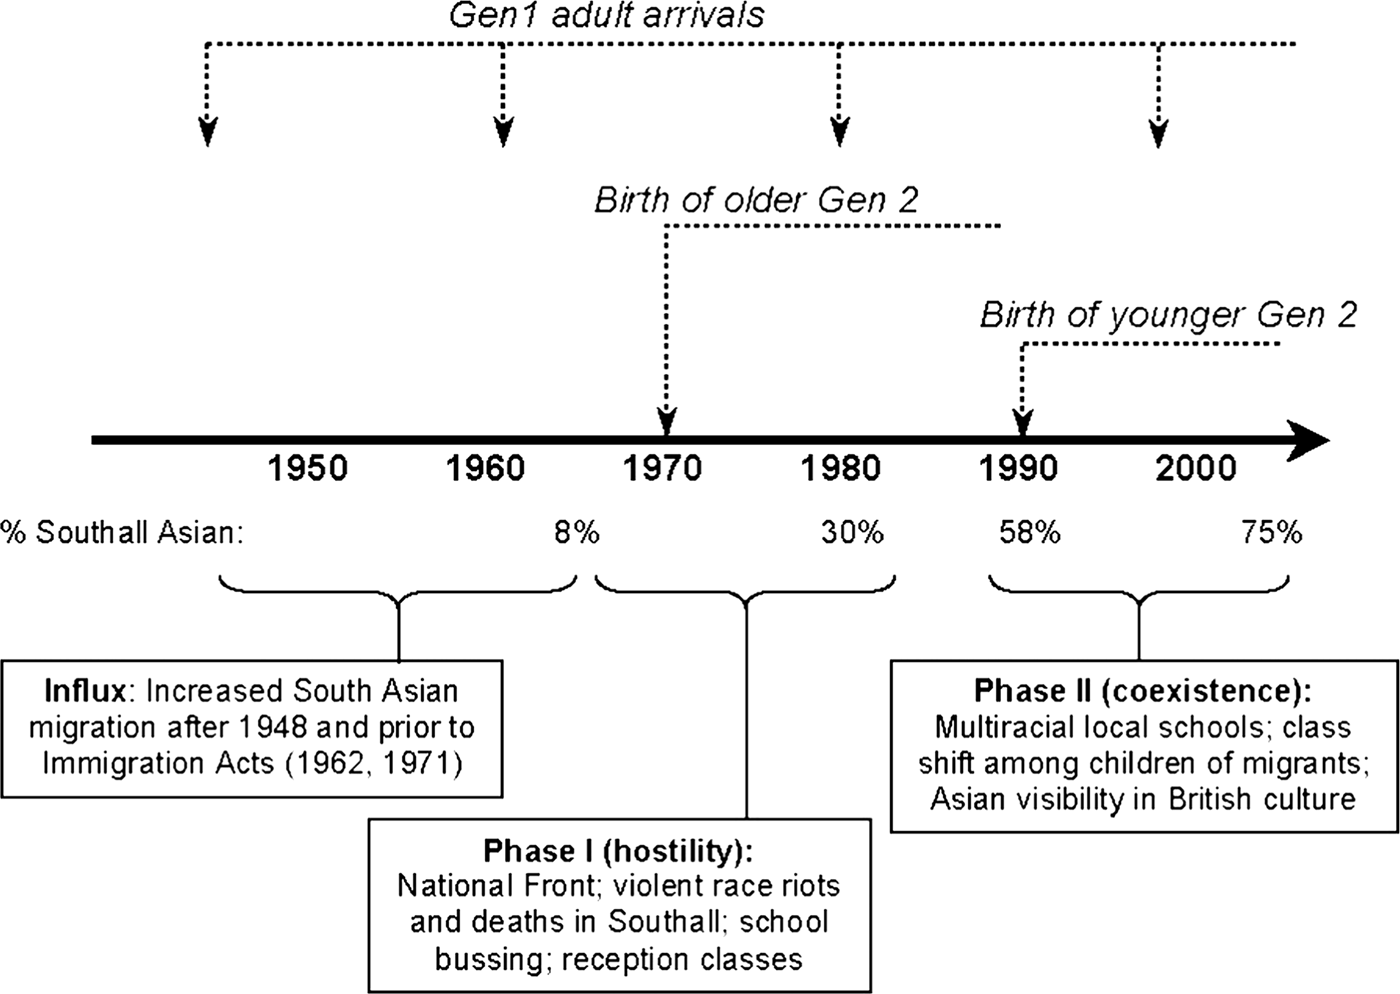
Phase I (late 1940s to late 1980s)
In the post-war period, the U.K. faced severe labor shortages and encouraged labor migration from former colonies. The British Nationality Act of 1948 converted former “British subjects” to “Commonwealth citizens” and permitted such citizens to enter the U.K. without restriction. The Asian population grew substantially between 1948 and 1971, before a series of immigration acts began to limit numbers. By this time, the economic climate had shifted (Oates, Reference Oates2002), and along with it British public opinion, embodied in Enoch Powell's infamous 1968 speech on Commonwealth immigration: “As I look ahead, I am filled with foreboding; like the Roman, I seem to see ‘the River Tiber foaming with much blood.’” (Powell, Reference Powell1969:289).
By the late 1970s, 30% of the population of Southall was Asian—still a minority but a large and highly visible one—and the town had become a lightning rod for racial tension (CARF, 1981:43; Oates, Reference Oates2002:107). Far-right, anti-immigration parties held rallies in the town, leading to violent riots and racially motivated deaths (CARF, 1981). British Asian antiracist political activism developed in response, combining Gen 1 and early (older) Gen 2 participants. School policies also reflected anxiety about shifting demographics, with bussing (Cashmore, Reference Cashmore1996:62) and remedial classes (CARF, 1981:37) for Asian heritage children. A British Asian Southall resident describes the conflicted sense of self that resulted:
I remember thinking when I was younger that maybe, somehow, my language—the language of my parents—isn't a real language. . . . All our history is from a British point of view. We're taught that Robert Clive was a hero and how the British introduced the railway and democracy to India . . . but we're never told how Indian industry was smashed and replaced by British industry . . . what they are saying all the time is that white is right. So we grow up with English nicknames and no self respect. (CARF, 1981:46)
Another British Asian resident reports, for the same period:
There were racial fights every day—even going through the corridors you were in danger of attack. The teachers would lock their rooms just to carry on teaching. They didn't want to get involved. Featherstone [School] was by then about 40% Asian, so the older kids there would come to Dormers Wells [School] to escort us, to be there at lunchtime and breaks. Outside the school the violence would continue and people would come out of their houses to support white kids. (CARF, 1981:47)
These experiences form an important collective history for older Gen 2 participants in our study. Many alluded repeatedly to these events, policies, and experiences in their interviews (quotes provided later in example (6)). We argue later that this shared history directly affected the type(s) of dialect acquired by older British Asians.
Phase II (late 1980s to present)
Although racial tension continued through the 1990s, the second phase of Asian history in Southall is characterized by a striking reduction of overt hostilities. As indicated in Figure 1, it is no coincidence that this change in race relations corresponds to a shift in Southall demographics, such that the Commonwealth heritage population, mostly South Asians, became the majority and the white community the minority (Meads, Reference Meads1983; Oates, Reference Oates2002:107). Southall schools became dramatically more multiracial, with the proportion of minority ethnic origin students in Ealing schools now ranging from 40% to 99% (Ealing JSNA, 2010:18). Today, many public signs in Southall are in English and Punjabi (even at the local pub) and the town's lively Punjabi atmosphere—bhangra music, Indian restaurants, clothing and jewellery shops—has become something of an institution in London. Children born and raised during the 1980s and 1990s were now growing up in a climate in which wider British society accepted an increasingly visible, legitimated, even celebrated, middle class British Asian culture, with mainstream comedians, musicians, TV presenters, and politicians (Herbert, Reference Herbert2009; Sharma, Reference Sharma, Kothari and Snell2011). In stark contrast to the older group, the younger Gen 2 participants in our data rarely offered any narratives of racial tension, but rather described experiences of being surrounded by an ethnically mixed, often Asian-dominant, peer group (quotes provided later in example (7)).
Awareness of local dialect style was relatively high among both younger and older British-born Asians in interviews. Both tended to recognize a distinct way of speaking in Southall, one individual referring to the style as “Southallian,” which incorporates elements of vernacular British English, Punjabi-influenced English, and Caribbean markers. As the analysis will show, however, Southallian is different for British-born individuals of different ages, shifting from bidialectal ability (in the older group) to a hybrid British style (in the younger group). We argue that this slow dialect transformation derives from the starkly different lived experiences of the two Gen 2 groups.
METHODOLOGY
Fieldwork and participants
Ethnographic fieldwork was conducted in the community by both authors over a period of 9 months. Participants were approached through a number of points of entry into the community, including local establishments (restaurants and shops), a local radio station, and friend-of-a-friend recommendations. The data collection for the wider project had two goals: to gain a representative stratified sample and to collect clusters of participants within individual families. Both researchers spent extensive periods in the neighborhood, participating in local events, spending time with contacts, and recording notes pertinent to a full understanding of emic cultural practices, such as the use of English and Punjabi locally, perceptions and articulations of social boundaries, and types of interaction among subgroups in town.
For the wider project, 74 participants were recorded; in most cases, each participant was recorded twice. The first recording was a sociolinguistic interview, lasting 1 to 2 hrs. The second recording was also an interview, but with the explicit goal of collecting detailed information on biography, network, bilingualism, and cultural preferences (e.g., music, TV, cinema, leisure activities); these recordings were 0.5 to 2 hrs long. A subset of participants conducted self-recordings in diverse speech situations in the absence of either researcher; these formed a crucial part of the wider analysis of dialect and social change in the community but are not examined in detail in this article (see Sharma, forthcoming). In total, approximately 120 hrs of data were collected.Footnote 4
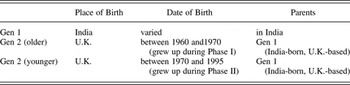
The present study reports on a subset of 42 participants, those whose recordings could be fully transcribed and coded and who did not have complicating biographical details, such as living in another region for a substantial time. Only speech data from the sociolinguistic interviews are analyzed here (40 hrs), with content from the second interviews used for coding social variables. The participants are analyzed according to the three demographic groups described in Table 1.
Demographic groups

Note: Exceptions: One older Gen1 man migrated from an Indian community in East Africa. Three older Gen 2 individuals were not born in the U.K. but migrated before the age of 10 years. One younger Gen 2 woman is strictly Gen 2.5 as one parent is British Asian.
The Gen 1 participants were born and raised in India and all had some experience speaking or studying English in India before migrating to the U.K. as adults. They are all classified as non-native; some are very regular users of English but all are bilinguals dominant in an Indian language. Non-native speakers can acquire local dialect features to a significant degree after adult migration—indeed we see evidence of such change in the present study—but it is extremely rare to acquire nativelike proficiency and there are no such cases in our data.
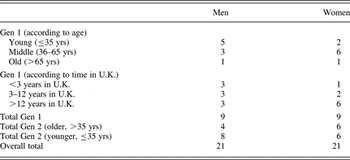
Table 2 shows the balance of participants included in the study. Further details of each social factor are provided later in this section.
Participants according to age, gender, generation, and time in the U.K.

Coding the dependent variable
The Punjabi and British features examined in this study are both variants of /t/. Retroflexion—a contrastive obstruent series in most Indic languages (Bhatia, Reference Bhatia1993)—is an articulation of consonants involving retraction of the tongue tip in the postalveolar region. Punjabi and Hindi have a contrast between retroflex and dental stops absent in British English, which only has an alveolar stop. Conversely, Punjabi and Hindi do not have an alveolar stop, and alveolar /t/ and /d/ are commonly replaced by retroflex variants in Indian English (Pingali, Reference Pingali2009).
In relation to Indo-Aryan articulation of retroflex stops, Masica (Reference Masica1993:94) observes that “the retroflex position /ʈ/ may involve retroflexion, or curling back of the tongue to make the contact with the underside of the tip, or merely retraction; the point of contact may be alveolar or postalveolar,” and that the distinctive quality arises “more from the shaping than the position of the tongue.” Heselwood and McChrystal (Reference Heselwood and McChrystal2000:57), citing further sources, also note variation in the place of articulation.
Given this variation in the source languages, and our exclusive reliance on auditory analysis in this paper, we included all variants within the range of postalveolar retraction beyond British alveolar /t/. Thus, we refer to “retroflex” and “ʈ” for simplicity of presentation, but this encompasses a range of retroflex and retracted forms. (Heselwood and McChrystal [2000] also grouped “retroflex/postalveolar” in their analysis; for important finer phonetic distinctions in British Asian retroflex and postalveolar stops, see Alam & Stuart-Smith, forthcoming; Kirkham, forthcoming; Lambert et al., Reference Lambert, Alam and Stuart-Smith2007.) As we note, these distinct articulations are almost certainly distributed differently across the generations, and, therefore, gradualness in change at the phonetic level is worthy of further investigation. The present study simply focuses on the retracted range associated with South Asianness; variation within the source languages, the examples discussed in (1), and perception experiments (Heselwood & McChrystal, Reference Heselwood and McChrystal2000; Lambert et al., Reference Lambert, Alam and Stuart-Smith2007) support this broad indexical meaning. In order to check the reliability of our auditory coding, 5% of the data were coded blind by both coders, resulting in an inter-rater reliability of 90%.
Retroflex /ʈ/ was selected for several reasons. First, it does not occur as a variant of /t/ in indigenous British English varieties and so is clearly an exogenous element in a British context, with a consistent indexical value linked to Asianness. This is slightly different to retroflex /ɖ/, which may be identifiable in certain British and Caribbean styles and thus may have marginally more complex sources and reasons for use.
Second, the feature is highly salient in the community (Alam, Reference Alam2007; Lambert et al., Reference Lambert, Alam and Stuart-Smith2007), which not only facilitates reliable auditory coding, but can also make a feature more readily adopted or discarded (Trudgill, Reference Trudgill1986). Retroflexion is one of the main elements of stylized Asian English (Chun, Reference Chun2007; Rampton, Reference Rampton1995); for instance, overuse of retroflex consonants characterizes the stereotyped speech of Apu, the Indian immigrant in The Simpsons. In several interviews, participants pointed to retroflexion as characteristic of either Indian English or Southall speech. One family referred repeatedly to “buɖ-buɖ,” an affectionately mocking term for Indian English that relies on a reduplicated retroflex as part of its enregisterment. The two quotes in (1) indicate this high level of awareness of retroflexion:
(1) Preeti (younger Gen 2 woman, age 23):
a. I hate it but I know I do [ɖ] and [ʈ] with my parents.
b. [contrasting her cousins' speech to her own speech]
The way I can describe it to you is that it's got that like I said to you [ɖ-ɖ-ɖ] sound in . . . for example say dog . . . they'll say [ɖ]og [ɖ]og like that you can SEE there's just a difference.
Third, the feature has been studied in previous work on British Asian communities, but only with respect to younger U.K.-born speakers. The present study adds to this picture by revealing a more complete range of stages of (and explanations for) dialect shift.
Finally, in two of the three positions we coded, retroflex [ʈ] varies with glottal stop [ʔ], permitting a simultaneous investigation of use of a vernacular British variant and an Asian variant.
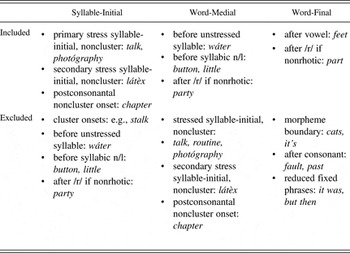
In this paper, we examine /t/-articulation in three positions: syllable-initial, word-medial, and word-final. A minimum of 50 instances (maximum 100, where possible) of /t/ were coded for each speaker in each of the 3 positions, so each speaker was coded for 150 to 300 tokens. No more than 5 tokens per type were coded. The variants for syllable-initial /t/ were [t] and [ʈ]. There were five variants word-medially and word-finally: [t], [ʈ], [d], Ø, [ʔ].
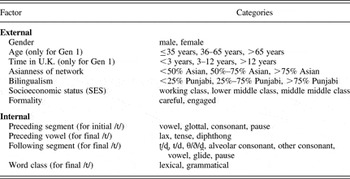
Table 3 lists the coding criteria used for each context. Choice of coding criteria related partly to previous descriptions of typical contexts favoring and disfavoring glottalization (Harris & Kaye, Reference Harris and Kaye1990; Milroy et al., Reference Milroy, Milroy, Hartley and Walshaw1994). In conforming to these contexts, we were able to include glottal stop as a variant for two of the three contexts. Table 4 lists the internal and external factors coded for the data, discussed in detail next.
Coding criteria for dependent variable

Coding criteria for internal and external factors

Coding internal factors
Table 4 shows that internal (linguistic) factors had to be coded differently for each context, due to different potential conditioning factors in different positions. In initial position, preceding segment was coded. In final position, preceding vowel, following segment, and word class were coded. Word class was included because stress and lexical frequency may conspire to produce more phonetic reduction in grammatical as opposed to lexical forms (Bybee, Reference Bybee2001); the category of “grammatical” included it, not, that, what, at, out, but, about, apart, and throughout. No internal factors were coded for word-medial position. Position in the word—listed in separate columns in Table 3—is technically a fourth internal factor in /t/ use when all three sets of /t/ data are grouped together, as in the present analysis.
Coding social factors
Gender was included as several studies of phonetic variation in British South Asian have found more markers of Asianness among men than women.
The age divisions adopted derived from life stage distinctions observed in the community, primarily contrasting unmarried participants, working participants with families, and retired participants. Age was included only for Gen 1, in case it corresponds to change in their dialect use. The two Gen 2 groups (>35 and ≤35 years) are separated by age, based on the earlier analysis of distinct phases of Southall's social history, so age is not included as a factor within each of those groups.
Time in the U.K. was also only relevant to Gen 1. As with age in Gen 1, the three distinctions broadly corresponded to our ethnographic observations of stages of migration. Up to 3 years into their stay in the U.K., many individuals still had a temporary, relatively unsettled status. Three to twelve years was often a period of stable employment and greater integration into the local community. More than 12 years broadly corresponded to commitments such as buying property or settling down with a family.
For the present study, the network measure only reports the average Asianness of each individual's network. The three levels derive from the skewing of the entire dataset toward highly Asian networks. For each participant, we collected an ordered list of close friends and relatives,Footnote 5 and for each named contact, we collected information on the frequency of interaction, domains of interaction (multiplexity), shared ties (density), dialect spoken by the contact, ethnicity of the contact, and a relative closeness ranking. In the network measure used here, we excluded named family members, as family constitutes a large proportion of most individuals' networks in this community, and these numbers would have considerably inflated the levels of network Asianness. Excluding family permits more focus on network ties developed and maintained out of personal choice.
Degree of bilingualism—that is, the amount of use of the source language, Punjabi, in an individual's daily repertoire—is an important potential factor in the use of foreign traits, though it has rarely been assessed quantitatively in variationist studies. Information was collected on bilingual language use from all participants using a 15-category scale of interlocutor type devised through ethnographic observation of locally relevant categories. Given important variation among interlocutors, even within the family, we based our coding on interlocutor and speech task (Gal, 1978) rather than simply domains of interaction (Blom & Gumperz, Reference Blom, Gumperz, Gumperz and Hymes1972). The categories examined were: grandparents, grandparents' generation, aunties (Asian term for acquaintances and relatives of parents' generation), mother, father, siblings, spouse, early life, friends, children, work, counting, writing, university, grandchildren. For each category, individuals were asked to estimate their proportion of Punjabi use in each setting as a percentage, and a continuous index (0%–100%) was produced based on the average of responses of all filled cells. For the present analysis, this continuous index was divided into the three categories listed in Table 4.Footnote 6
The community and the participants included here are predominantly lower middle class (Ealing JSNA, 2010: 11–21), but a segment were either working class or middle middle class. We initially calculated class using standardized indexes (Goldthorpe, Reference Goldthorpe2000; Hollingshead, Reference Hollingshead1975), which use a 3:5 weighted index of educational attainment and occupational prestige. However, this index showed a remarkably poor correspondence to our ethnographic knowledge of each individual's socioeconomic status (cf., Alford, Reference Alford1962, on the superiority of subjective measures over objective measures of class). One reason for this is that systematic change occurs within individual lifetimes (Platt, Reference Platt2005). For instance, when migrants arrive in the U.K., they almost always experience a drop in status, resulting in a complex self-perception, for example, incorporating both high status in their village and low status in the host country. Conversely, their own children frequently experience rapid social mobility, and often children's life paths differed radically from their parents' occupational class. Another reason for the failure of standardized measures was their inability to accommodate ethnographic detail. For instance, women in the community suffered greater drops in status than men after divorce. We therefore coded three levels of socioeconomic status using standard measures of education, employment, and housing combined with ethnographic knowledge of an individual's life trajectory and community position.
Finally, two formality distinctions were drawn: engaged and careful interview speech. If fundamental to the individual's dialect (an indicator), the form is unlikely to vary with formality, whereas if it is sensitive to the contact situation (a marker), it is likely to vary. Careful interview segments were identified based on the following properties: occurring within the first 10 mins of the interview; non-narrative speech involving relatively dispassionate opinions; topics including English skills/education, school, and work; high register lexicon; narrower pitch range; consistent speech rate; uncontracted forms; relatively unreduced forms. Engaged segments were identified through properties such as: occurring later in the interview; narrative speech; topics such as friendships, fights, gossip, ghost stories; slang and low register lexicon; emotional involvement; greater pitch range; variable speech rate; laughter; swearing, contracted forms; and more phonetic reduction. Ambiguous interview segments were not coded.Footnote 7
RESULTS
A multivariate analysis was conducted for retroflex /ʈ/ in each of the three demographic groups—Gen 1, older Gen 2, and younger Gen 2. Use of glottal stop /ʔ/ is discussed more briefly after these results.
Hypothesis I
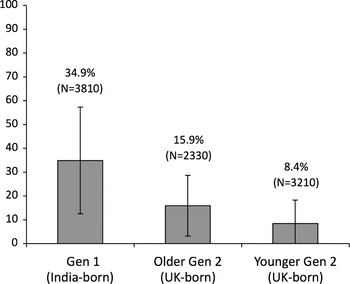
The overall use of [ʈ] by the three groups is given in Figure 2. In the India-born Gen 1 group, /t/ is realized as [ʈ] approximately 35% of the time. Given this relatively low base rate in the migrant group, it is striking that the two subsequent groups of British Asians—older Gen 2 and younger Gen 2—sustain rates of 16% and 8.4% use of retroflex/retracted variants. Although in each case, the overall use of [ʈ] has halved, it has by no means disappeared.
Rates of retroflex /ʈ/ across three groups.

This initial result confirms earlier claims of retention of a range of postalveolar articulations among U.K.-born individuals and contradicts Hypothesis I, the strong interpretation of Chambers's innate filter on non-native accent features.
Hypotheses II and III
In order to examine Hypothesis II—the weak version of a cognitive effect, namely that features may be retained but will be immediately reallocated by native English-speakers—we turn to the internal and external factors affecting use of /ʈ/. Internal factors can indicate whether /ʈ/ gains new grammatical conditioning in Gen 2 use (structural reallocation). External factors can indicate whether /ʈ/ gains new social functions in Gen 2 use (social reallocation).
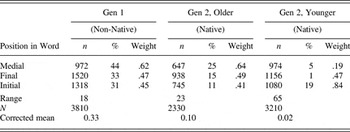
First, to assess whether structural reallocation has occurred at the nativeness boundary, that is, at the transition from the Gen 1 group to the Gen 2 groups, Table 5 presents the multivariate values for the one internal factor—position in word—for all three groups.Footnote 8
Weights for internal factor in three independent analyses for three groups' use of retroflex /ʈ/

Table 5 shows a striking resemblance between the internal conditioning of /ʈ/ in the non-native group and the older native (U.K.-born) group. Both of these groups marginally favor word-medial retroflexion. By contrast, the younger Gen 2 group shows a completely different pattern, with an overwhelming favoring of /ʈ/ in initial position and disfavoring in medial position.
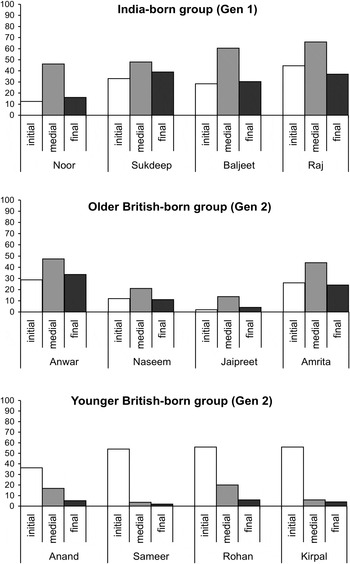
The sample distributions for individual speakers in Figure 3 indicate a high level of internal consistency in each group—the India-born Gen 1 and older Gen 2 speakers conforming to one pattern, despite variable rates, and the younger Gen 2 group to another.
Position of retroflex /ʈ/ across sample individuals from three groups.

Table 5 also introduces an important complication to the overall decline in Figure 2. Although the younger Gen 2 group use /ʈ/ less frequently (Figure 2), Table 5 indicates that they reserve their retroflexion for a highly salient, word-initial locus. It is possible that this change relates to the widespread use of glottal stops in medial and final positions by younger speakers; however, the analysis later will show that the older Gen 2 group also have high use of glottal stops in these contexts, yet do not resemble the younger group in terms of contextual conditioning of retroflexion.
Furthermore, although beyond the scope of this paper, the form used by younger Gen 2 speakers may have also gained rather than lost salience. Although often postalveolar rather than retroflex, their variants often appear to have a more fortis quality than those of Gen 1 speakers, some of whom explicitly try to turn down the salient Asianness of their speech (see example (2) later). Lambert et al. (Reference Lambert, Alam and Stuart-Smith2007) noted the development of a distinctive phonetic quality in their Gen 2 group that is comparable to our younger group. Thus, for the younger Gen 2 group, a decrease in quantity of /ʈ/ use may coincide with an increase in qualitative salience, positionally and acoustically (cf. Podesva, Reference Podesva2007). This suggests that, rather than a simple “fading out” in use of /ʈ/, a new variant may be developing in this group.
Further support for this delayed restructuring is found in the effect of other internal factors. When use of /ʈ/ was examined separately for the three word positions, older Gen 2 speakers again consistently grouped with the Gen 1 group, and younger Gen 2 speakers followed a separate pattern. For instance, the Gen 1 and older Gen 2 groups showed a significant effect of following segment on final /ʈ/ use (place assimilation), a factor that was not significant for the younger Gen 2 group, possibly due to their high use of glottaling in final environments. Similarly, the Gen 1 and the older Gen 2 groups showed no significant effect of preceding segment on initial /ʈ/, but the younger Gen 2 group did (preceding vowel favored; preceding pause disfavored).
In sum, the structural reallocation component of Hypothesis II is not supported, as all internal factors indicate that nativeness is not the boundary at which structural reallocation occurs for this feature. Reallocation is more apparent in the younger Gen 2, one whole generation after native English-speaking British Asians first appear in the community. Note that, although instrumental analysis is not presented here, the older Gen 2 group appears to use a very wide phonetic range, encompassing retroflex as well as postalveolar variants. This suggests the possibility that change at the phonetic level may also be gradual, with the older Gen 2 as a complex transitional group. Subphonemic analysis would be needed to establish whether this transitional status takes the form of intra- or inter-individual variation or both.
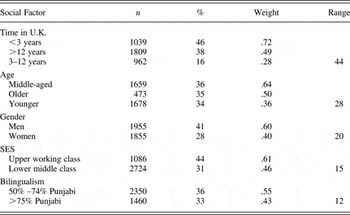
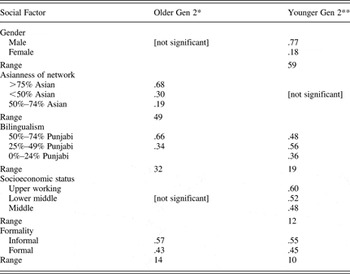
What about the social reallocation prediction of Hypothesis II? Tables 6 and 7 present results for social factors in the use of retroflex /ʈ/ in the three groups.
Weights for external factors for Gen 1 (India-born) use of retroflex /ʈ/

Note: Not significant: Asianness of network, formality.
N = 3810
Corrected mean: 0.33
Log likelihood: –2190.398
Weights for external factors for older and younger Gen 2 use of retroflex /ʈ/

Note: *N = 2330, Corrected mean: 0.10, Log likelihood: –646.249; **N = 3210, Corrected mean: 0.02, Log likelihood: –656.948
First, as a reference point for later developments in the community, Table 6 lists the significant social correlates of /ʈ/ use among Gen 1.
The most significant factor is time in the U.K. India-born participants who have lived in the U.K. for 3–12 years show a sharp decline in use of /ʈ/. These individuals are often negotiating work situations with British English speakers and struggling to find a place in their new environment. Many explicitly express a desire to acquire a British style of speaking, and their disfavoring of /ʈ/ seems clearly related to a change of status of /ʈ/ from indicator to marker following contact with a new dialect:
(2) Mala (3–12 year resident, Gen 1 woman, age 27 years, talking about her Gen 2 husband):
He encouraged me to speak more like like bri[t]ish accent he said don't [tʰ]alk like pehndus. [‘villagers’ in Punjabi; pronounced with a British accent]
The lack of change during a <3-year period of stay may relate to an absence of long-term settlement plans; such individuals showed a marked retention of distinctive Indian accents. However, Drummond (Reference Drummond2010) found a strikingly similar 3-year lag in the onset of change among Polish migrants in the U.K., so a cognitive or learning delay may also be involved. Intriguingly, /ʈ/ use increases again among the long-stay (>12 years) group. These individuals have often settled with families in very Asian networks and may have less need to accommodate to British English or may have regained confidence in their original variety. Importantly, this stabilization feeds into which variety British-born children encounter and engage with in home settings. The parent generation in such communities is frequently set aside as sociolinguistically irrelevant, “fossilized” non-native speakers, but in fact their recalibrations in usage actively set in motion the initial stages of resetting of social indexicalities.
Age, gender, and class show less influence. Somewhat unexpectedly, use of Punjabi is the weakest of the significant factors; in other words, those who speak more Punjabi are not necessarily the ones who have more /ʈ/ in their English. This lack of a strong effect of degree of bilingualism is true for all three groups. (See Kirkham [forthcoming] for a similar result for British Asian adolescents in Sheffield.)
To assess social reallocation, we compare Table 6 to Table 7, which lists the influence of social factors upon /ʈ/ use in the two Gen 2 groups, older and younger.Footnote 9 The factors of formality and bilingualism show a similar, mild effect in both Gen 2 groups, but the remaining factors are very different, as with the internal factors earlier.
In the older group, network ties are the strongest social factor, relating to direct integration into Indian networks such as the family business and transnational travel back to South Asia. In the younger group, by far the strongest social factor is gender (not strongly significant for Gen 1 and not at all significant for older Gen 2 speakers). Younger men very strongly favor the form and women very strongly disfavor it in interviews, confirming earlier generalizations (Heselwood & McChrystal, Reference Heselwood and McChrystal2000; Hirson & Sohail, Reference Hirson, Sohail, Trouvain and Barry2007; Khan Reference Khan2003). Meta-linguistic comments show explicit awareness of these gender differences, as in (3):
(3) Sameer (younger Gen 2 man, age 22 years):
Girls ain't really got like a Southall lingo. Some girls have but not most of them. They like sound posh or something.
The absence of retroflex /ʈ/ use among younger British Asian women in interviews suggests a new indexical association of masculinity. In fact, the picture is more complicated. Young women's self-recorded data showed surprisingly robust use of Punjabi traits at home, indicating not a loss of such forms but rather a sharper compartmentalization of styles across their speech repertoire than young men.Footnote 10 Home and parent contexts thus appear to play an important role here (cf. Al-Wer, Reference Al-Wer, Miller, Al-Wer, Caubet and Watson2007; Khattab, Reference Khattab, Bullock and Toribio2009; Stanford, Reference Stanford2008), a type of influence downplayed in peer-focused studies of Western communities and particularly in the Ethan Experience hypothesis. A full discussion of these gendered differences in repertoire are discussed in detail elsewhere (Sharma, forthcoming). For the present, the relevant detail is that a gender difference emerges in the younger Gen 2 group.
Taking the findings for internal and external factors together, we see strong evidence that it is the younger, not the older, Gen 2 group that substantially reallocates use of the Punjabi-derived trait of /ʈ/, structurally and socially. This mitigates against Hypothesis II and potentially favors Hypothesis III, as the change we see does not occur at the “nativeness” boundary between Gen 1 and the older Gen 2 group, but rather 20 years later within the “native” group, between the older and younger Gen 2 groups.
Nativeness and British variants
We might ask whether this striking lag of a whole U.K.-born generation before restructuring is established is caused by the older Gen 2 group simply not acquiring British English for some reason, such as insularity, and simply acquiring a variety of Indian English. This is not the case. All members of the older U.K.-born group show nativelike use of many British English variants. Rather, what we find is that many older Gen 2 men command nativelike grammatical competence in both Indian English and British English, that is, they represent a bidialectal phase. This is not a situation clearly accommodated by Hypothesis I, which sets up the acquisition problem as one of choosing between peer and parent dialects.
This type of complex competence, found exclusively among our older Gen 2 group, can be seen very clearly if we shift our attention briefly from the Punjabi trait to a salient British trait, namely /t/-glottaling.
Milroy et al. (Reference Milroy, Milroy, Hartley and Walshaw1994:329) offers the following two descriptions of glottal conditioning in native Southern varieties of British English:
1. “(non-stigmatized) glottalization in certain syllable-final environments (e.g. button, cutlet) is already an established characteristic of RP”
2. “glottal stops are preferred in pre-consonantal environments” reflecting “a well-established British norm”
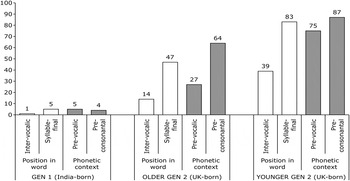
Figure 4 shows an undeniable conformity among both Gen 2 groups to both principles. Both groups favor word-final over intervocalic glottaling and, within word-final contexts, preconsonantal over prevocalic environments. The only difference is that the older U.K.-born group has lower rates of glottaling than the younger group overall, but even this conforms to a generational rise in glottaling in Southern British speech. By contrast, the India-born group have almost no glottaling and no British-type conditioning.
Percentage /t/ glottaling by group. India-born n = 2272; older U.K.-born n = 1454; younger U.K.-born n = 1994.

This finding supports the widespread view that acquisition of the local dialect grammar corresponds to a native/non-native boundary. However, the Ethan Experience assumes a corollary that foreign dialect grammars are consequently not acquired. The analysis here shows that the acquisition of local and foreign dialect systems can be quite independent. The acquisition of fine Indian-style conditioning of /ʈ/ among the older U.K.-born group, seen earlier, does not correspond to a failure to acquire British English. A better description of this group is that their use of Indian variants (e.g., /ʈ/) closely resembles the India-born group, and their use of British variants (e.g., /ʔ/) closely resembles British-born groups. They possess competence in both varieties with little change.
Example (4) shows that the co-existence of the two systems is achieved through wholesale, “chameleonic” style alternations, sensitive to interlocutor among other factors. The IPA tokens in (4a) are all Indian English variants that closely mirror the India-born Gen 1 style. These include ð →  , θ →
 ʰ, t → ʈ or , d → ɖ, əʊ → o, eɪ → e, and p → pp (Pingali, Reference Pingali2009). The IPA tokens in (4b), produced by the same speaker, are all the British English counterparts to these variants, turned up dramatically in a different conversation. These include standard British articulations of ð, θ, d, t, t → ʔ, eɪ, əʊ, and ɫ.Footnote 11
(4) Anwar (older Gen 2 man, age 41 years):
a. Addressing Indian interviewer:
but [
 ] en one [ʈ]ime i- my father y'know god rest his s[o]l, he ha[ɖ] a philosophy, he goes to me ‘yaar one of [] ese days, [] is er foo[ɖ] is going to be[k]ome [ə] in[ɖ] ian- [ə] u.[ke] national [ɖ] ish’ and look wha[ʈ] ha[pp]ene[ɖ]
b. Addressing white sales representative over the phone (researcher absent):
the difficult [tʰ]wo pieces we've bough[ʔ] [ð]em already we've go[ʔ] [ð]em but [ði]- [ðə] m[eɪ]n screen is some[θ]ing [ð]a[ʔ] is no[ʔ] just off the she[ɫ]f i[t] has to be m[eɪ]de and because I was [tʰ]o[ɫ]d by national windscreen [ð]a[ʔ]- [ð]at you guys cu[ʔ] your [əʊ]wn and m[eɪ]ke your [əʊ]wn screens it's something [ð]a[ʔ] you- you'd be [eɪ]ble to er assis[t] us wi[ð]
By the time we reach the younger Gen 2, we see a less complex competence. These individuals parallel British English grammatical detail much more closely than Indian English. Only a few Punjabi traits are scattered sparsely—though very saliently—in otherwise British-sounding English. The extract in (5) shows this style, in which almost all tokens are British variants with only a few emblematic retroflex or retracted tokens indicated, often syllable-initially.
(5) Anand (British-born, 23 years, male):
aw they're very traditional they're very um [ʈʰ]ight knit communi[ʈʰ]ies and they're you know they're quite mili[ʈ]ant perhaps. the guys and the sikhs with [ʈʰ]urbans
DISCUSSION
One of the reasons for a lack of clarity in the dynamics of transmission of foreign traits is the relative dearth of studies that investigate the adult migrant Gen 1 group alongside multiple Gen 2 groups over a substantial period of time. The present study has compared Gen 1 speakers to earlier-born and later-born Gen 2 speakers in order to track the acquisition of exogenous and local dialect traits.
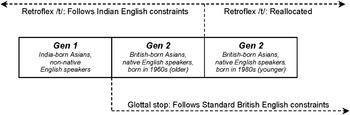
Figure 5 summarizes the results. In their use of exogenous Punjabi retroflexion, the oldest native English-speaking (Gen 2) group closely follows the phonetic conditioning of the non-native community, failing to support a sharp nativeness boundary. Systematic reallocation in the use of this feature becomes apparent only 20 years later, among younger British-born individuals. By contrast, support for a sharp nativeness divide is found in the use of glottal stops, for which both Gen 2 groups have typically British contextual conditioning. Crucially, this nativelike usage does not determine the use of foreign features in these groups. The older Gen 2 group plays a Janus-like role, mirroring the users of both the dialect systems in contact.
Acquisition of foreign and local dialect traits over time.

Returning to the historical context in Figure 1, we can speculate as to why the use of foreign traits is retained and subject to such gradual change. Recall that Figure 1 showed a major demographic shift in Southall from minority to majority Asian over five decades, with an accompanying shift in race relations. The quotes in (6) and (7), from older and younger Gen 2 residents, respectively, show the dramatically different lived experiences of growing up in Southall that resulted in the community.
(6)
a. Sharan (older Gen 2 man, age 37 years):
There was big riots at my school between asians and english kids.
b. Anwar (older Gen 2 man, age 41 years):
We had extreme tensions. . . . They would hurl abuse at you and . . . even you know like even spit at you. But um because we— you know we had our pride. There was absolutely no way we were going to be abused like this.
c. Naseem (older Gen 2 man, age 48 years):
We had to be very very careful I still remember those days it was quite frightening. . . . We used to be bussed. . . . When I went to brentside I used to go by [bus] 207 then so then that was quite difficult traveling when you're about twelve thirteen. . . . You'd be scared to get picked on you know. . . . We did feel intimidated. . . . It's changed now due to race relations laws and everything. It's changed now a hell of a lot.
(7)
a. Ravinder (younger Gen 2 man, age 19 years)
Devyani: Have you ever had like an experience of racism?
Ravinder: No. No. No. (unintelligible)
Devyani: Not at all?
Ravinder: No.
b. Sameer (younger Gen 2 man, age 22 years)
It wasn't about racism nothing like that cos everyone knew each other in school. . . . It was mainly indians like asian community and um somalians mostly and couple of like um like jamaican but british whites there was only like one or two most probably.
For the older group, surviving at school and in public involved an ability to downplay Indianness and to pass as British. This could be achieved both by acquiring nativelike use of British variants and possibly by beginning to “weaken” Asian variants phonetically, for instance, by favoring postalveolar variants. However, social survival also meant deep ties to their Asian world. Many went into their fathers' businesses and had direct transnational ties with family in India, conduits for the acquisition of Indian retroflexion and other forms. For this group, therefore, very strong and very distinct incentives existed for signaling authentic membership in both British and Indian groups, in different settings.
The younger group had far less regular direct contact with India, and by the time they were growing up, there was a local British Asian community to orient to. Fewer direct ties account for their lack of fluent bidialectal ability in Indian English, and the lack of physical threat, hostility, or even substantial contact with non-Asians, reduced the need to pass as “purely” British as well. Both factors encouraged the use of occasional emblematic markers of Punjabiness integrated into British English, clearly distinct in form and function from what they see as “freshie” Indian English. For them, their primary affiliation is their local British Asian peer group, and a focused, Punjabi-inflected British English speech style suits this target well.
Crucially, the younger Gen 2 group's modified retentions of foreign traits identified in previous work (Evans et al., Reference Evans, Mistry, Moreiras, Trouvain and Barry2007; Harris, Reference Harris2006; Heselwood & McChrystal, Reference Heselwood and McChrystal2000; Hirson & Sohail, Reference Hirson, Sohail, Trouvain and Barry2007; Khan, Reference Khan2003; Lambert et al., Reference Lambert, Alam and Stuart-Smith2007; Stuart-Smith, Timmins & Alam Reference Stuart-Smith, Timmins, Alam, Gregersen, Parrott and Quist2011), described in related work as “Brasian” (Harris, Reference Harris2006) or “Glaswasian” (Stuart-Smith et al., Reference Stuart-Smith, Timmins, Alam, Gregersen, Parrott and Quist2011), did not develop immediately. The shift to markerlike awareness happens early—among India-born migrants themselves—but systematic structural and social reallocation shows considerable lag in this community, focusing toward a new norm only two generations later. Although this article has only focused on one exogenous trait, numerous other Punjabi features such as monophthongization and replacement of interdental fricatives show comparable trajectories of gradual change (see example (4)).
The findings cast doubt on narrowly cognitive explanations for the presence or absence of foreign traits, based in constructs such as an innate foreign-accent filter (Hypothesis I) or native speaker status (Hypothesis II). Stages of hybrid dialect acquisition among local-born individuals in the present study correspond much more closely to the social factors of demographic balance, time depth, and community relations (Hypothesis III).Footnote 12 The contrast between the present findings and those of Labov (Reference Labov2007) and Hoffman and Walker (Reference Hoffman and Walker2010) raises the interesting possibility that immigrant communities in North America may exhibit more rapid assimilation to local native linguistic systems than those in Britain, or perhaps Europe.
Our results bear a striking abstract resemblance to Trudgill's (2004) analysis of new-dialect formation in New Zealand, in which he argued that a focused variety only emerged at Stage III and “it is actually the second generation of children who do the generating” (original italics; p. 27). The gradualism in our study is also reminiscent of revisions of “abrupt creolization” and child Universal Grammar as a cognitive driving force in creole formation (Bickerton, Reference Bickerton1984). Roberts (Reference Roberts and McWhorter2000; see also Singler, Reference Singler2006) has argued persuasively, using incremental historical evidence, that Hawaiian Creole was not formed in a single generation through the transformation of a pidgin into a creole by the first native-speaker children; rather, the Creole system found today developed over several generations in correspondence to moments of heightened demographic density of adolescents from particular ethnic groups over time.
More broadly, this study has shown that intergenerational transmission in immigrant communities can be of central importance to understanding the dynamics of dialect contact and change. Such communities link the two core processes described by Labov (Reference Labov2007), namely diffusion (adult acquisition) and transmission (child acquisition). As a situation involving intensely competing social pressures at different sociohistorical stages, the present case study has shown how social and cognitive forces interact to give rise to incremental stages of acquisition and change and has identified an intermediate generation characterized by multilectal participation in the distinct communities in contact.