

Introduction
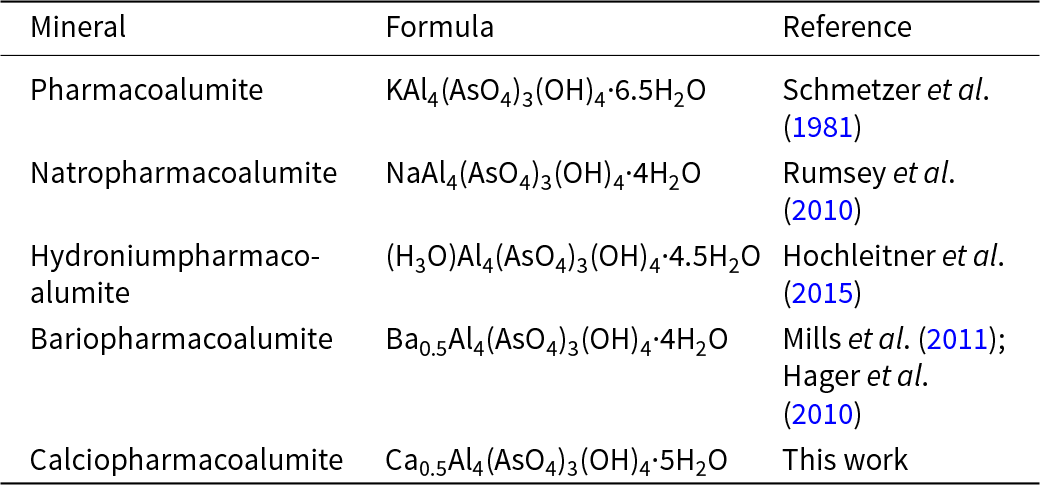
A new mineral calciopharmacoalumite was discovered as a result of our systematic study of the arsenic mineralization at the Obdilya gold deposit (40°08’27.6432”N and 72°05’15.7344”E) located within the Chauvai ore field, Kyrgyzstan. The pharmacosiderite supergroup with a generalized formula of AB 4[(OH)4(TO4)3]·nH2O consists of pharmacosiderite, pharmacoalumite and ivanyukite groups (Rumsey et al., Reference Rumsey, Mills and Spratt2010). Calciopharmacoalumite is the fifth representative of the pharmacoalumite group (Table 1). Calciopharmacoalumite is named by analogy with Ba-, Sr-, H3O-, Na-, Cs-, Pb- and Tl-dominant members of the supergroup (e.g. bariopharmacoalumite, hydroniumpharmacoalumite and natropharmacoalumite). Both the mineral, the mineral name, and the mineral symbol Cpal were approved by the Commission on New Minerals, Nomenclature and Classification of the International Mineralogical Association (proposal 2021-085). Type material is deposited at the Fersman Mineralogical Museum of the Russian Academy of Sciences, Moscow, Russia (catalogue no. 98566 and 98567).
Minerals of the pharmacoalumite group

Table 1 Long description
Columns are labeled Mineral, Formula, and Reference. Rows list Pharmacoalumite with a potassium and aluminum arsenate hydroxide hydrate formula and reference Schmetzer et al. 1981. Natropharmacoalumite lists a sodium and aluminum arsenate hydroxide hydrate formula and reference Rumsey et al. 2010. Hydroniumpharmacoalumite lists a hydronium and aluminum arsenate hydroxide hydrate formula and reference Hochleitner et al. 2015. Bariopharmacoalumite lists a barium and aluminum arsenate hydroxide hydrate formula and two references, Mills et al. 2011 and Hager et al. 2010. Calciopharmacoalumite lists a calcium and aluminum arsenate hydroxide hydrate formula and the reference, This work.
Occurrence and mineral association
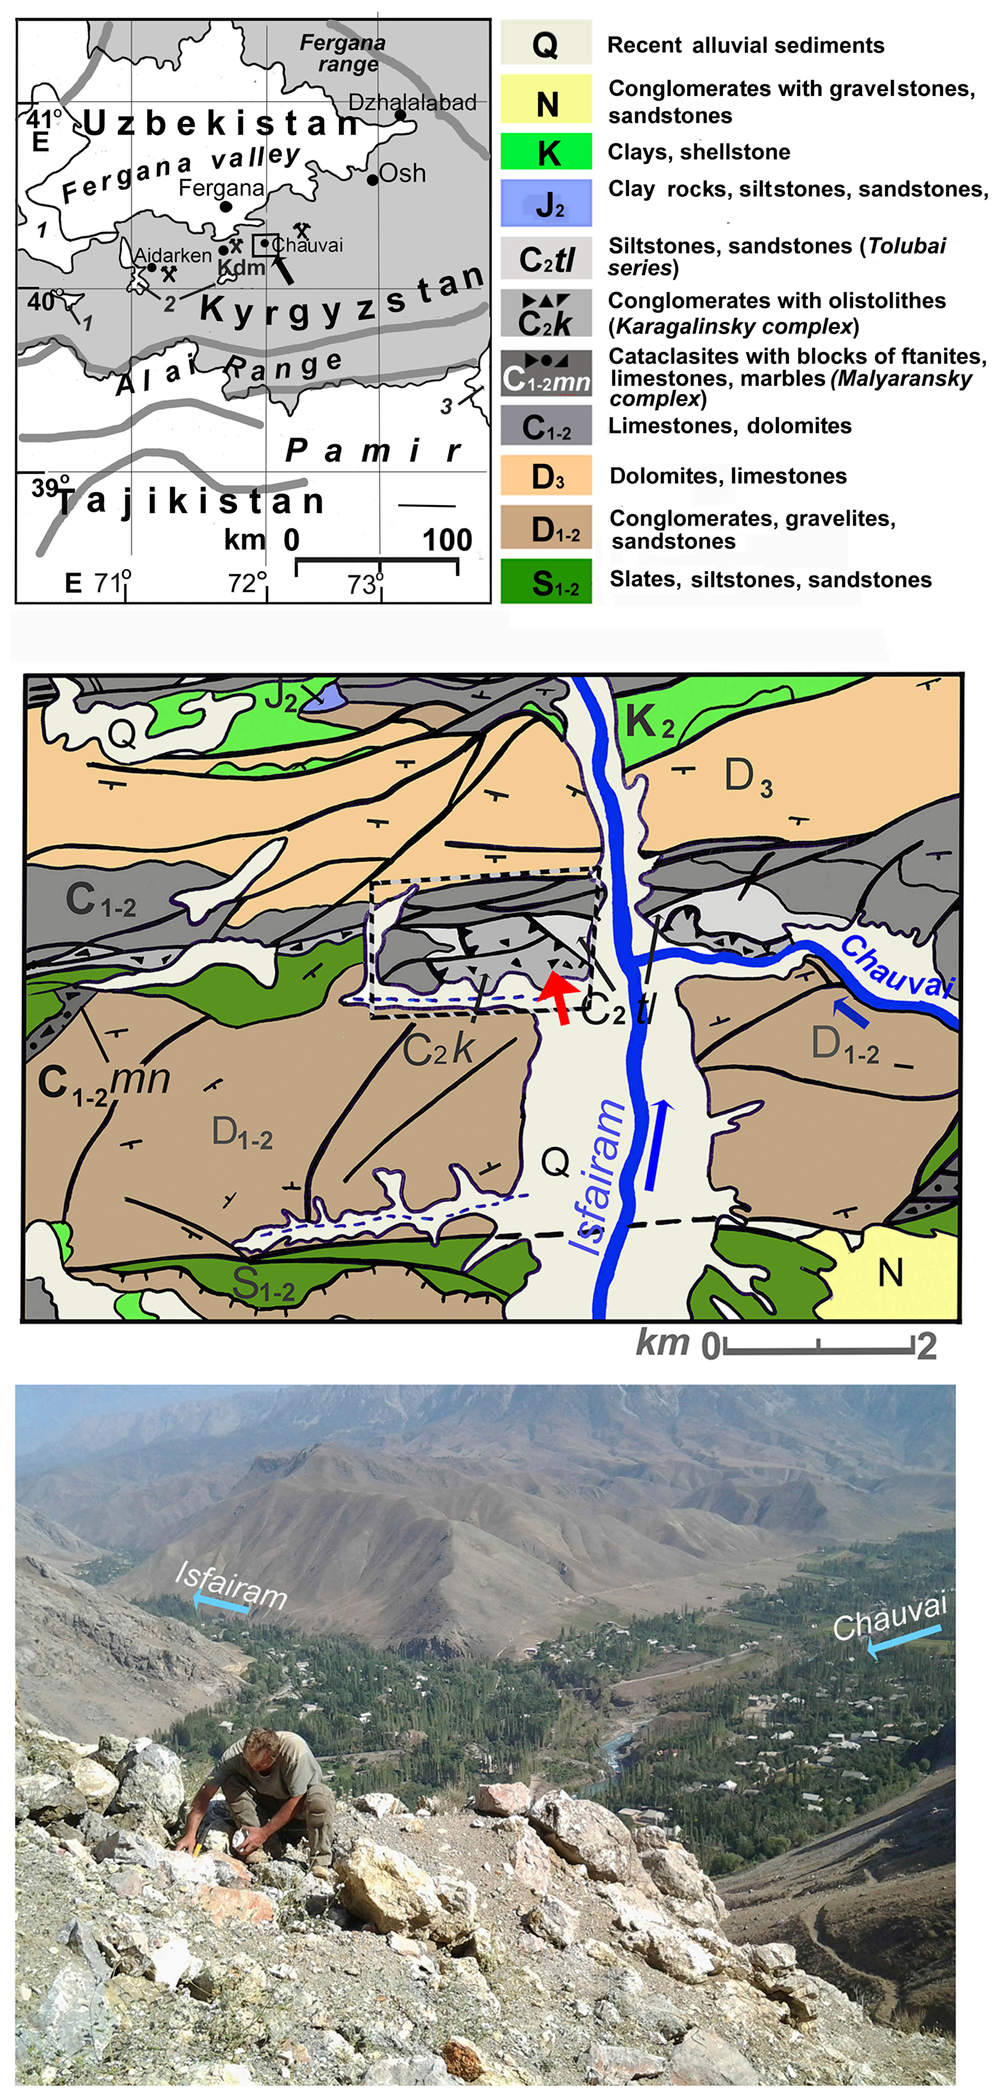
The Chauvai ore field is a part of the Kadamdzhai district of the Batken region of the Republic of Kyrgyzstan (Fig. 1a). The region has been significant for mercury mining since the 10th Century (Saukov, Reference Saukov1932b). The exploration and development of the Chauvai mercury deposit in the 20th century began with the Fergana Radium Expedition in 1914 and later by several expeditions organized by the USSR Academy of Sciences in 1925–1926 (Shcherbakov, Reference Shcherbakov1926; Shcherbakov and Sosedko, Reference Shcherbakov and Sosedko1928; Saukov, Reference Saukov1931, Reference Saukov1932a, Reference Saukov1932b; Moskvin, Reference Moskvin1933). The geology of this area is characterized by the complex thrust tectonics and the Alai complex strata (from dolomites D1–2 to terrigenous-siliceous-carbonate sediments C1–2) (Fig. 1b). A steeply dipping system of the sublatitudinal and north-eastern strikes is accompanied by hydrothermally altered zones with fluorite and Hg, Sb, As mineralisation, and enriched with Tl, Ga, Se, Ge and In (Belov, Reference Belov, Aksenov and Aksenenko1989). Russian mineralogist V.Yu. Volgin studied the zonation of the Chauvai ore field and noted the development of low-temperature arsenic and galkhaite ores on the western flanks of the Chauvai in contrast to the central and eastern parts with high-temperature cinnabar and stibnite-cinnabar (with tetrahedrite-group minerals) mineralization (Volgin et al., Reference Volgin, Barinkova and Ivanov1981, Reference Volgin, Barinkova and Ivanov1985). In the early 1990s, gold mineralization was discovered at the Obdilya (Rogalsky, Reference Rogalsky1992), which led to further exploration. In 2009, during clearing for the drilling site (40°08′27.6432″N and 72°05′15.7344″E) (Fig. 1c), realgar-orpiment and arsenate mineralization were found (Fig. 1b) among the lower Middle Carboniferous carbonate strata and Middle Carboniferous olistostromic sediments attributed to the Tolubai series (Fig. 1b). Calciopharmacoalumite was found in association with vladimirite Ca4(AsO4)2(AsO3OH)·4H2O, mansfieldite Al(AsO4)·2H2O, talmessite Ca2Mg(AsO4)2·2H2O, tapiaite Ca5Al2(AsO4)4(OH)4·12H2O and various amorphous K–Ca–Fe–Al arsenates (Karpenko et al., Reference Karpenko, Pautov, Agakhanov and Siidra2022).
Geographical map showing the location of the Chauvai ore field in the centre (1– Tajikistan, 2 – Uzbekistan, 3 – China, Kdm – Kadamdzhai) (upper). Geological map of the western part of the Chauvai ore field (after Belov et al., Reference Belov, Aksenov and Aksenenko1989) (middle); red arrow points to the Obdilya deposit. Dumps of the drilling site where calciopharmacoalumite was found in September 2015 (below).

Figure 1 Long description
The first image is a geographical map showing the location of the Chauvai ore field in Central Asia, bordered by Uzbekistan, Kyrgyzstan and Tajikistan. Key locations include the Fergana Valley and the Pamir Range. The second image is a geological map of the western part of the Chauvai ore field. It includes various geological formations such as recent alluvial sediments, conglomerates, clay, siltstone, sandstone, limestone, dolomites and slates. A red arrow points to the Obdilya deposit. The map also shows the Isfara River and the Chauvai area. The third image is a photograph of a drilling site where calciopharmacoalumite was found. The landscape includes the Isfara River and the Chauvai area, with visible mountainous terrain and labeled locations such as ′Isfara′ and ′Chauvai′.
Appearance, physical and optical properties
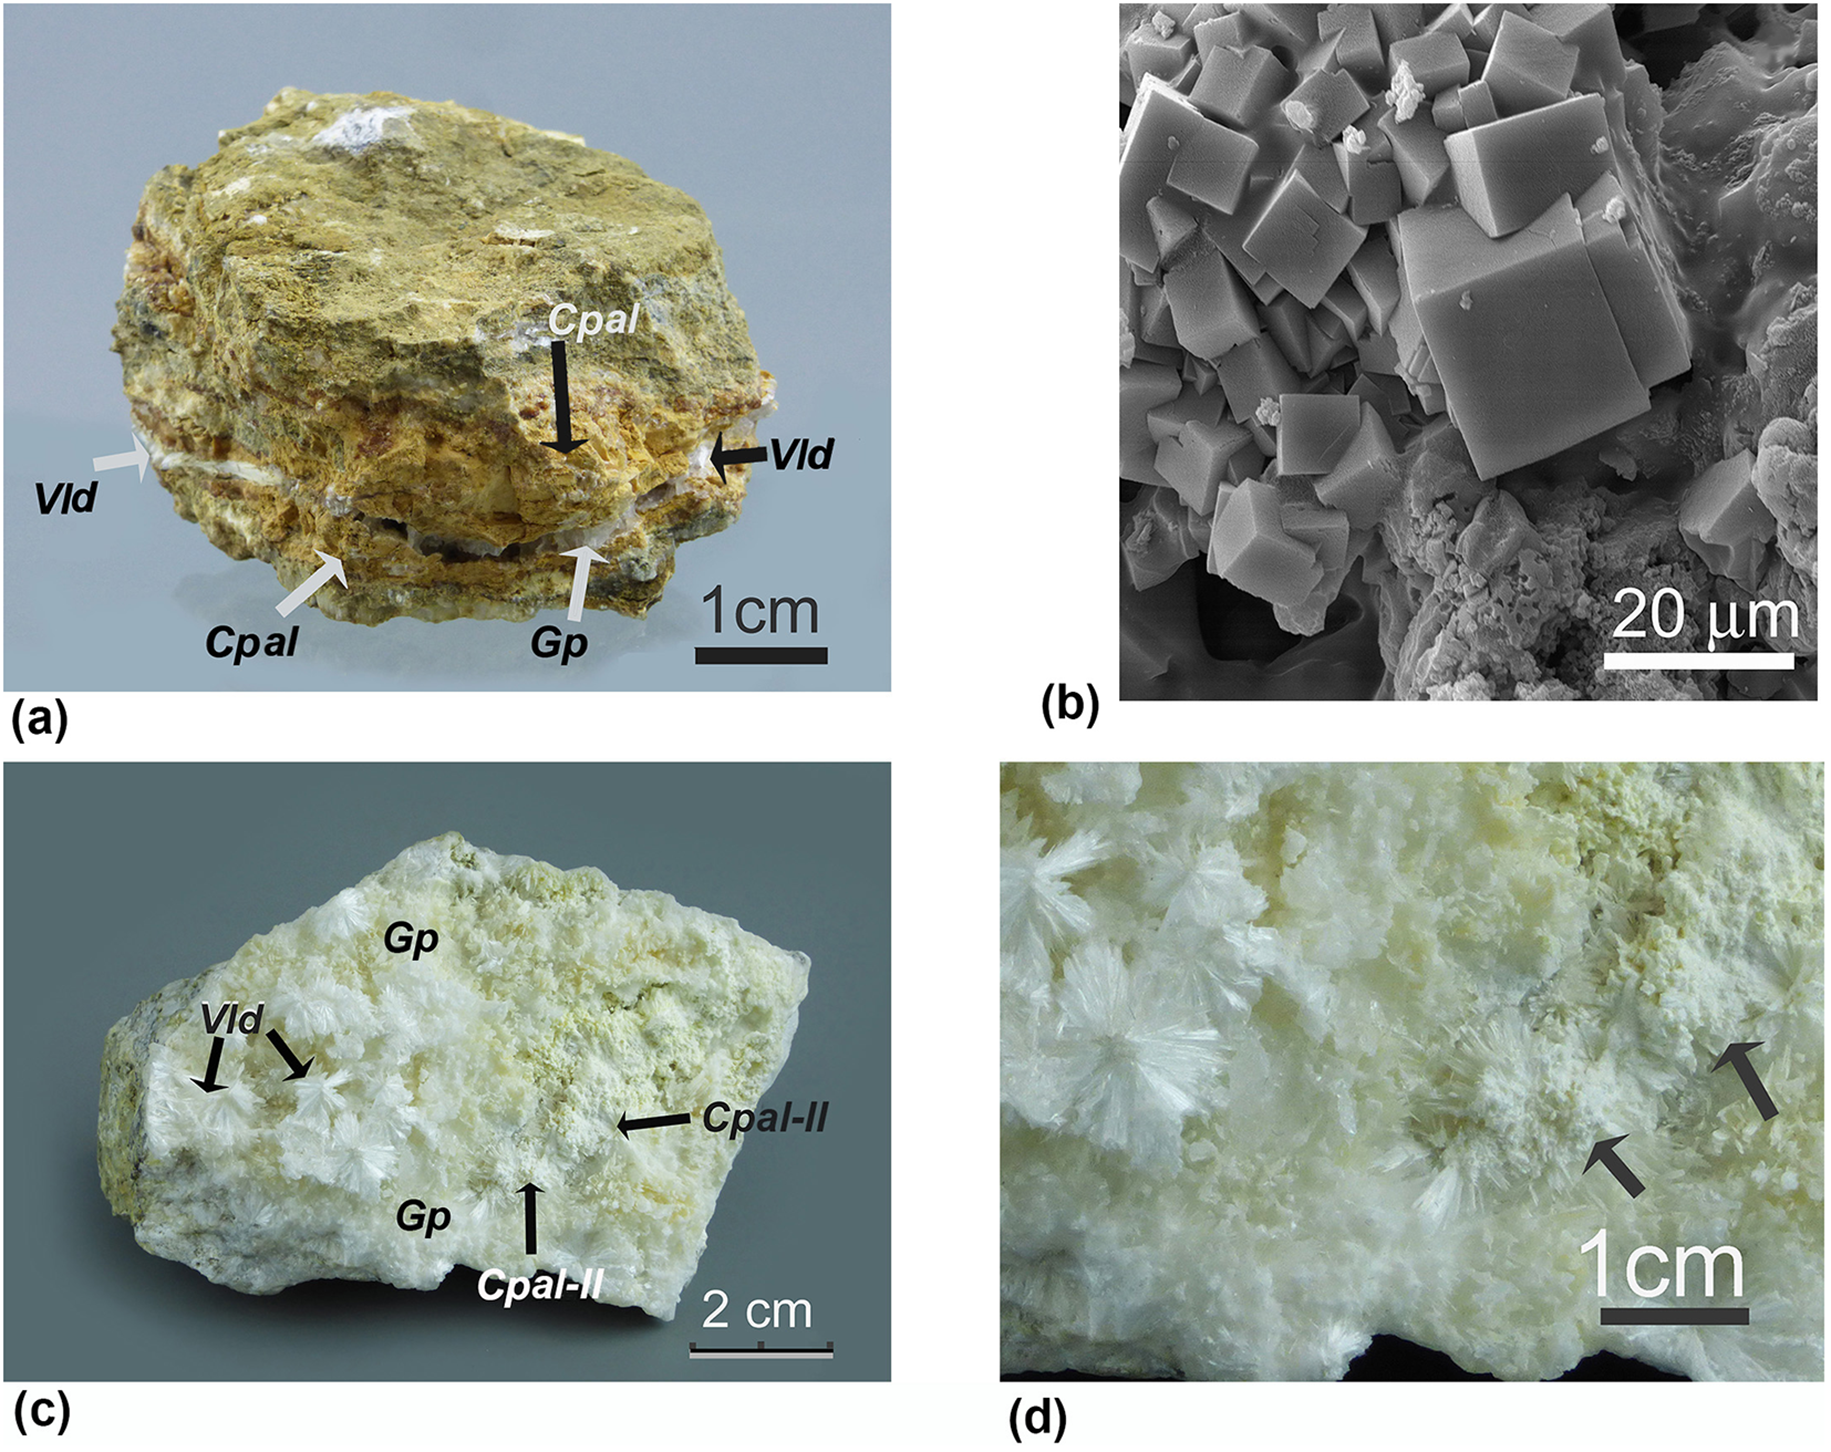
There are two types, I and II, of calciopharmacoalumite aggregates observed in the samples studied. Type I is characterized by clusters of light-brown iron-bearing cubic crystals (5–20 µm) (Fig. 2a,b). Type II is represented by white iron-free polycrystalline masses overgrown with prismatic vladimirite crystals (Fig. 2c,d). All the properties reported below were measured on calciopharmacoalumite crystals of the type I.
A fragment (sample № 5990) of a limestone with arsenate mineralization: Cpal – iron-bearing calciopharmacoalumite of the type I; Vld – vladimirite; Gp – gypsum (a). Scanning electron microscopy image of the cubic calciopharmacoalumite crystals (b). Chalky aggregates of the calciopharmacoalumite aggregates of the type II (Cpal-II) on vladimirite (c) and the enlarged area (d).

Calciopharmacoalumite has a Vickers Hardness Number (VHN) of 115 kg mm–2 (n = 6, range 60–145 kg mm–2), which corresponds to a Mohs hardness of ∼2.5–3.5. Lustre is vitreous. Parting was not observed, and its fracture is uneven. The density could not be measured due to lack of sufficient material. The calculated density using the empirical formula derived from the analytical data given below is 2.63 g cm–3. The mineral is non-fluorescent in both short- and longwave UV light. In thin sections calciopharmacoalumite is light-yellow and transparent. The aggregates of type I are weakly magnetic due to a minor Fe content; this allowed for extraction of material for Mössbauer spectroscopy. The mineral is optically isotropic, n = 1.580(2) (at 589 nm). Optical properties were studied using a Polam R-211 microscope, using a standard set of immersive liquids.
Calciopharmacoalumite is highly soluble in both concentrated and dilute HNO3 and HCl acids.
Chemical composition
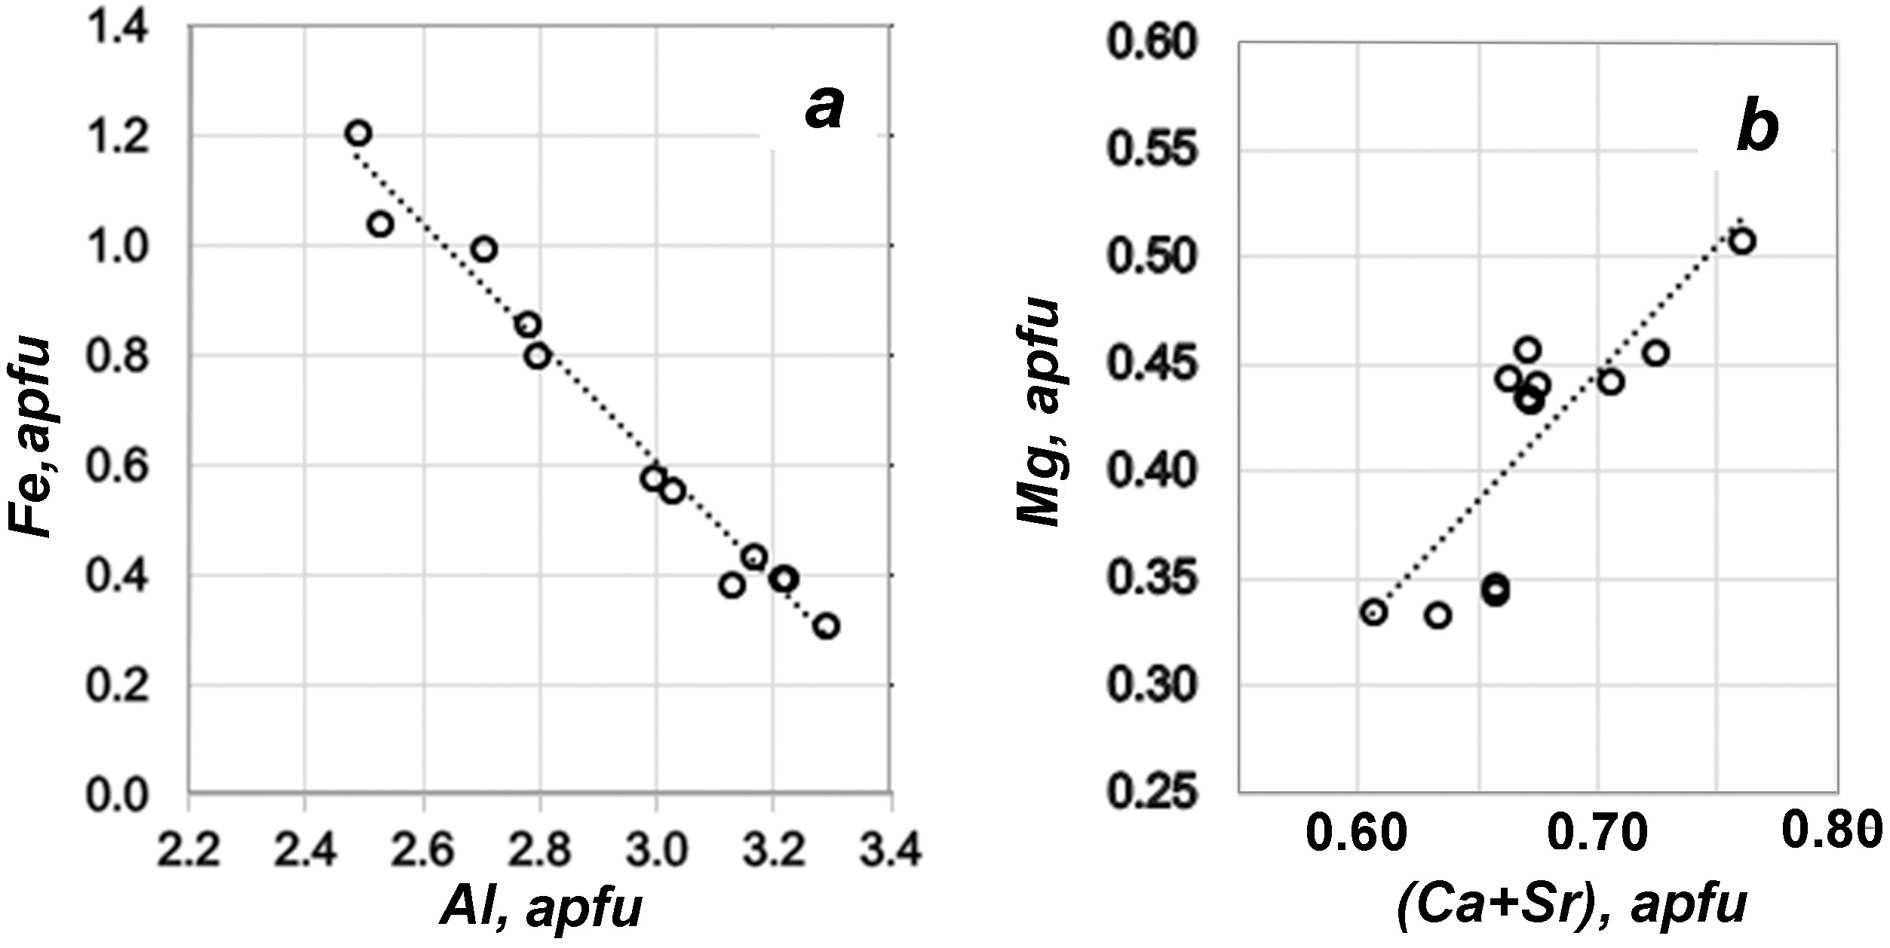
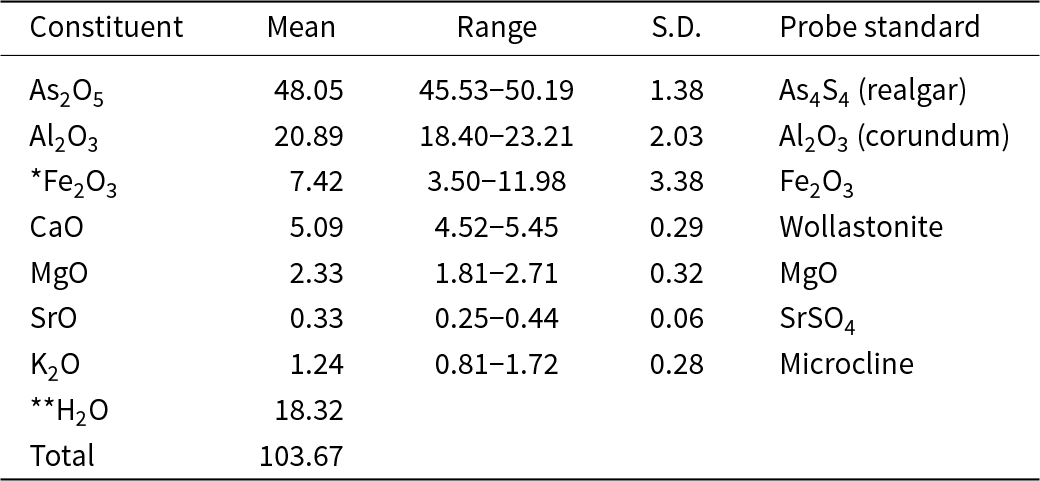
The quantitative analysis (10 points) was performed exclusively on calciopharmacoalumite of type I from the sample shown in Fig. 2a. The crystals were extracted from the sample and pressed into epoxy. Due to polishing issues, type II polycrystalline aggregates are not suitable for microprobe analysis. Additionally, their admixture with gypsum precludes their analysis by wet chemistry. Type I aggregates were analysed, using a JEOL 733 Superprobe equipped with WDS, the accelerating voltage was 15 kV; beam current 20 nA and probe diameter 10 µm. Despite the sensitivity of calciopharmacoalumite to an electron beam, WDS analysis was performed because of the strong overlapping of AsLα and MgKα lines in the ED spectra. The following standards were used: Al2O3 (Al), realgar (As), Fe2O3 (Fe), wollastonite (Ca), MgO (Mg) and SrSO4 (Sr). Analytical data are given in Table 2. Compositional variation of Al and Fe demonstrated a negative correlation (Fig. 3a), which is a characteristic feature of the pharmacoalumite–pharmacosiderite series. A positive correlation (Ca+Sr, apfu) vs. Mg (in atoms per formula unit, apfu) is shown in Fig. 3b. Mg occupies an octahedral site. This elucidates the reason Ca exceeds 0.5 apfu in the mineral formula. Mg is regarded as the primary compensator for the excess charge introduced by Ca. The described new mineral is the first example in the pharmacoalumite group with Mg, occupying the M1-position.
Relationship between Al and Fe (left) and Mg and (Ca+Sr) (right) in atoms per formula unit for calciopharmacoalumite.

Analytical data (wt.%) for calciopharmacoalumite

Table 2 Long description
Weight percent analytical results are listed by constituent, with columns for Mean, Range, S. D., and Probe standard. As2O5 has a mean of 48.05, range 45.53 to 50.19, S. D. 1.38, probe standard As4S4, realgar. Al2O3 has a mean of 20.89, range 18.40 to 23.21, S. D. 2.03, probe standard Al2O3, corundum. Fe2O3 marked with a single asterisk has a mean of 7.42, range 3.50 to 11.98, S. D. 3.38, probe standard Fe2O3. CaO has a mean of 5.09, range 4.52 to 5.45, S. D. 0.29, probe standard Wollastonite. MgO has a mean of 2.33, range 1.81 to 2.71, S. D. 0.32, probe standard MgO. SrO has a mean of 0.33, range 0.25 to 0.44, S. D. 0.06, probe standard SrSO4. K2O has a mean of 1.24, range 0.81 to 1.72, S. D. 0.28, probe standard Microcline. H2O marked with a double asterisk has a mean of 18.32, with no range, S. D., or probe standard shown, and Total is 103.67 with no range, S. D., or probe standard shown.
*The results of Mössbauer spectroscopy indicate that all iron is ferric (see below).
**Calculated; S.D. – standard deviation.
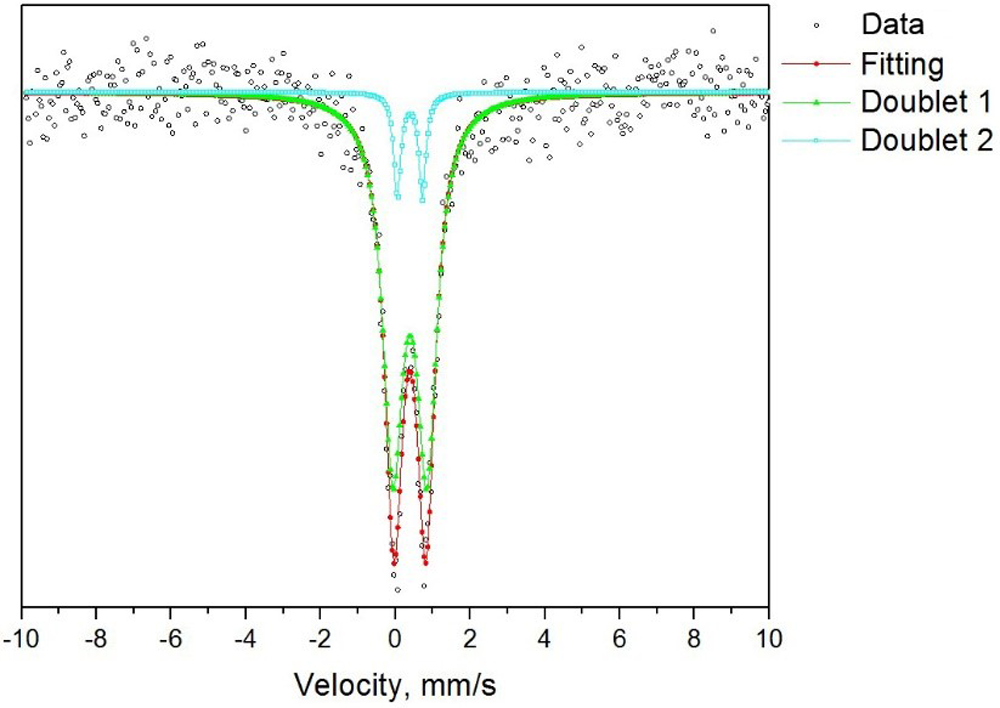
In order to determine the iron valence, 57Fe Mössbauer spectra were measured at room temperature using a SM 2201 Mössbauer spectrometer recording gamma radiation in the transmission geometry. The reference signal in the spectrometer Doppler modulator had a sawtooth shape to set the velocity with a constant acceleration. The source of γ-quanta was 57Co with an activity of 15‧108 Bq. The velocity scale was calibrated using a 6-μm thick α-Fe foil. The spectra obtained can be described as a combination of D1 and D2 doublets (D1/D2 ≈ 9.86), which corresponds to that of Fe3+ in the octahedral position (Table 3, Fig. 4).
Mössbauer spectra of calciopharmacoalumite.

Mössbauer spectroscopy data for calciopharmacoalumite

Table 3 Long description
Mossbauer band parameters are listed by component, with columns for delta in millimeters per second, QS in millimeters per second, and S in percent. For Doublet 1, delta is 0.389 plus or minus 0.006, QS is 0.913 plus or minus 0.017, and S is 90.79. For Doublet 2, delta is 0.381 plus or minus 0.012, QS is 0.677 plus or minus 0.030, and S is 9.21. Delta values are close between the two doublets, while QS is higher for Doublet 1 than for Doublet 2.
δ – isomeric shift of Mössbauer bands, QS – quadrupole splitting, S – band’s square (% from a total spectra square). Isomeric shifts are given relative to α–Fe.
Due to the admixtures of gypsum, which is present in both I and II types, we were unable to perform a direct determination of water. The amount of the hydroxyl is calculated from the charge balance, and the amount of H2O is based on the structural data. The empirical formula calculated on the basis of As = 3 apfu is (Ca0.65K0.19Sr0.02)1.53+Σ0.86(Al2.94Fe3+0.66Mg0.40)11.60+Σ4.00(AsO4)39–((OH)3.87O0.13)4.13–Σ4.00·5.29(H2O). The simplified formula is (Ca,K)(Al,Fe3+,Mg)4(AsO4)3(OH)4·5H2O. The ideal formula is Ca0.5Al4(AsO4)3(OH)4·5H2O, which requires (wt.%) CaO 3.99, Al2O3 29.00, As2O5 49.03, H2O 17.98, total 100.
The following substitution mechanism can be proposed: K+ + (Al, Fe)3+ ↔ (Ca, Sr)2+ + Mg2+. The existence of the hypothetical phase with CaAl3Mg(AsO4)3(OH)4·5H2O composition is possible. Additional hypothetical members of the Ca0.5Fe4(AsO4)3(OH)4·5H2O–CaFe3Mg(AsO4)3(OH)4·5H2O series may exist.
Raman spectroscopy
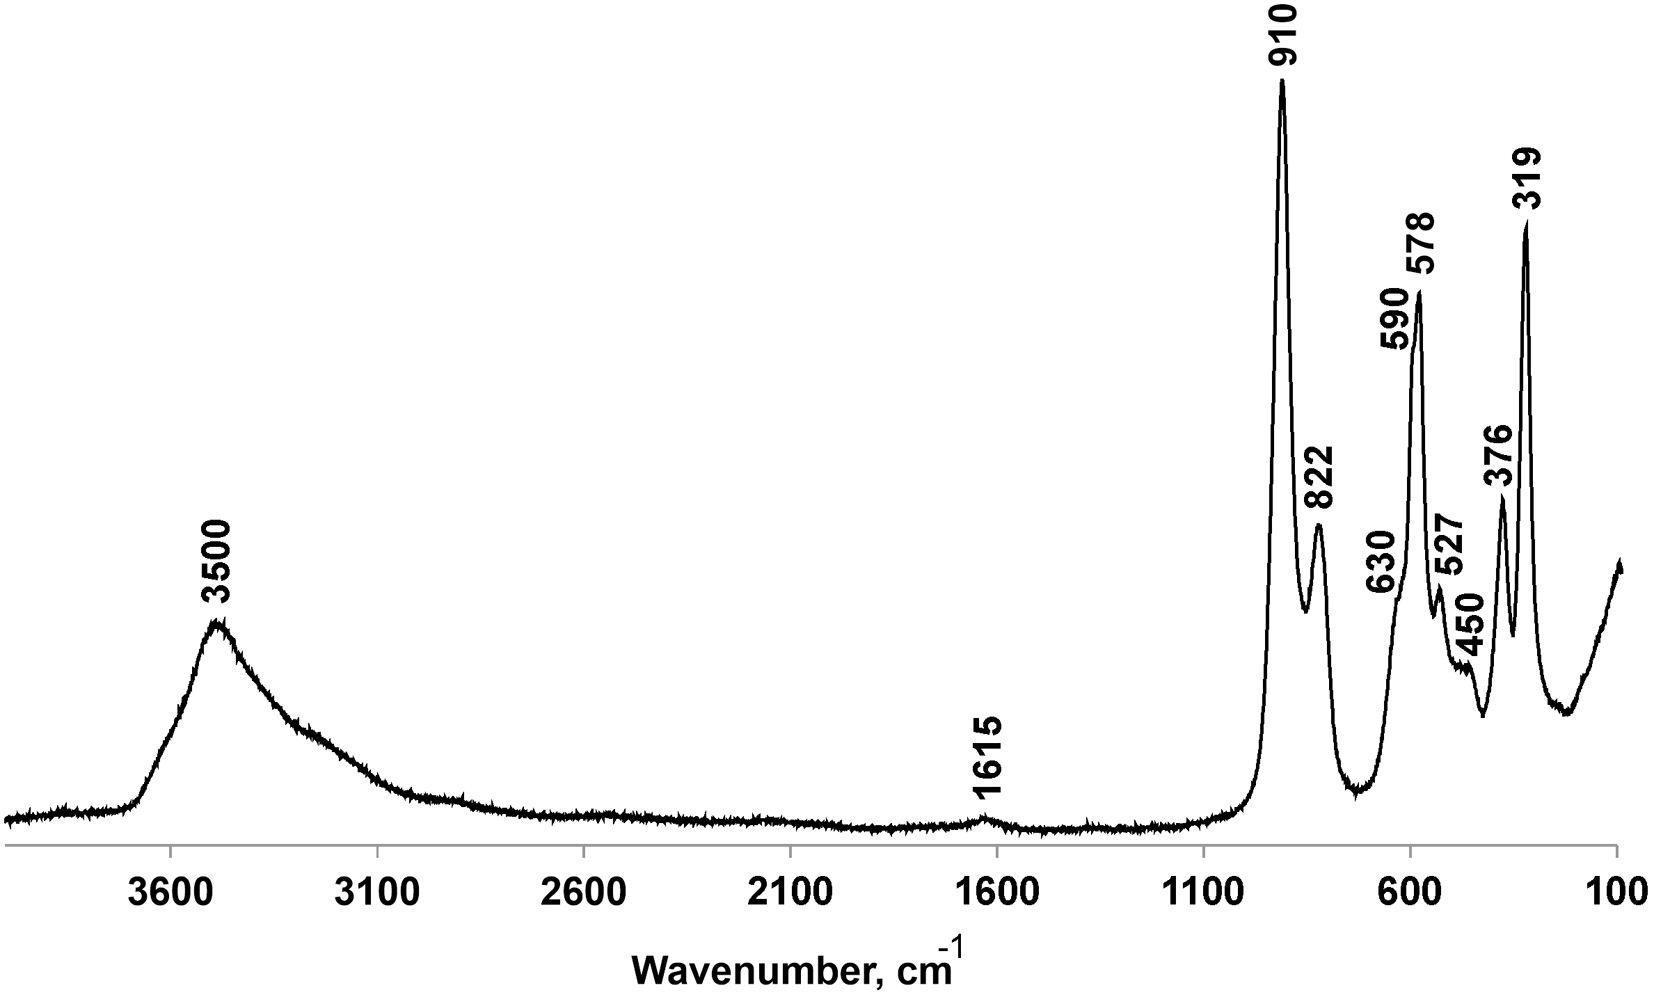
Raman spectra (Fig. 5, Table 4) were obtained with a Horiba Jobin-Yvon LabRam HR 800 spectrometer equipped with an Ar+ laser (λ = 514 nm) at 50 mW output power. Raman spectra were recorded at room temperature and processed using LabSpec and Origin software.
Raman spectrum of calciopharmacoalumite.

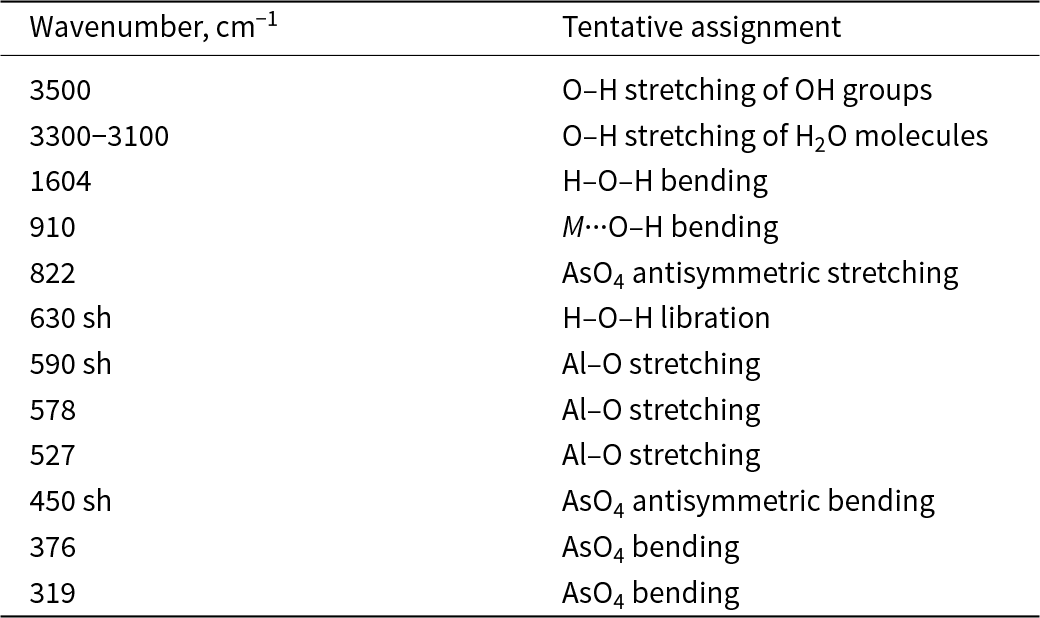
Raman bands of calciopharmacoalumite

Table 4 Long description
Two columns list wavenumber in per centimeter and a tentative assignment for each Raman band. O H stretching of OH groups is listed at 3500, and O H stretching of H2O molecules is listed as a range from 3300 to 3100. H O H bending appears at 1604, and M dot dot dot O H bending appears at 910. AsO4 antisymmetric stretching is listed at 822. H O H libration is listed at 630 with a shoulder marker, and Al O stretching appears at 590 with a shoulder marker, plus additional Al O stretching at 578 and 527. AsO4 antisymmetric bending is listed at 450 with a shoulder marker, followed by AsO4 bending at 376 and 319.
Notes – sh = shoulder
The spectra contain broad and strong bands at ∼3500 cm–1 with a shoulder at 3300–3100 cm–1 both corresponding to O–H stretching vibrations. The H–O–H bending is observed at 1604 cm–1 (Frost and Kloprogge, Reference Frost and Kloprogge2003; Frost et al., Reference Frost, Scholz, Jirásek and Belotti2015). The band observed at 910 cm–1 can be assigned to M···O–H (M = metal) bending vibrations. The band at 822 cm–1 indicates AsO4 stretching (Ismagilova et al., Reference Ismagilova, Rieck, Kampf, Giester, Zhitova, Lengauer, Krivovichev, Zolotarev, Ciesielczuk, Mikhailova, Belakovsky, Bocharov, Shilovskikh, Vlasenko, Nash and Adams2022). Other bands related to AsO4 are found at 450, 376 and 319 cm–1 (Dordević et al., Reference Dordević, Karasalihović, Stöger-Pollach and Karanović2023). The bands found at 590, 578 and 527 cm–1 are found in pharmacoalumite (Dordević et al., Reference Dordević, Karasalihović, Stöger-Pollach and Karanović2023) and other Al-minerals (Skrzyńska et al., Reference Skrzyńska, Müller, Juroszek, Krüger, Cametti, Pakhomova, Galuskina, Vapnik, Woźniak and Galuskin2025; Zhitova et al., Reference Zhitova, Chukanov, Jonsson, Pekov, Belakovskiy, Vigasina, Zubkova, Van and Britvin2021) and assigned to Al–O stretching that may overlap with other M–O vibrations (Table 4).
Powder X-ray diffraction
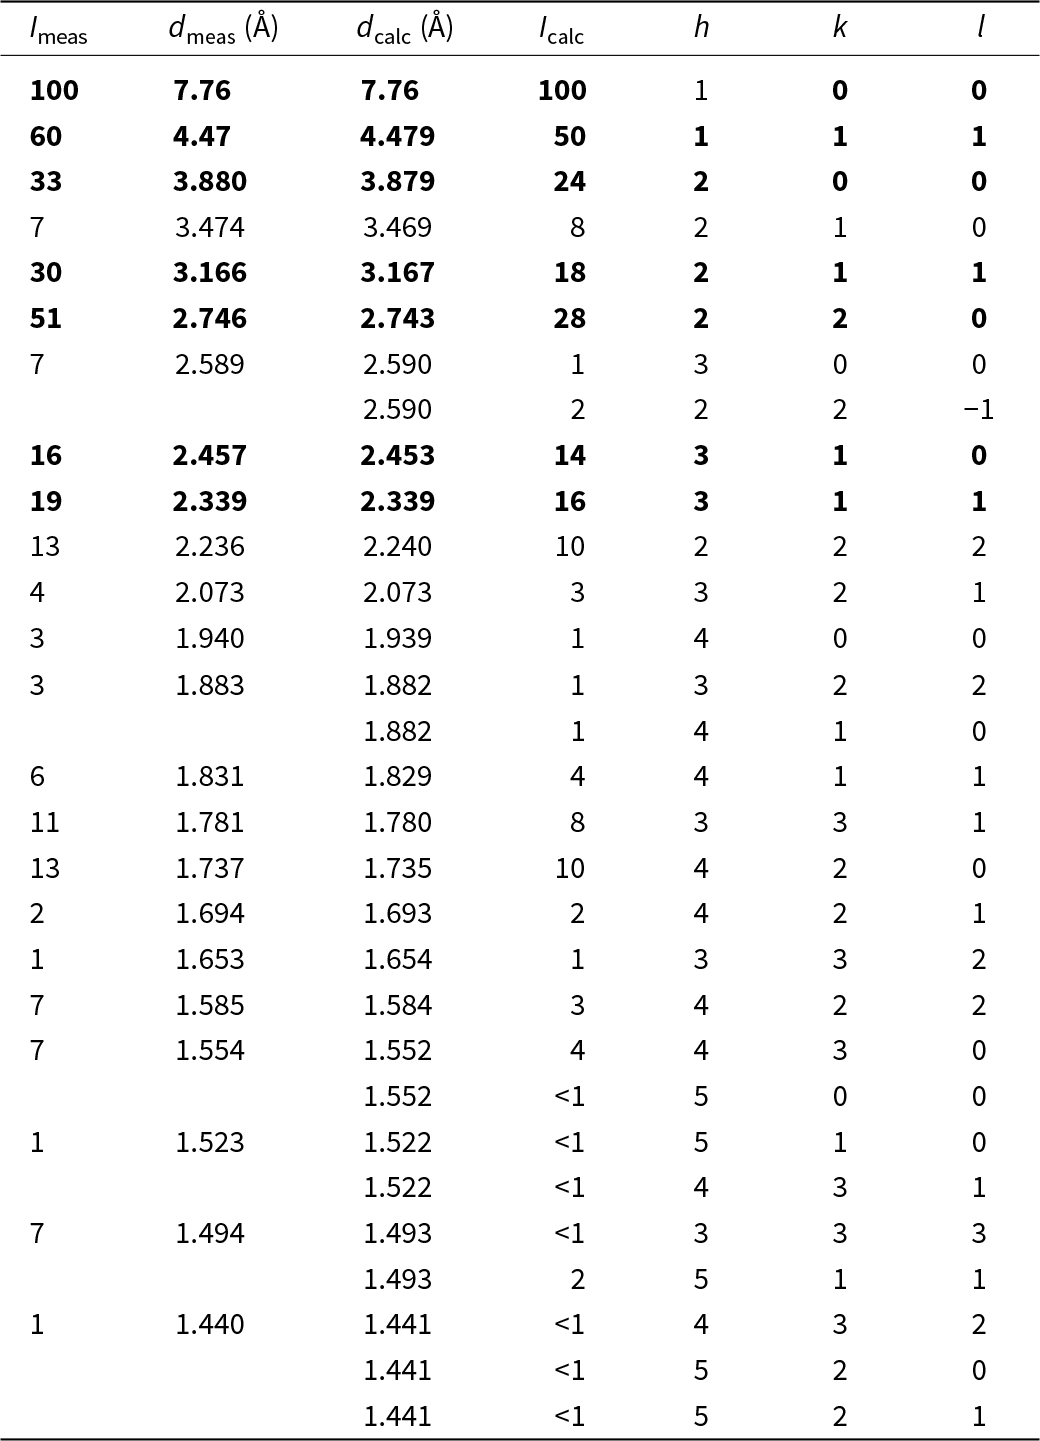
Powder X-ray diffraction data (Table 5) were collected with a Rigaku R-Axis Rapid II diffractometer (Debye-Scherrer geometry, d = 127.4 mm) equipped with a rotating anode X-ray source (CoKα, λ = 1.79021 Å) and a curved image plate detector. The unit-cell parameters refined in P  $\bar 4$3m space group are: a = 7.7644(10) Å and V = 468.09(18) Å3. The values provided in Table 5 (d calc, I calc, hkl) are calculated using the crystal structure reported therein and the Vesta program (Momma and Izumi, Reference Momma and Izumi2011).
Powder X-ray diffraction data (d in Å) for calciopharmacoalumite. The most intense lines are emboldened

Table 5 Long description
Powder X ray diffraction entries list measured intensity, measured d spacing in angstroms, calculated d spacing in angstroms, calculated intensity, and Miller indices h, k, l. Measured peaks run from Imeas 100 at dmeas 7.76 with dcalc 7.76 and Icalc 100 for h 1, k 0, l 0, down to Imeas 1 at dmeas 1.440 with dcalc 1.441 and Icalc less than 1 for h 4, k 3, l 2. Other higher measured intensities include Imeas 51 at dmeas 2.746 with dcalc 2.743 and Icalc 28 for h 2, k 2, l 0, and Imeas 33 at dmeas 3.880 with dcalc 3.879 and Icalc 24 for h 2, k 0, l 0. Several rows include calculated-only reflections where Imeas and dmeas are blank, including dcalc 2.590 with Icalc 2 for h 2, k 2, l minus 1, and dcalc 1.882 with Icalc 1 for h 4, k 1, l 0. Additional calculated-only entries appear at dcalc 1.552 with Icalc less than 1 for h 5, k 0, l 0, at dcalc 1.522 with Icalc less than 1 for h 4, k 3, l 1, at dcalc 1.493 with Icalc 2 for h 5, k 1, l 1, and three entries at dcalc 1.441 with Icalc less than 1 for h 5, k 2, l 0 and for h 5, k 2, l 1, alongside the measured row at dmeas 1.440. Across the rows with both values present, dmeas and dcalc are close in each entry, such as 4.47 versus 4.479 and 2.339 versus 2.339.
The identification of associated minerals was done using a DRON-2.0 powder X-ray diffractometer with CuKα radiation and a RKU-86 mm camera with V-filtered CrKα radiation.
Single crystal X-ray diffraction
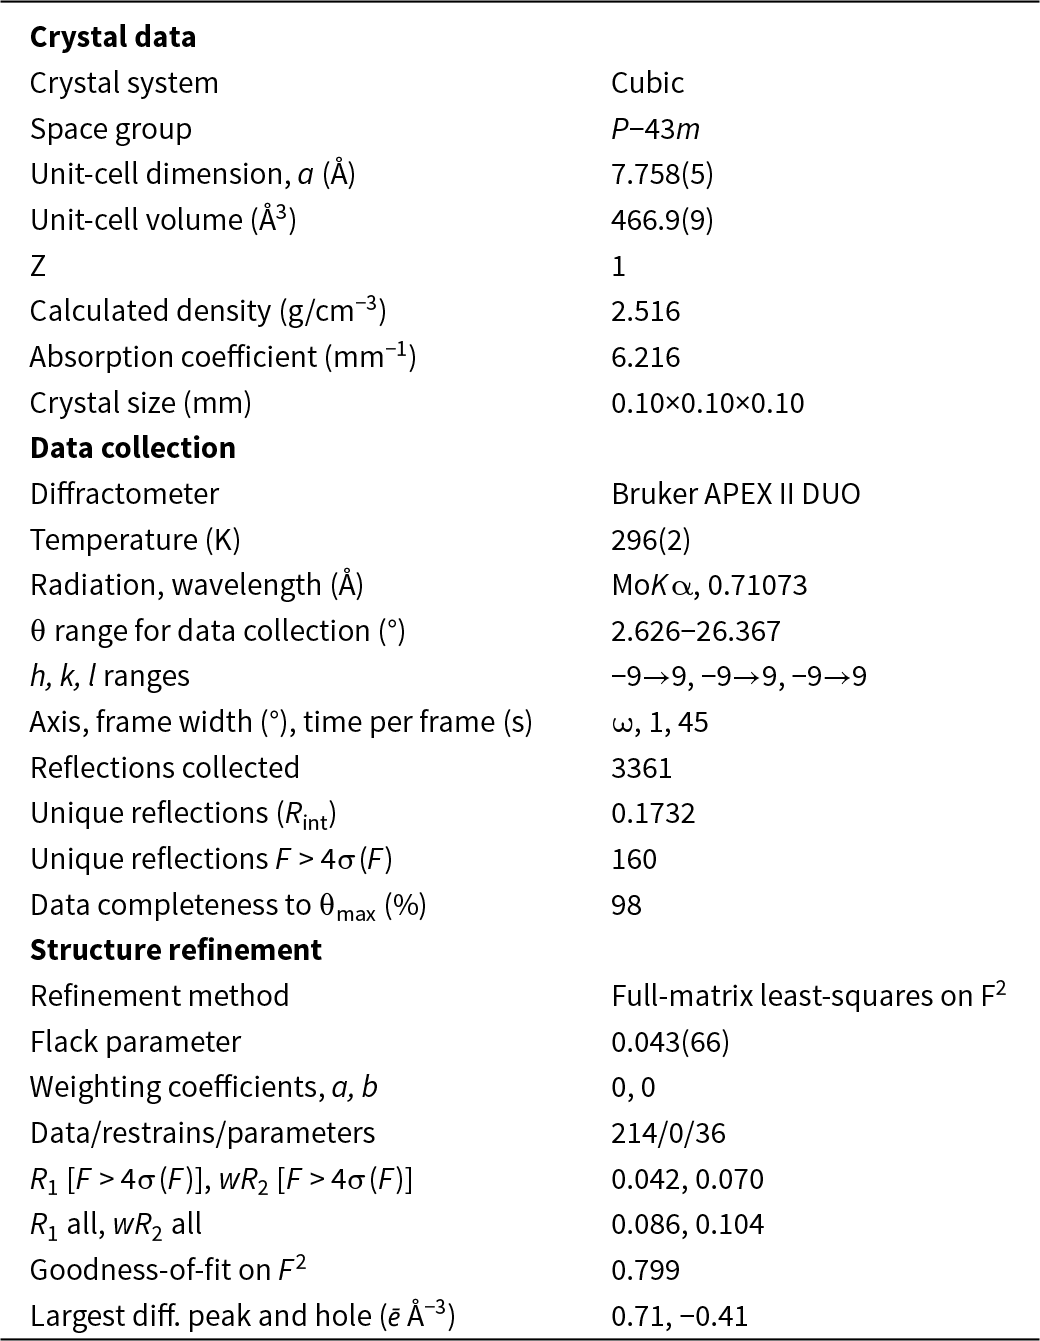
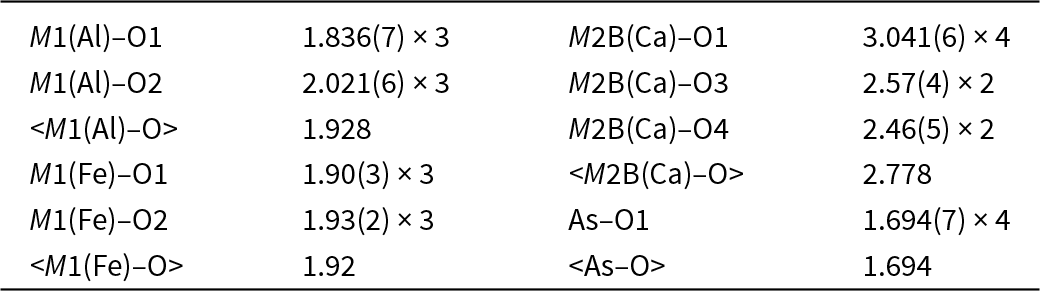
Single-crystal X-ray studies were carried out using a Bruker Kappa Apex II Duo diffractometer operated at 45 kV and 0.6 mA, with MoKα radiation and equipped with a CCD detector. The intensity data were reduced and corrected for Lorentz, polarization and background effects using the Bruker software APEX2 (Bruker-AXS, 2014). A semiempirical absorption correction based upon the intensities of equivalent reflections was applied (SADABS, Sheldrick, Reference Sheldrick2015). The unit-cell parameters were refined by the least-squares methods. Crystallographic data and refinement details are given in Table 6. The final atomic coordinates and site assignments are given in Table 7 and selected interatomic distances in Table 8. All atoms were refined with anisotropic displacement parameters. The crystallographic information file has been deposited and is available as Supplementary material (see below).
Crystallographic data and refinement parameters for calciopharmacoalumite

Table 6 Long description
Crystal data list a cubic crystal system with space group P minus 43 m, Z 1, calculated density 2.516 grams per cubic centimeter, absorption coefficient 6.216 per millimeter, and crystal size 0.10 by 0.10 by 0.10 millimeters. Data collection used a Bruker APEX II DUO diffractometer at 296(2) kelvin with MoK alpha radiation at wavelength 0.71073 angstroms. Theta range for data collection is 2.626 to 26.367 degrees, with h, k, l ranges from minus 9 to 9 for each. Axis is omega with frame width 1 degree and time per frame 45 seconds. Reflections collected are 3361, with unique reflections Rint 0.1732 and unique reflections with F greater than 4 sigma of F equal to 160. Data completeness to theta max is 98 percent. Structure refinement reports full matrix least squares on F squared, Flack parameter 0.043(66), weighting coefficients a 0 and b 0, and data restrains parameters 214, 0, and 36. R1 and wR2 for F greater than 4 sigma of F are 0.042 and 0.070, and R1 all and wR2 all are 0.086 and 0.104. Goodness of fit on F squared is 0.799, and largest difference peak and hole are 0.71 and minus 0.41 electrons per angstrom cubed.
Atom coordinates and equivalent isotropic displacement parameters (Å2) and site occupancies for calciopharmacoalumite

Table 7 Long description
Atomic sites are listed with Wyckoff site, fractional coordinates x, y, and z, equivalent isotropic displacement parameter Ueq in angstrom squared, occupancy, s.s. ref in electrons, s.s. calc in electrons, and an assigned site population. M1(Al) at Wyckoff 4e has x, y, z all 0.1419(4), Ueq 0.0205(13), occupancy 0.79(2), s.s. ref 63(1), s.s. calc 60.2, and assigned population Al2.94Fe0.66Mg0.40. M1(Fe) lists x, y, z all 0.129(3), Ueq 0.148(11), and occupancy 0.21(2), with no Wyckoff site, s.s. values, or assigned population shown in that row. As1 at Wyckoff 3d has x one half, y 0, z 0, Ueq 0.0299(4), occupancy 1.00, s.s. ref 99, s.s. calc 99, and assigned population As3.00. M2A at Wyckoff 3c has x one half, y 1, z one half, Ueq 0.15(3), occupancy 0.53(6), s.s. ref 6.5(7), s.s. calc 6.5, and assigned population (H2O)0.81. M2B(Ca) at Wyckoff 6g has x one half, y 1.112(9), z one half, Ueq 0.160(19), occupancy 0.116(14), s.s. ref 14.6(2), s.s. calc 17.4, and assigned population Ca0.65K0.19Sr0.02. Oxygen sites include O1 at Wyckoff 12i with x 0.1279(7), y 0.1279(7), z 0.3777(8), Ueq 0.037(2), occupancy 1.00, s.s. ref 96, s.s. calc 96, and assigned population O12.00; O2 at Wyckoff 4e with x, y, z all 0.8840(8), Ueq 0.026(3), occupancy 1.00, s.s. ref 32, s.s. calc 32, and assigned population O4.00; O3 at Wyckoff 4e with x, y, z all 0.6845(17), Ueq 0.105(8), occupancy 0.64(4), s.s. ref 20.5(6), s.s. calc 35.9, and assigned population (H2O)4.48; and O4 at Wyckoff 4e with x 0.633(2), y 0.633(2), z 0.367(2), Ueq 0.049(7), occupancy 0.54(3), and s.s. ref 15.4(6), with s.s. calc and assigned population not shown.
Selected bond lengths (Å) in the crystal structure of calciopharmacoalumite

Table 8 Long description
Bond lengths in angstroms are listed for pairs involving M1 with Al or Fe, M2B with Ca, and As with O atoms, with some entries giving a count. For M1 with Al, M1 to O1 is 1.836(7) with a count of three, M1 to O2 is 2.021(6) with a count of three, and the mean M1 with Al to O value is 1.928. For M1 with Fe, M1 to O1 is 1.90(3) with a count of three, M1 to O2 is 1.93(2) with a count of three, and the mean M1 with Fe to O value is 1.92. For M2B with Ca, M2B to O1 is 3.041(6) with a count of four, M2B to O3 is 2.57(4) with a count of two, M2B to O4 is 2.46(5) with a count of two, and the mean M2B with Ca to O value is 2.778. For As, As to O1 is 1.694(7) with a count of four, and the mean As to O value is 1.694.
Dozens of crystals were examined, and two complete datasets were collected. Only one of them was adequate for the structure refinement. The small size of the crystal (10×10×10 μm) in the type I sample has contributed to the low ratio of refined parameters to reflections and the resultant Rint = 0.1732. However, this enabled the determination and refinement of the structure, which led to R 1 = 0.042 and a chemically reasonable structure model.
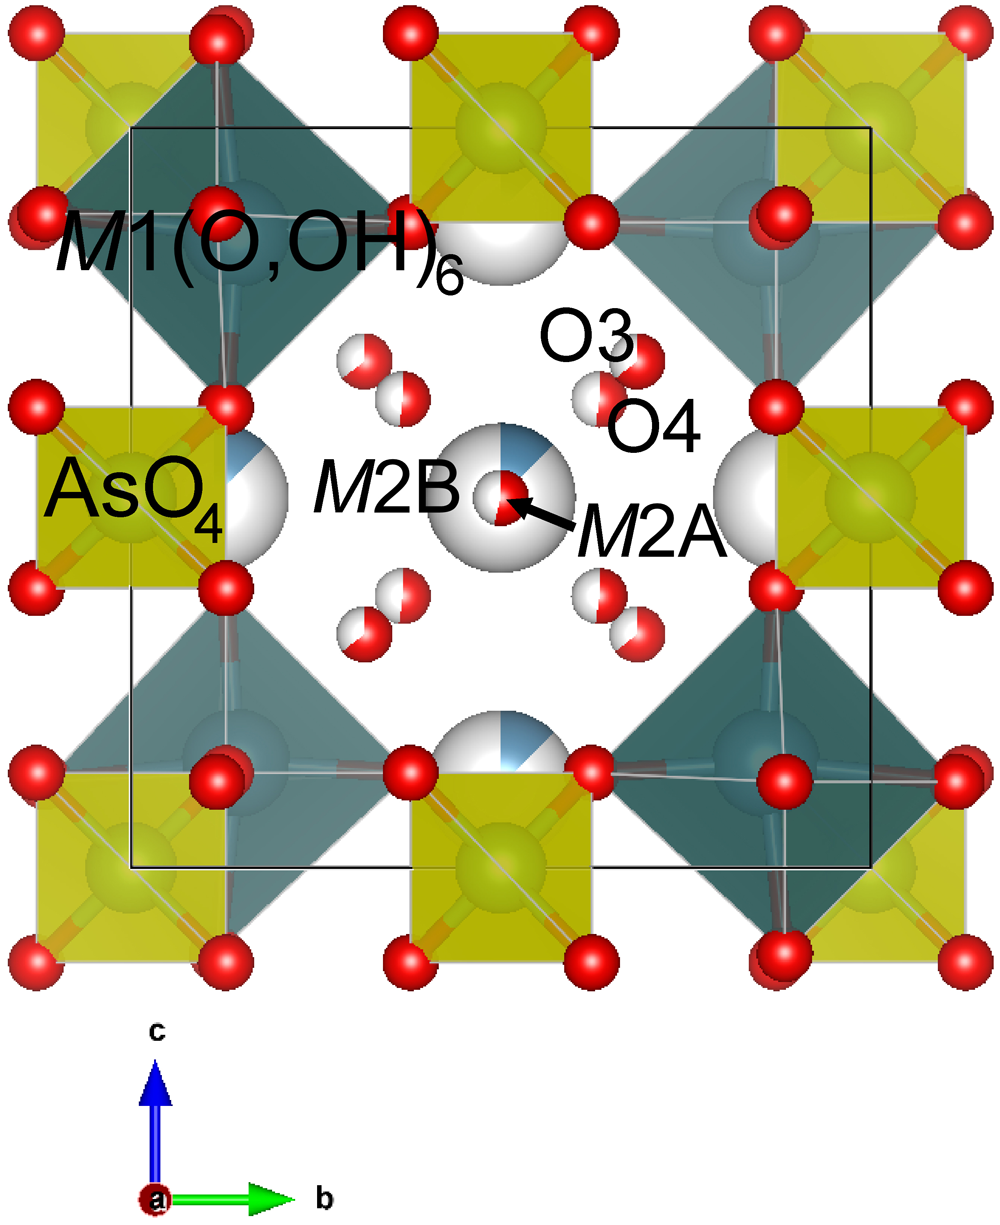
The crystal structure of calciopharmacoalumite (Fig. 6) contains the following sites: M1, M2A, M2B, As, O1, O2, O3 and O4 (Table 7). The crystal structure of the new mineral is isotypic with members of the pharmacosiderite supergroup (Rumsey et al., Reference Rumsey, Mills and Spratt2010). The mineral crystallizes in the P  $\bar 4$3m space group. The crystal structure is composed of M1(O,OH)6 octahedra corner-shared with AsO4 tetrahedra, thus forming the microporous framework. The framework contains a three-dimensional system of channels occupied by extra-framework cations (Ca, K and Sr) and H2O groups. The O3 and O4 sites are partially occupied by H2O molecules located in the channels. The M2 site is split into two sites, M2A and M2B, which are located 0.87(7) Å apart and are occupied by H2O molecules and Ca, K, and Sr atoms, respectively. A similar site splitting has been reported for bariopharmacoalumite, Ba0.5Al4(AsO4)3(OH)4·4H2O (Mills et al., Reference Mills, Rumsey, Favreau, Spratt, Raudsepp and Dini2011; Hager et al., Reference Hager, Leverett, Williams, Mills, Hibbs, Raudsepp, Kampf and Birch2010).
Segment of the crystal structure of calciopharmacoalumite. The black line shows the unit cell. Visualized using the Vesta program (Momma and Izumi, Reference Momma and Izumi2011).

Figure 6 Long description
The crystal structure of calciopharmacoalumite is illustrated, highlighting various sites within the structure. The black line outlines the unit cell. At the top left, the M1 site is labeled as M1 left parenthesis O comma OH right parenthesis subscript 6, indicating octahedral coordination. Adjacent to it, the As site is labeled as AsO subscript 4, representing tetrahedral coordination. In the center, the M2 site is split into two distinct sites, M2A and M2B, which are located close to each other. Surrounding these sites are O3 and O4, partially occupied by H2O molecules. The diagram also includes a three-dimensional system of channels occupied by extra-framework cations and H2O groups. At the bottom left, a directional arrow indicates the axes labeled as b and c, with b pointing horizontally and c vertically.
Concluding remarks
Calciopharmacoalumite is the first calcium-dominant member of the pharmacosiderite supergroup. We assume a low-temperature hydrothermal or hypergenic origin of calciopharmacoalumite. In other members of the group (Table 1), the Ca content is at trace levels. It is more preferable for large cations such as K, Na, Ba or Tl to enter this structure type. The absence or a very low content of these elements, along with the abundance of Ca and Al at the Obdilya deposit, seems to have contributed to the origin of the Ca-dominant mineral species. Another feature of calciopharmacoalumite is the presence of Mg, the source of which is most likely dolomite. When dolomites and dolomite limestones serve as host rocks, the Mg-dominant member is highly probable to emerge.
Supplementary material
The supplementary material for this article can be found at https://doi.org/10.1180/mgm.2025.10181.
Acknowledgements
We are grateful to Mike Rumsey and two anonymous reviewers for valuable comments. The authors thank V.S. Gursky, V.V. Smirnov, B. Toktogulov and K.E. Ibraev for their help in organizing the field work and V.A. Muftakhov for his help in the field mineral collection. This work was partially financially supported by the Russian Science Foundation, grant no. 24-63-00006 (O.I.S.). Technical support by the SPbSU X-ray Diffraction (project # 125021702335-5) and Geomodel Resource Centres is gratefully acknowledged.
Competing interests
The authors declare none.