Over the last four decades, the U.S. prison population increased more than 500 percent. Footnote 1 With more than 2.3 million people in its prisons or jails, the United States currently incarcerates a larger proportion of its occupants than any nation in the world. More than one-third of the people in state prisons are serving time for non-violent offenses, most of them property or drug offenses. When federal prisons are included, the percentage of non-violent offenders behind bars is even larger. Perhaps most concerning, the vast racial and class disparities within the nation’s penal institutions raise serious civil rights issues. Given current imprisonment rates, one in three black men and one in six Hispanic men will spend some time in jail or prison at some time during their lives. Footnote 2
Yet, after decades of persistent prison growth, the financial crisis of 2009 and widening state budget gaps led many commentators to speculate that the nation can no longer afford to keep so many people behind bars. In fact, the number of people in state and federal prisons declined for the third consecutive year in 2012 (down 1.7 percent). Footnote 3 Capitalizing on these new trends, numerous scholars and public intellectuals have heralded “the end of mass incarceration,” voicing confident optimism that moral and fiscal imperatives will work to eradicate an oppressive, archaic, and now-outmoded system of racial and class oppression. Footnote 4
The mounting and unsustainable fiscal costs of incarceration, combined with a growing conviction that the system is racially biased and excessively punitive for drug and nonviolent offenders, has drawn increasing opposition to sentencing laws from across the ideological spectrum. Despite the partisan rancor and gridlock that pervades Washington and statehouses, politicians and interest groups on both the left and right—including the American Civil Liberties Union, Americans for Tax Reform, the Tea Party-backed Freedom Works, and archconservative Koch Industries—are working together to downsize prison populations and overhaul sentencing laws. Footnote 5
While the current economic downturn, combined with increasingly lenient public attitudes toward marijuana use, catalyzed a slate of reforms to state and federal sentencing and drug laws in what appears to be a “trans-partisan chorus against wanton overcriminalization,” Footnote 6 several scholars also caution against assuming that the current economic burdens will dismantle the nation’s prison apparatus. Footnote 7 Rather, just as a number of states have softened their marijuana laws, many have simultaneously increased penalties for “harder” Schedule I substances such as methamphetamine and heroin, while still others have focused on increasing punishments for violent offenders. Meanwhile, the federal prison population became both larger and less violent than it was four years ago.
I argue that there are more deep-seated, but less visible, obstacles to dismantling the penal system that neither reform-minded advocates nor previous researchers fully address. Just as mass incarceration disproportionately affects poor black and Hispanic men located in segregated urban districts, swelling imprisonment rates also produced a historically unprecedented trend: prisons became a “growth industry” in rural America. Footnote 8 When new forms of punishment criminalized behaviors likely to flourish in urban ghettoes isolated from formal labor markets, Footnote 9 policymakers also capitalized on demand for prison infrastructure in order to bring jobs and capital to many economically distressed, rural communities. Although prisons may not appreciably improve the local economy in host communities, many under-developed rural spaces lack other viable employment options and grow to rely on existing penal institutions as a principal source of jobs and revenue. In short, what began as a politically expedient wave of rural prison development may have inadvertently unleashed a self-reinforcing punishment regime that is uniquely resistant to self-correction.
This framework suggests that prison development followed a “path dependent” process, meaning that initial policy decisions became self-reinforcing and the costs of changing course increased over time. Footnote 10 Scholars have demonstrated the influence of crime policy feedbacks that fortify criminalization and compel policymakers to “govern through crime,” Footnote 11 including partisan bidding wars for harsher sentencing, the rise of correctional officers’ unions, private prison industries and prosecutors’ associations. Footnote 12 Building on these insights, I argue that the persistence of mass incarceration in a period of reduced crime, fiscal constraints, and less punitive public attitudes is reinforced by a particularly perverse form of democratic politics, where a crucial subset of lawmakers and districts vote to impose harsh and degrading punishments on another subset of society because they experience short-term political and economic gains from carceral expansion. Specifically, legislators’ initial investments in prison construction increased the size and clout of predominantly rural communities where prisons are located, hinging the immediate economic viability and political power of declining rural communities onto the stability of an expansive, expensive, and invasive punishment apparatus.
To examine the political consequences of rural prison development systematically, I compiled an original dataset consisting of the location, size, and operating capacity of state, federal, and private prisons in California, New York, and Washington State from 2000–2010. These data afford an initial test of the relationship between local reliance on a prison infrastructure and political support for punitive criminal justice policies. I expect that state legislators representing economically homogenous, rural communities with prison facilities support harsh criminal punishments for non-violent offenses more than their partisan and ideological counterparts. Though preliminary, the results indicate that the growth of prison infrastructure throughout economically-depressed rural communities strengthens political demands for heightened punishment and makes it more difficult for reformers to roll back punitive sentencing laws. Patterns of rural reliance on prison investments may also augment ideological narratives supporting a retributive criminal justice regime.
The analysis proceeds as follows: First, I review literature documenting the racial and institutional underpinnings of mass incarceration as well as scholarship examining the consequences of carceral punishment for American democracy. Building from this framework, I introduce a new theory highlighting the dual role of both urban and rural poverty to help explain the persistence of a punitive punishment regime. I argue that the carceral state maintains a system of racial hierarchy and class stratification, while also linking the economic stability of lower-class, rural whites to the continued penal confinement of disproportionate numbers of poor, urban minorities. Just as isolated urban districts supply most of the nation’s prisoners, impoverished rural communities created viable spaces for warehousing the growing numbers of people sentenced to serve time in prison. Next, I present preliminary findings suggesting that rural prison development strengthens local representatives’ support for harsh forms of criminal punishment and impedes reform efforts in New York, California, and, to a lesser extent, Washington State.
New evidence presented here suggests that an especially pernicious form of path dependence reinforces the stability of the carceral punishment. Given initial decisions to build new prisons in economically-distressed rural areas, punitive sanctions fortify the political power and economic stability of this subset of rural communities, while shifting the most debilitating costs of incarceration onto a large and permanent class of social, economic, and political exiles. “Submerged” components of the criminal justice system subsidize predominantly white, rural communities that host prisons, while reproducing racial, class and spatial inequalities in ways that are largely hidden from public view. Footnote 13
The Political Consequences of Mass Imprisonment
After decades of relatively stable imprisonment rates, the rapid increase in incarceration in the 1970s spurred an interest in understanding why criminal punishment suddenly became so pervasive and so severe. David Garland’s seminal book emphasizes the disorienting challenges of modernity and increasing social disorganization as a catalyst spurring both more crime and more incarceration. Footnote 14 Subsequently, a new wave of scholars have shifted away from macrohistorical factors and honed in on the vast racial disparities that characterize the nation’s expansive criminal justice system. Drawing on historical archives and large volumes of empirical data, these scholars centralize racial politics to explain why crime was so acutely politicized in the 1960s and 1970s. This growing body of literature depicts the convergence of race riots and civil rights gains as the foundation of a punitive punishment regime. Policymakers not only employed draconian tactics to crush black power movements, but also exploited white fears of black criminality and used anti-crime rhetoric to secure re-election. Footnote 15
Meanwhile, American political development scholars have uncovered important historical and institutional underpinnings for the “carceral state,” ranging from earlier episodes of moral panics and historical crusades against crime to conservative efforts to reclaim the policy agenda and reconstruct new forms of racial hegemony following 1960s civil rights victories. Footnote 16 In a post-civil rights context, the Republican Party strategically conflated race and crime in order to overcome electoral disadvantages. Footnote 17 While Republican dominance at the state level is one of the strongest predictors of prison expansion in the 1980s and 1990s, Democrats were not only complicit in carceral growth but also aggressively competed to demonstrate their punitive credentials to voters. Footnote 18 Most recently, scholars have also begun to illustrate the ways in which the criminal justice system was redesigned to serve new purposes that its architects did not anticipate. For instance, Kristin Bumiller’s work documents the complicit role of victims’ rights advocates and feminist movements who lobbied to valorize victims by punishing the perpetrator. Footnote 19 Perhaps most poignantly, Naomi Murakawa illustrates how an expansive federal law enforcement capacity initially built to protect blacks from violence and lawlessness was coopted to serve the opposite goals. Footnote 20
In recent decades, the U.S. penal system has grown so large that it not only affects poor black and Hispanic neighborhoods, but also alters how governing institutions, electoral systems, and the bounds of citizenship operate. Jonathan Simon’s ambitious study reveals the extent to which criminal justice procedures, regulations, and surveillance mechanisms have come to define the nation’s governing institutions. This practice of “governing through crime” has generated a new mode of post-New Deal governance geared toward police surveillance and criminal punishments to enforce discipline and control in schools, the workplace, and nearly every permutation of public life. Footnote 21
Meanwhile, the aggressive use of imprisonment is redefining the bounds of American citizenship by creating a large and permanent class of people who are excluded from political, economic, and social life. People who have served a prison sentence are less likely to vote, find long-term employment, or maintain community and family ties. Footnote 22 More than 16 million Americans are permanently disenfranchised because they hold a criminal record. Felon disenfranchisement laws have particularly stark racial consequences, barring more than one in seven black men from the ballot box, and more than one in four in pivotal swing states such as Florida and Virginia. Footnote 23 Further, the practice of relocating people sentenced to serve time in prison and counting them as residents where they are incarcerated is also reshaping electoral and partisan strategies. As Jason Kelly’s work shows, legislators routinely draw districts with large numbers of people under lock—“phantom populations” who are barred from civic and political life—in order to free their partisan base to vote in more competitive districts and increase the number of seats that their party holds. Footnote 24
Despite increasingly levels of scholarly interest in understanding the origins of a punitive punishment regime and its effects on American democracy, few studies have examined why imprisonment trends accelerated in the 1980s and 1990s and largely persisted in more recent decades. Most studies suggest that prison growth is an inertial response to the same public anxieties, racial animus, and political strategies central to early criminalization efforts. Footnote 25
However, rather than assuming that the same factors underlying the initial growth of incarceration are also central to its subsequent development, an emerging literature illustrates how criminalization “ratchets up” incentives for more criminalization by creating new partisan strategies and empowering new groups with vested interests in penal expansion. As Naomi Murakawa illustrates, initial criminalization strategies not only satiated an anxious public and secured representatives’ reelections, but also fueled punitive “bidding wars” to demonstrate office-holders' “tough on crime” credentials. Footnote 26 Meanwhile, criminalization policies empowered prison guards unions, prosecutors associations, and private prison industries who aggressively lobbied to reinforce punitive policies. Footnote 27 Reliance on criminal punishment not only raised the costs of investing in alternative approaches, but also weakened the organization and electoral power of opposing interests. Footnote 28
The centrality of racial conflict and public insecurity to the development and growth of harsh and degrading imprisonment system cannot be overstated. However, these factors alone cannot fully explain decades of political support for punishments that have not only warehoused poor blacks and Hispanics, but also swept up increasing numbers of poor whites. Footnote 29 Nor can they explain why the populations under lock became larger and less violent, even while public attitudes about marijuana consumption and other non-violent offenses became more tolerant. Rather, as Michael Tonry points out, U.S. crime rates and public opinion track closely with other western democracies, yet U.S. imprisonment rates are unparalleled in a historical and global context. Footnote 30 If the convergence of civil rights movements and race riots in the 1960s was, in fact, a historically distinct “moment” spurring heightened fear, hostility, and resentment that found political expression in the form of more punitive policies, then imprisonment rates should either remain constant or decline over time. Yet imprisonment rates skyrocketed in the 1980s and 1990s, regardless of shifts in public opinion, the presence or absence of a racially charged focusing event, and precipitous declines in the overall crime rate.
At the same time, scholars examining crime policy feedbacks highlight the rise of new interest groups, growing partisan convergence on crime, and inter-party struggles over issue ownership. However, these studies do not address whether vested interests in prison capacity also systematically thwart democratic processes by empowering economically vulnerable communities that host prisons to “speak for” the dispossessed populations who are incarcerated there. While scholars have speculated that rural prison development may have self-reinforcing consequences, previous studies have not examined this question empirically or considered the broader implications for racial, class, and geographic subordination. Footnote 31
Unlike existing approaches, I emphasize an unintended but particularly pernicious consequence of the prison apparatus that may promote a punitive criminal justice regime, regardless of public anxiety and racial animus. Specifically, waves of expedient prison development throughout economically-distressed rural areas may have created new political and economic interests that stoke prison growth and make the penal system particularly difficult to dismantle. Identifying the locations of state, federal, and private prisons over a 10-year period allows me to systematically examine the political consequences of rural prison development across a wide range of cases and over time. First, I expect that prison sites are predominantly located in impoverished rural areas with few viable employment options, controlling for local demographics and other characteristics. Second, I expect that representatives in more economically-vulnerable rural areas with prison facilities will support policies that increase incarceration rates more than their urban and rural counterparts. This new framework suggests that heightened poverty and social inequality are bifurcated not only by race, but also by geography. The most virulent manifestations of inner-city poverty are subject to surveillance and imprisonment, while white, rural poverty creates viable spaces for warehousing incarcerated populations.
A New Direction: Exploiting Rural Poverty
While a large body of scholarly research reveals the disproportionate impact of harsh penal policies for poor, uneducated black men locked out of the formal labor economy, the effects of prison expansion in predominantly white, non-metropolitan communities are not as well understood. Yet just as most prisoners come from poor urban communities that are isolated by race and class, prison facilities are increasingly concentrated in impoverished rural areas. Footnote 32
Loic Wacquant traces the growth of penal institutions to the flight of low-skilled manufacturing jobs that made black labor expendable in the 1960s and 70s. Footnote 33 These sharp economic dislocations coincided with decaying commitments to a social safety net and reinvigorated efforts to deregulate markets and dismantle social policies. Although neoliberal, free-market rhetoric suggests a commitment to limited government, Wacquant and other critics point out that the very proponents of deregulation and privatization embraced extensive government surveillance and new penal institutions in order to support unregulated markets. Footnote 34 For instance, since the 1970s, policymakers passed new laws criminalizing behaviors likely to flourish in areas plagued by economic isolation and joblessness, including harsh criminal penalties for the sale and possession of narcotics, as well as anti-panhandling and anti-loitering ordinances. Footnote 35 In the 1980s and 1990s, criminal penalties became more punitive with the passage of Three Strikes laws requiring 25-year to life sentences for a third offense, including a drug violation or petty theft; 10-, 20-, and 30-year minimum sentences for violent, gun-related, and drug offenses; increased use of life without parole; and laws permitting the prosecution of juveniles as adults. Meanwhile, Congresses and administrations redirected federal resources for police activity and new prison construction. Even while a number of states are currently reducing penalties for marijuana offenses, many states and localities are also imposing new fines and fees for minor infractions, privatizing collection efforts, and criminalizing outstanding debt obligations—strategies that the shift the state’s fiscal costs onto the most economically disadvantaged residents and that construct a new class of incarcerated “criminals.” Footnote 36
Just as the outsourcing of production, state-subsidized suburbanization of jobs, and government disinvestment led to heightened poverty in urban areas, structural changes in the global economy also contributed to economic destabilization and decline in rural communities. Sharp declines in agricultural, logging, and mining sectors and changing state and federal revenue streams led to “pockets of persistent poverty” throughout many rural counties. Footnote 37 Victoria Lawson, Lucy Jarosz, and Ann Bond’s work on rural poverty suggests that many counties and towns in the rural Northwest responded to economic downturns by prioritizing market-based development policies designed to attract new investments, residents, and jobs—often at the expense of public investments for food, shelter, and healthcare. Footnote 38 Competition among rural communities for large infrastructure projects, including prisons, big-box retailers, corporate hog and dairy farms, and food processing plants, also depressed environmental regulations, corporate taxes, and wages. Many formerly middle-class residents of rural communities became poor or lower-class during a period of sharp deregulation and divestment. Footnote 39
As Ruth Gilmore shows, criminalization strategies and prison growth were not only a political response to heightened social disorder, but were also an expedient socioeconomic solution to the rise of idle farmland, surplus capital, and untapped labor among low-skilled workers. California’s large investments in prison development simultaneously exploited devalued rural land, identified a profitable use for finance capital, and reasserted the state’s governing capacity in a post-Keynesian political economy. Footnote 40 On a national scale, fewer than half of all prisons were located in non-metropolitan areas in the 1960s and 1970s; however, rural communities developed hundreds of new prisons during the 1980s and 1990s, accounting for the bulk of overall prison growth. Footnote 41 By the mid-1990s, rural prison projects constituted almost two-thirds of new prison development. Footnote 42 Meanwhile, the overall correctional population nearly doubled in size since 1990, even while violent crime rates declined steadily throughout major U.S. cities. Footnote 43
While projects such as prisons and nuclear power plants are often viewed as economic blights that decrease property values and deter more lucrative investments, the traditional NIMBY (“not-in-my-backyard”) response is most prevalent in what Lawson, Jarosz, and Bonds describe as “high amenity” environments. Footnote 44 High amenity communities, or “rural playgrounds,” enjoy natural assets that attract wealthy tourists, artists, and intellectuals. By contrast, low amenity communities, or “dumping grounds,” lack tourist attractions and must compete for large corporate investments. For rural communities impacted by a weak economy and diminished ability to provide social welfare relief, prison development offers a widely-coveted opportunity to boost employment and draw revenue. Footnote 45 In North Carolina, for example, the counties most likely to attract prisons to their communities exhibit greater economic need and more rural geography. Footnote 46
Heightened rural poverty not only created viable “dumping grounds” for prisons, but also encouraged more economically-disadvantaged areas to actively lobby for prison construction. Political elites in these communities clamored to offer land, infrastructure, and equipment to state governments and private companies in order to draw local prison construction. Footnote 47 As the Vice-President of Operations for CCA remarked, “We don’t have to sell [prison development] to a community. The community is knocking on our door. It used to be ‘not in my back yard.’ Now, they want it in the front yard.” Footnote 48 However, as former New York Corrections Commissioner Thomas Coughlin remarked, aggressive efforts to build prisons in small towns and remote regions also exacerbates spatial disparities between the places where inmates are sentenced and where they are incarcerated: “Prisons are viewed as the anchor for development in rural areas … We give our list to the [State] Legislature, and the next day I get back the list of where our prisons are going to be. They pick ’em … If we had our druthers, we’d locate all of our facilities in the metropolitan area, because that’s where most of our inmates come from … but why spend thousands of dollars in scarce state resources trying to convince a community to take a facility?” Footnote 49 Unlike metropolitan areas, correctional facilities often serve as one of the largest employers in rural communities, and lawmakers vigorously lobby to support them. Footnote 50
Yet, while rural communities scramble to compete for prison development, researchers overwhelmingly find that communities where prisons are built experience limited economic improvements. Footnote 51 Although correctional institutions create stable employment opportunities, prison-related jobs often require the skilled labor of people living outside the communities where the prisons are located, and the types of businesses that prisons attract are typically low-wage and service-based. Footnote 52 While private prisons hire non-union labor and have lower skill requirements, they typically pay much less than state and federal institutions. Finally, prisons fail to build social capital with host communities. Footnote 53 Instead, they engender a sense of fear and insecurity about an influx of outsiders (i.e., visiting friends and relatives of inmates) and heighten concerns about community safety. Footnote 54
Even though most research suggests that prisons do not draw additional social or economic capital in host communities, local lawmakers still have powerful interests in protecting these investments. Small towns and communities typically turn to prison construction because they lack other viable economic alternatives. Footnote 55 Given the chronic loss of employment and revenue, it is little surprise that prisons are widely viewed as a crucial anchor for economic development in declining, rural areas. Footnote 56 A local prison siting in an economically-depressed region promotes highly visible credit-claiming opportunities for policymakers to tout job creation and economic development. Footnote 57 Furthermore, political and business leaders tend to perceive improved economic conditions in rural counties with prison facilities, regardless of the actual economic impact. Footnote 58 The low levels of economic diversity and limited investment opportunities endemic in sparsely populated, rural communities creates disproportionate local reliance on existing employers to sustain jobs and revenue, while also simplifying the task of representing district interests. Footnote 59 These conditions discourage critical reevaluations of rural prison development and strengthen political support for rural prison investments.
Furthermore, prison sites can generate economic and political benefits that are far less visible to the general public. Since prisoners are officially counted as residents in the communities where they are confined—rather than the places where they last held an address—a large incarcerated population can reverse trends of population loss in rural areas and redistribute political power from urban to rural voters. Footnote 60 Census counts are not only used to establish the number of congressional, state, and local representatives that districts receive, but are also used to calculate funding formulas that determine the amount of federal dollars that state and local governments receive for various programs, including social welfare assistance, Medicaid, foster care, adoption assistance, and social security block grants. At the state level, funding allocations are also determined based on population counts from the census. Consequently, rural communities with large institutionalized populations increase their share of state and federal funding, while predominantly black and Hispanic urban districts lose resources and political standing. Footnote 61
Given the heightened political clout and “submerged” subsidies flowing to rural communities with penal institutions, the legislators representing these communities stand to gain electorally by supporting harsh criminal penalties that keep their prisons operating. While political elites who embrace “tough on crime” polices can self-select into districts where these views are already likely to resonate politically, their environment also promotes and reinforces more punitive worldviews. Although prison infrastructure helps sustain economically-vulnerable rural areas by furnishing jobs, revenue, and crucial wealth transfers, research also suggests that they fail to grow the economy or improve the quality of life.
A Preliminary Analysis: Modeling Legislative Support for Punitive Policies
To examine political support for penal policy systematically, I compiled a dataset consisting of the location, capacity, and year of origin for state, federal, and private prisons in California, New York, and Washington State from 2000–2010. Analysis of a comprehensive list of roll call votes proposing to strengthen or reform sentencing laws for non-violent offenses (e.g., property, drugs, theft, criminal trespass) in the New York, California, and Washington State legislatures from 2001–2010 afford a reasonable test of whether rural reliance on prison infrastructure promotes political support for more punitive policies. (Sentencing laws for violent crimes were excluded, given near-unanimous support for these measures.) The time period examined includes the most severe economic recession since the Great Depression, pervasive state fiscal crises, and notable shifts in public support for more lenient sentencing for non-violent offenses, and particularly for marijuana offenses. Footnote 62 This time period offers a unique opportunity to examine variation in political support for statewide initiatives to both strengthen and soften punishments for non-violent crimes.
The state legislature (upper and lower chambers) provides an appropriate focal point for this study. State legislatures are more appropriate than the U.S. Congress because the majority of people incarcerated in the United States are convicted of violating state law and are sentenced in state prisons. Moreover, national trends mask pronounced variation in state spending on criminal justice and imprisonment rates across states. Footnote 63 State legislative districts offer a greater case selection and more precise measure of constituency reliance than a county- or state-level analysis. Not only do the shorter terms of its members link legislators more closely to their constituencies, but also the districts are smaller and often more homogenous than the county or the statehouse, allowing for greater variability across cases.
Support for Punitive Sentencing Laws: New York, California, and Washington
The analysis consists of a comprehensive list of roll-call votes on sentencing laws for non-violent offenses taken in the New York (n=27), California (n=24), and Washington (n=15) state legislatures in 2001–2010 (n-=66). Footnote 64 Each bill forces legislators to take a position on a matter that influences the size of a state’s prison population. The dependent variable is members’ position on criminal sanctions for non-violent acts. A vote in favor of increasing punishment or opposing reforms was coded “1”; a vote opposing harsher forms of punishment and in favor of sentencing reform was coded “0.” A pooled measure captures the average score for each member in a legislative term (“penal support score”). The average penal support scores are continuous measures ranging from 0 to 1, where higher values indicate more support for punitive measures.
California, New York, and Washington were selected for several reasons. Following Vanessa Barker’s methodology and selection criteria, these cases include significant variation by region, penal history, and political structures, as well as significant differences in crime rates, racial composition, and ideology. Footnote 65 While each state experienced unprecedented levels of violent crime in the early 1970s, Footnote 66 they all pursued different imprisonment policies. California’s prison population is well above the national average, while New York and Washington fall below the mean. However, none of these states exhibit the very highest or lowest national imprisonment rates, but tend to reflect more general characteristics of U.S. imprisonment variation.
California’s prison population grew roughly 750 percent since the mid-1970s. Nine thousand offenders are currently serving life sentences under the Three Strikes law passed in 1994, including many whose “third strike” was a minor, non-violent offense. A revolving door between prison and parole lands 47 percent of inmates back in prison within one year of their release. Footnote 67 The dataset compiled for this study (details follow) reveals that over 98 percent of California’s state prisons are overcrowded, and many are filled at more than 200 percent capacity. In recent years, however, pervasive concerns about overcrowding (including a Supreme Court order to reduce overcapacity), a deep economic recession, and severe fiscal constraints have prompted a series of legislative initiatives to reduce imprisonment rates by softening punishments for non-violent offenses.
While New York’s prison population falls below the national average, the state imprisonment rate increased more than five-fold since the early 1970s. Footnote 68 Gubernatorial leaders and eager state legislators oversaw an unprecedented statewide prison expansion, more than doubling the number of prisons from 32 facilities in 1982 to 79 facilities in 2010. Each of the 40 new state prisons was built in predominantly rural, upstate regions, while an additional 7 private or federal facilities opened in (mostly) metropolitan areas. Since 2009, however, New York state leaders have successfully closed 13 prisons as part of an ongoing effort to reduce imprisonment rates. Meanwhile, the New York State Assembly debated an initiative to reform mandatory sentences for drug offenses and implement alternative treatment programs in every legislative session since 2001.
Despite a net increase in imprisonment since the 1970s, Washington state’s prison population ranks fortieth in the nation at 262 inmates per 100,000 population. Footnote 69 State leaders have historically placed lower emphasis on penal measures and instituted alternatives to incarceration, such as probation and waiver programs. Of the 33 prisons currently located in Washington, 15 are small, privately-contracted work-release programs that help reintegrate offenders into the community. In 2009, the state legislature passed a measure that softened medical marijuana restrictions, and Washington voters passed a referendum to legalize the possession and consumption of marijuana in a referendum three years later. Like New York and California, Washington state legislators debated proposals that both heighten and reduce penalties for property and drug-related crimes throughout this 10-year period. (Appendix 1 lists these bills and resolutions).
Measuring Rural Reliance on Imprisonment
Economic reliance.:
The percentage of correctional employment in a district would provide an optimal measure of local reliance on the prison sector. However, the Bureau of Labor Statistics does not report employment information at the state legislative district level, or any unit smaller than counties. Given these data limitations, an interaction term, prisons*population density, is employed to assess the conditional influence one or more prison industries within a more rural environment. The measure serves as a proxy for a district’s economic reliance on prison infrastructure.
Prison facilities.
Information on the statewide locations of state, federal, and private prisons affords a reasonable measure of the local prison sector. To create this measure, I collected original data on the street address, year of origin, number of prisoners, inmate capacity, and (where available) number of employees in all state, federal, and private prisons located in New York, California, and Washington, excluding local jails and halfway houses. The information was compiled in accordance with the 2000 and 2010 Census and draws from a variety of sources. Footnote 70 Every facility listed in the dataset was also cross-referenced using Google mapping tools. Substance-abuse facilities and halfway or transitional houses were excluded from the analysis. These search methods yielded 70 prisons in California, three of which have closed since 2000, and an average inmate population of 3,573 in 2012; 79 prisons in New York, 13 prison closures since 2000, and an average 2012 inmate population of 1,016; and 18 prisons plus 15 work-release facilities in Washington State, one prison closure since 2000, and an average inmate population of 1,252 (excluding work-release centers). The data were transformed to the state legislative district level, for both the upper and lower chambers, using Geographic Information System (ArcGIS) software based on 2002 redistricting plans. The variable is coded based on the number of prison facilities per district. Footnote 71
Population density.
Population density provides an appropriate gauge for rural/urban geography that is available at the state legislative district level. Footnote 72 Specifically, lower levels of population density indicate more rural geography and less industrial diversity, and hence, greater reliance on major industries to generate and sustain employment and revenue. Footnote 73 The variable captures the same underlying characteristics as a multivariate measure for economic diversity calculated at the county level. Footnote 74 To create the measure, I calculated the overall district population divided by area per square mile (based on 2000 and 2010 U.S. Census figures).
Alternative Explanations
The models also control for a number of important covariates. These variables help ensure that any observed relationship between rural reliance on prison infrastructure and legislators’ support for punitive sentencing laws is not driven by other demographic, institutional, or ideological factors.
Crime and arrest rates.
The total annual per capita crime and arrest rates for drug offenses, violent offenses, and total offenses were compiled using New York, California, and Washington Criminal Justice Department databases. Footnote 75 The data were transformed from the county to state legislative district level (upper and lower chambers) using Geographic Information System (GIS) overlay analysis based on 2002 redistricting plans.
Demographic characteristics.
Information on the racial composition, educational attainment, poverty rate, unemployment rate, and median income were compiled at the state legislative district level using American Fact Finder and American Community Survey data, accessed from the 2000 and 2010 U.S. Census Bureau. These measures are all reported as percentages in order to standardize the data across units.
Legislator ideology.
Shor and McCarty’s legislative ideology scores capture a mix of partisan, constituency, and ideological factors that influence state legislators’ aggregate voting behavior. The scores are employed as a control for members’ conservative predispositions. Footnote 76
District ideology.
The percent Democratic vote share in the 2000, 2004, and 2008 elections is employed as a proxy for constituency ideology. The measure was derived using county election data and transformed to the state legislative district level using GIS overlay analysis.
Partisanship.
While Republican Party leaders pioneered strategies to label the party as “tough on crime” and a reliable steward of public safety, Democrats quickly followed suit. The models include a members’ partisanship to examine whether the political parties deviate or converge on votes regarding non-violent sentencing laws throughout the time period under study (coded “1” for Republican, “0” for Democrat, and “0.5” for Independent). Footnote 77
Modeling Techniques
In analyses of prison sitings, the dependent measure is count variable consisting of the number of prisons in a state legislative district. As count variables, these distributions are highly skewed, with the majority of districts receiving no prison infrastructure. Ordinary least squares (OLS) regression is not appropriate because the data are not normally distributed. Instead, negative binomial regression is used to examine the locations of prison sites in 2010 (excluding correctional facilitates that closed down in the previous decade).
A time series analysis of legislators’ support for punitive sanctions is not employed because an overwhelming bipartisan convergence in favor of criminalization in the early 2000s masks substantial variation across states, years, and specific legislative initiatives. Instead, pooled regressions (by year) and logit models of specific roll call votes allow for increased granularity, greater precision, and accurate interpretations. Members’ penal support scores (pooled by year) are continuous measures (scale 0 to 1), and multiple regression using ordinary least squares (OLS) is appropriate (refer to Appendices 5 and 7). As stated, many of the votes in the dataset exhibit either near-unanimity or strict partisan divisions and therefore lack sufficient variation for individual analysis. In fact, from 2001–2006, Democrats and Republicans often aligned in support of punitive sanctions, minimizing variation in voting patterns. However, a historic recession, impending state fiscal crises, increasingly lenient public attitudes toward marijuana consumption, and a court order to reduce prison overcrowding in California also catalyzed a slate of penal reforms that fueled increasing intra-party divisions on sentencing reforms.
A number of proposals to strengthen or soften penalties for drug possession (and several votes regarding property offenses) exhibit greater variation and intra-party disagreement, especially among Democratic legislators (refer to Appendix 1). To examine the collapse of bipartisan support for punitive sanction with greatest possible precision, the votes that yielded inter- or intra-party dissensus (not unanimous, near-unanimous, or party-line) are all analyzed separately. In these models, a dummy measurement is employed as the dependent variable, and ordinary least squares (OLS) assumption of uniform distribution of variance is violated. Logistic regression maximizes the likelihood of observing a punitive vote (refer to Appendices 4, 5, and 8). For meaningful interpretation, I display figures exhibiting the expected and predicted values of observing a pro-penal vote when population density and prison facilities are set to high, medium. and low values using CLARIFY. Footnote 78
Explaining the Persistence of Mass Imprisonment
Rural Biases in Prison Development
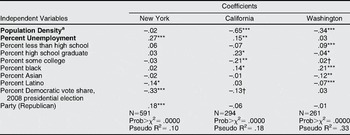
Table 1 displays the predicted probability of observing a prison siting across legislative districts in New York, California, and Washington in 2010 (given a one standard deviation change). As shown in the table, prisons are most heavily concentrated in districts with high unemployment levels (p < .01, NY, CA), a higher percentage of residents without a high school degree (p < .001, WA), and more rural geography (p < .001, CA, WA). Although New York State prisons are not disproportionately located in rural districts, this regional variation is likely a holdover from earlier periods of prison construction. From 1982–2010, New York constructed 40 new state prisons, all of which were built in upstate rural regions. This wave of rural prison construction not only shifted prison development away from predominantly metropolitan areas where most inmates are from, but also located prisons in districts that are over-represented by Republican state legislators, all else equal (p < .001).
Negative binominal regression analysis of the effect of economic need on locations of prison sites in New York, California, and Washington, 2010

Note: Entries are predicted probabilities associated with the negative binomial regression analysis in (indicating a one standard deviation change). The dependent variable is the number of state, federal, or private prisons in a state legislative district.
a In thousands.
*** p<.001; **p<.01; *p<.05; †p<.10 (two-tailed test).
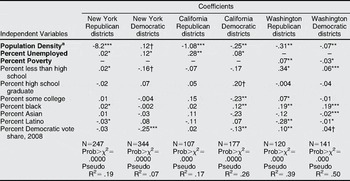
To examine partisan variation, table 2 displays the predicted probability of observing a prison siting in districts represented by Democratic and Republican legislators, respectively. In New York State’s Democratic districts, prisons are clustered in more metropolitan, urban spaces (p< .10). However, when isolating Republican-held districts, prisons are overwhelmingly concentrated in more rural places (p< .001). New York State prisons are disproportionately located in areas with higher unemployment rates regardless of partisanship (p< .05). Although the models do not reveal whether districts subject to high unemployment are more likely to bid for prisons or if prison facilities lead to greater unemployment, the finding does suggest that prison communities are more economically vulnerable than other places.
Negative binomial regression analysis of the effect of economic need on locations of prison sites in New York, California, and Washington, by Partisanship, 2010

Note: Entries are predicted probabilities associated with the negative binomial regression analysis in (indicating a one standard deviation change). The dependent variable is the number of state, federal, or private prisons in a state legislative district.
a In thousands
*** p<.001; **p<.01; *p<.05; †p<.10 (two-tailed test)
In California and Washington, the districts that house prisons exhibit similar characteristics across both Democratic- and Republican-controlled districts. As expected, California’ s prisons are more heavily concentrated in rural districts (p< .01) and places with larger share of unemployed residents (p< .05), controlling for other factors. The finding is consistent across both Democratic and Republican districts. Similarly, Washington’s prisons predominantly cluster in rural districts (p< .01), areas with higher levels of poverty (p< .01), Footnote 79 and places where a larger share of residents lack a high school diploma (p< .05). Washington’s prisons are also located in districts with a larger share of black residents (p < .01)—a counterintuitive finding that may reflect the practice of counting prisoners as residents in the places where they are incarcerated. These findings corroborate studies conducted in the 1980s and 1990s suggesting that prisons are disproportionately located in districts with greater economic need and lower levels of social capital and mobility.
Political Support for Punitive Sentencing Laws
To examine the political consequences of these patterns of rural prison development, Appendices 4–8 display the effect of prison infrastructure on state legislators’ support for more punitive drug and property laws in New York, California, and Washington, respectively. An interaction term, prisons*population density, is employed to gauge the effect of prison sites in urban and rural areas. Footnote 80 While the models exhibit a statistically meaningful relationship between the existence of prison infrastructure (prisons) and greater political support for punitive sentencing policies in most of the cases examined, the interactive coefficients do not convey the magnitude of the influence or substantive meaning of the finding. For more meaningful interpretation, figures 1–4 display expected and predicted values of observing political support for punitive laws in rural, semi-rural and urban areas with a low (zero), medium (1–2) and large (maximum) number of prisons in a district. (All expected values, predicted values, and first differences displayed are statistically significant at the 95 percent confidence level. All control variables are held constant at their respective mean values.)
Estimated influence of prison economy on New York state legislators’ opposition to drug law reforms, 2007–2008
Note: Figure 1 displays predicted values calculated by the author from the logit analysis in Appendix 4 using CLARIFY. Population density is set to its ninth decile (urban), first quartile (semi-rural), and first decile (rural). The number of prisons is set to its minimum, mid-range, and maximum value. All values displayed are statistically significant at the 95 percent confidence level. All control variables are held constant at their sample means.

Figure 1 exhibits the estimated effect of prison infrastructure within a rural, semi-rural and urban district on New York State legislators’ opposition to a comprehensive drug law reform law reintroduced in the 2007–2008 legislative session. The legislative measure, AB0663, proposed to institute drug treatment programs and reform mandatory sentencing laws, but failed by a vote of 82–117. (The predicted values are calculated from the logit model located in Appendix 4.)
Controlling for legislators’ ideological predispositions and other factors likely to influence their positions, rural and semi-rural areas with the largest prison capacity exhibit overwhelming opposition the comprehensive drug reform bill, with an estimated near-100 percent likelihood of voting against the measure. At the same time, state legislators representing rural and semi-rural districts with a large prison capacity (two prisons) display nearly 90 percent likelihood of voting against the reform measure. Their rural and semi-rural counterparts in districts without any prison infrastructure exhibit about a 60 percent likelihood of joining their ranks to defeat the bill. The probability of observing opposition to drug reform declines slightly, to about 75 percent, in urban areas with two prisons. Opposition falls precipitously in urban areas with no prisons, where legislators exhibit about 40 percent likelihood of blocking the reform measure, all else equal.
While Republican legislators maintained strong party unity in opposition to drug reform regardless of the composition of their districts, Democrats’ voting patterns exhibit far greater variation than their Republican counterparts—perhaps due to greater cross-pressures between partisan and constituency factors. As shown in figure 2, a rural prison economy is one of the most important factors encouraging Democratic legislators to break rank with their partisan allies and oppose comprehensive drug reform (Appendix 4, p < .05).
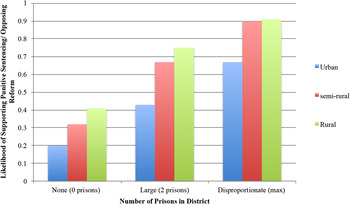
Estimated influence of prison economy on Democratic state legislators' opposition to drug law reforms, New York State, 2007–2008
Note: Figure 2 displays predicted values calculated by the author from the logit analysis in Appendix 4 using CLARIFY. Population density is set to its ninth decile (urban), first quartile (semi-rural), and first decile (rural). The number of prisons is set to its minimum, mid-range, and maximum value. All values displayed are statistically significant at the 95 percent confidence level. All control variables are held constant at their sample means.

All else equal, Democrats representing rural districts with a concentrated prison economy exhibit about a 91 percent likelihood of opposing the drug reform bill, compared to 75 percent likelihood in rural areas with two prisons and only 40 percent probability of opposition in rural areas with no prisons at all. Democratic legislators representing semi-rural areas show similar patterns, shifting from 90 percent probability of voting against the reform in areas with disproportionately large prison economy to 67 percent in areas with two prisons, and plummeting to 30 percent in semi-rural districts without any prison sites. Controlling for legislators’ predispositions, demographic characteristics, and other factors, Democratic legislators representing urban districts exhibit the least punitive sentiments (shifting from about 67 percent likelihood of opposing the drug reform in districts with multiple prisons and only 20 percent probability in urban settings with no prisons at all).
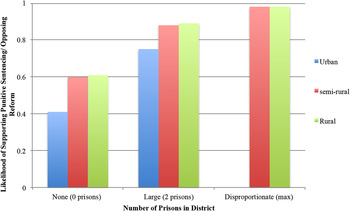
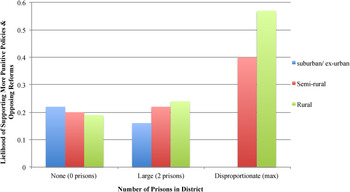
These patterns are not limited to New York State. A rural prison economy is also associated with heightened political support for more retributive sentencing laws in California (refer to Appendices 6 and 7). Given strong Republican support for punitive policies, the effect of a prison economy is also more pronounced among Democrats (Appendix 5, p< .01). To compare these results, figure 3 displays the expected values of observing Democratic state legislators’ support for punitive drug and property crimes in 2009–2010, given a varying number of prisons within a rural, semi-rural, and suburban/exurban setting. Footnote 81
In 2009, California state legislators considered initiative AB358, a measure allowing judges to determine whether defendants are eligible for deferral in drug-related cases. Footnote 82 The law permits judges to side step the state’s strict mandatory sentencing requirements in certain circumstances. The vote was introduced in the context of severe prison overcrowding, chronic budget deficits, and otherwise dire fiscal conditions, and is part of a broader effort to curb the state’s overflowing prison population. While the bill passed by a narrow margin (67–50), legislators representing rural districts with a prison economy were heavily over-represented among the legislative coalition opposing the bill (Appendix 6, p < .10). Footnote 83 (Appendix 1 lists details on each roll call vote; Appendix 6 contains the logit models associated with these votes).
Estimated influence of prison economy on Democratic state legislators' support for more punitive drug and property laws, California, 2009–2010
Note: Figure 3 displays predicted values calculated by the author from the regression analysis in Appendix 7 using CLARIFY. Population density is set to its second quartile (suburban/ex-urban), first quartile (semi-rural), and first decile (rural). The number of prisons is set to its minimum, mid-range, and maximum value. All values displayed are statistically significant at the 95 percent confidence level. All control variables are held constant at their sample means.

As figure 3 shows, Democratic state legislators representing rural districts with a disproportionately large prison economy bucked their party and voted to maintain punitive policies nearly 60 percent of the time. Democratic support for continuing punitive sanctions fell below 30 percent in rural areas with several prisons. Democrats’ punitive sentiments follow similar, but slightly more muted, trends in prison communities with semi-rural geography. Conversely, Democratic state legislators representing districts without any prison infrastructure exhibit comparably low levels of support for harsh sentencing laws, regardless of population density—about 20 percent, all else equal.
The relationship between prison investments and political support for state sentencing laws exhibits the least consistency in Washington State—perhaps because Washington contains relatively few prisons overall and no more than two prisons in any state legislative district. Footnote 84
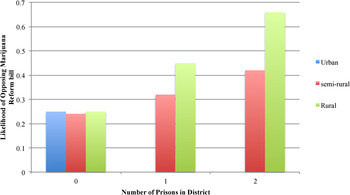
However, the presence of rural prison infrastructure is associated with greater legislative obstruction on a proposal to soften medical marijuana laws that came to a floor vote in Washington State in 2009 (Appendix 8, p<. 10). The legislative initiative, SB5798, came to a vote three years before the historic statewide referendum legalizing the consumption of marijuana. Legislators representing constituencies that are more economically reliant on local prison infrastructure were more likely to oppose the measure and vote to retain existing penal sanctions for medical marijuana violations. Figure 4 displays the magnitude of this influence within an urban, semi-rural, and rural district.
Estimated influence of prison economy on Washington state legislators' opposition to marijuana reform, 2009–2010
Note: Figure 4 displays predicted values calculated by the author from the logit analysis in Appendix 8 using CLARIFY. Population density is set to its ninth decile (urban), first quartile (semi-rural), and first decile (rural). The number of prisons is set to its minimum, mid-range, and maximum value. All values displayed are statistically significant at the 95 percent confidence level. All control variables are held constant at their sample means.

As shown earlier, legislators representing rural areas with two prisons exhibit the strongest opposition to the marijuana reform bill with about 66 percent likelihood of observing a vote against the bill. The level of opposition declined markedly to 45 percent in rural areas with one prison and to 25 percent in rural areas without any prisons. Similar to California, state legislators representing districts with no prisons display comparably low levels of opposition to the measure, regardless of population density (roughly 25 percent).
While these findings demonstrate that legislators from districts that house prisons routinely vote to pass policies that keep prisons operating at full capacity, the models do not reveal whether these lawmakers support punitive sentencing laws in order meet local economic and political imperatives, if they develop “law-and-order” attitudes because of their local environment, or if pro law-and-order elites strategically run for office in districts with large prison capacities. Although it is not possible to empirically rule out any of these interpretations, a more nuanced interpretation suggests that the convergence of economic, political, and ideological imperatives are all self-reinforcing. These factors not only trump budgetary concerns and partisan pressures, but also empower a subset of legislators and voters who militate against penal reform.
Submerged State Politics
Although the American public is generally critical of government activity and dependence on the state, political scientist Suzanne Mettler demonstrates that many constituencies routinely benefit from government policies that are obscured from public view. Footnote 85 Just as “submerged” fiscal benefits administered through subsidies disproportionately advantage privileged groups, evidence presented here suggests that submerged components of the criminal justice system also provide short-term benefits for rural prison communities. As a consequence, rural lawmakers systematically vote for policies that bolster expensive and expansive state action in the domains of discipline and punishment, and these policies reproduce racial, class and spatial hierarchies in ways that are largely invisible to the general public.
New York, California, and Washington experienced distinct penal histories and currently face varying political, legal, and budgetary pressures. However, while all three states are introducing new sentencing reforms with varying degrees of urgency, state lawmakers representing rural districts with prison infrastructure consistently comprise one of the most powerful voting blocs opposing penal reform efforts. Although these patterns are weakest in Washington State, the fact that there are far fewer prisons in Washington than in California or New York suggests that fewer state legislative districts stand to materially benefit from prison spending in the first place.
These findings are consistent with a rich tradition of scholarship demonstrating that political representatives work to secure their reelection by voting for programs that advance the core economic and material interests of their voters. Legislators promote spending crucial to local employment and revenue, such as military programs and farm subsidies, and seek out opportunities to prioritize these issues and influence policy outcomes. Footnote 86 However, while most forms of targeted government spending promote local economic development and generate some positive externalities, prisons impose uniquely burdesome social costs for a very limited economic return and questionable improvements in overall public safety. Footnote 87
Evidence suggesting that a subset of lawmakers routinely prioritize submerged benefits flowing to dependent rural prison communities illustrates a particularly perverse form of path dependence reinforcing carceral punishment. While the analysis builds on E.E. Schattenschneider’s claim that “new policies create new politics,” this new politics systematically undermines core tenets of democracy and citizenship for dubious economic, social, or security benefits. Rather, initial investments in rural prison construction inadvertently tied the base subsistence and short-term material gain of a subset of rural legislators and districts to the continued confinement and social exclusion of another subset of vilified and marginalized citizens. Those affected by aggressive imprisonment policies routinely suffer long-term social harm, including the permanent (or semi-permanent) loss of voting rights, reduced access to employment and damaged sense of civic membership and belonging—all of which are particularly devastating for African-American communities. Footnote 88 This targeted societal suffering suggests that rural prison development constitutes an especially virulent social dynamic linking rural subsistence to the political and social exile of disproportionate numbers of racial minorities located in isolated urban districts. Just as liberal principles of individual choice, agency, and contract can be repurposed to promote laws that reinforce exclusionary strictures, Footnote 89 this perverse component of democratic politics perpetuates racial, class, and spatial inequalities, while eroding legal guarantees of democratic inclusion.
Implications: Democracy, Citizenship & Inequality
While the growth of a carceral state enforces penal responses to problems endemic in low-wage urban labor markets, an expansive prison apparatus has also become a political remedy for rural poverty in an increasingly deregulated, globalized economy. Scholarship highlighting the central impact of the criminal justice system in the urban ghetto neglects its dual role throughout impoverished, rural communities. Rural prison development supplies jobs, revenue, and crucial wealth transfers in particularly vulnerable areas, tying the immediate stability of lower-class, rural whites to the continued incarceration of predominantly poor urban minorities.
New evidence shown here indicates that political representatives in more rural areas with prison infrastructure support punitive criminal justice policies more than their partisan allies and their rural counterparts without any prison sites. The influence of the rural prison apparatus is particularly crucial for understanding recent intra-party divisions on sentencing laws among Democratic state legislators. While many Republican lawmakers routinely support harsh criminal penalties for drug and property offenses regardless of the composition of the districts, Democrats increasingly face cross-pressures between their party leadership’s initiatives to curb state imprisonment, on one hand, and the political and economic imperatives of their districts on the other. While partisanship is the most important factor explaining state legislators’ support for harsh penal policies, rural investments in prison infrastructure also reinforce political support for punitive sentencing laws.
Conversely, correctional facilities located in metropolitan areas do not consistently shape legislators’ decision-making on penal policies, perhaps because these prisons are not a vital component of the local economy. In fact, local prisons may even impede more lucrative commercial investments and slow residential growth in more urbanized locations. Rather, prison development in economically-vulnerable rural spaces strengthens policymakers’ retributive views, which contributes to ongoing incarceration rates. Meanwhile, increasing supplies of inmates in rural prisons manufacture continued demand for prison growth.
These political interests in carceral punishment are not only submerged from public view, but also undermine American democracy in ways that are often largely invisible to the general public. First, the aggressive use of imprisonment creates different experiences of citizenship and belonging across racial, class, and geographic categories. Furthermore, the practice of counting inmates as residents of the places where they are involuntarily confined violates the principle of political equality and republican guarantee of consent of the governed by empowering rural whites to “speak for” the politically dispossessed populations behind bars. Finally, incarceration splinters citizenship across racial and spatial boundaries, upholding the stability of economically disadvantaged rural whites at the disproportionate expense of disempowered urban minorities. These practices not only degrade civic trust, but also heighten social antagonisms and repress alternative discourses of equity and empathy. Evidence indicates that the prison apparatus contributes to the perceived economic viability and political power of rural areas, while reinforcing forms of punishment that destabilize poor urban neighborhoods and harm politically marginalized populations.
Supplementary Materials
-
Explanatory File
-
Appendices 1–8
-
Code for replicating results