Introduction
Bipolar-I-disorder (BD-I) is one of the three most reliable diagnoses in psychiatry and this bipolar disorder (BD) subtype has superior predictive validity for future disease course and outcome (First, Reference First2016). The clinical presentation of BD-I is primarily characterized by changes in mood, cognition, energy, and rest–activity cycles (Scott et al., Reference Scott, Murray, Henry, Morken, Scott and Angst2017). In its most severe form, it is associated with considerable morbidity, all-cause premature mortality, and high risk of suicide (Whiteford et al., Reference Whiteford, Degenhardt, Rehm, Baxter, Ferrari and Erskine2013). The key aim for clinicians and researchers is to enhance early identification of BD cases and improve the effectiveness of secondary and tertiary prevention. This has fostered discussions regarding the prospects for more personalized approaches to BD-I, i.e. tailoring diagnostic and treatment decisions to each patient by utilizing the information about the clinical phenotypes and genotypes (Scott, Etain, & Bellivier, Reference Scott, Etain and Bellivier2018).
It is widely acknowledged that BD-I is highly heritable (Smoller & Finn, Reference Smoller and Finn2003), but to date, there is no clearly defined disease signature and current animal models that demonstrate low predictive power (Bellivier et al., Reference Bellivier, Geoffroy, Scott, Schurhoff, Leboyer and Etain2013; Frey et al., Reference Frey, Andreazza, Houenou, Jamain, Goldstein and Frye2013). There is emerging evidence that genes involved in the regulation of sleep–wake cycles and circadian rhythmicity (CR) may be implicated in the pathogenesis of BD-I (Barnett & Smoller, Reference Barnett and Smoller2009; Etain, Milhiet, Bellivier, & Leboyer, Reference Etain, Milhiet, Bellivier and Leboyer2011; Lewis et al., Reference Lewis, Richards, Karlsson, Leonenko, Jones and Jones2020). For instance, Pagani et al. (Reference Pagani, St Clair, Teshiba, Service, Fears and Araya2016) identified that there were several heritable phenotypes related to rest–activity timing in pedigrees with BD-I, with the strongest linkage for the phenotype ‘inter-daily stability’ (IS), but also evidence of fragmentation of activity patterns and lower overall daytime activity. Associating BD and rest–activity rhythms (a term used for CR and sleep–wake patterns) has considerable appeal, as it corresponds with clinical observations of the nature, timing and intensity of motor activity in relapse prodromes and acute episodes of BD (McClung, Reference McClung2013; Scott et al., Reference Scott, Murray, Henry, Morken, Scott and Angst2017; Takaesu et al., Reference Takaesu, Inoue, Ono, Murakoshi, Futenma, Komada and Inoue2018). Several meta-analyses identify that individuals with BD show different sleep patterns compared with healthy controls (e.g. De Crescenzo, Economou, Sharpley, Gormez, and Quested, Reference De Crescenzo, Economou, Sharpley, Gormez and Quested2017; Geoffroy et al., Reference Geoffroy, Scott, Boudebesse, Lajnef, Henry and Leboyer2015). However, many reviews highlight that most studies are small-scale, short-term (actigraphy duration <10 days) and/or largely focused on sleep quantity (SQ) metrics (e.g. total sleep time (TST), sleep onset latency (SOL), etc.); most failed to measure variability in sleep–wake cycles or circadian dysregulation (Scott et al., Reference Scott, Murray, Henry, Morken, Scott and Angst2017). These weaknesses are now being addressed and there appears to be some consistency in sleep–wake phenotypes associated with BD (Krane-Gartiser et al., Reference Krane-Gartiser, Scott, Nevoret, Benard, Benizri and Brochard2019). For example, a community-based study by Shou et al. (Reference Shou, Cui, Hickie, Lameira, Lamers and Zhang2017) reported that individuals with BD-I demonstrated dysregulated 24-h rest–activity cycle (both median activity counts and variability) compared with healthy controls and other mood disorders. Using data from the UK Biobank, Lyall et al. (Reference Lyall, Wyse, Graham, Ferguson, Lyall and Cullen2018) highlighted that lower relative amplitude (Rel_Amp) (indicative of disrupted CR) was associated with greater lifetime risk of BD-I.
Despite the encouraging findings noted above, the lack of direct comparisons between BD and other major mental disorders, such as psychosis, make it premature to employ these putative rest–activity rhythm traits in precision diagnostics (Meyer et al., Reference Meyer, Faulkner, McCutcheon, Pillinger, Dijk and MacCabe2020). However, regulation of circadian rhythms has been shown to stabilize mood state (and vice-versa) (Walker, Walton, DeVries, & Nelson, Reference Walker, Walton, DeVries and Nelson2020), and the efficacy of many recommended pharmaco- and psychotherapies may be determined by their capacity to alter rest–activity patterns (Bellivier, Geoffroy, Etain, & Scott, Reference Bellivier, Geoffroy, Etain and Scott2015). It is useful to consider whether measures of the sleep–wake cycle and circadian expression might be used to evaluate treatment response or to improve personalization of treatment choices (McCarthy, Nievergelt, Kelsoe, & Welsh, Reference McCarthy, Nievergelt, Kelsoe and Welsh2012; Scott et al., Reference Scott, Etain and Bellivier2018), and if so, whether some rest–activity metrics are more useful than others. This is worthwhile as a critical component of the treatment of BD-I is the prevention of relapse/recurrence. Yet whilst international clinical practice guidelines recommend lithium (Li) as a first-line mood stabilizer (Kessing et al., Reference Kessing, Bauer, Nolen, Severus, Goodwin and Geddes2018), only about 33% of patients report an optimal outcome and variability in Li response is poorly understood (Scott et al., Reference Scott, Etain, Manchia, Brichant-Petitjean, Geoffroy and Schulze2019a; Reference Scott, Hidalgo-Mazzei, Strawbridge, Young, Resche-Rigon and Etain2019b). Given this dilemma, several research consortia are exploring genetic variants associated with clinical response phenotypes for Li (Hou et al., Reference Hou, Heilbronner, Degenhardt, Adli, Akiyama and Akula2016; Schulze et al., Reference Schulze, Alda, Adli, Akula, Ardau and Bui2010). International collaborations have recruited large cohorts of BD cases to genome-wide association studies (GWAS) of Li response, with individual research centres contributing smaller-scale studies using in vitro cell lines collated from clinical cases. The latter have indicated that circadian clock genes, chronotype and cellular circadian rhythms may predict Li response (Geoffroy et al., Reference Geoffroy, Curis, Courtin, Moreira, Morvillers and Etain2018; McCarthy et al., Reference McCarthy, Wei, Nievergelt, Stautland, Maihofer and Welsh2019). However, there is a lack of in vivo research to link real-time objective measurements of rest–activity rhythms and course of illness in Li-treated patients with clinical response phenotypes being examined in the GWAS or findings from in vitro studies (Scott et al., Reference Scott, Etain, Manchia, Brichant-Petitjean, Geoffroy and Schulze2019a; Reference Scott, Hidalgo-Mazzei, Strawbridge, Young, Resche-Rigon and Etain2019b). This is likely to change in the future, and indeed it is noteworthy that research domain criteria publications identify rest–activity rhythms as part of a core domain (in the arousal and regulatory system) and propose that longitudinal studies of actigraphy can be an important ‘unit of analysis’ (Insel, Reference Insel2014).
Actigraphy is widely used in psychiatry research, especially in BD. We identified 17 publications over about 45 years that reported ecological monitoring of rest–activity parameters alongside clinical outcomes or treatment response. Early studies had methodological limitations (with some using an early telemetric prototype of current actiwatches) but, even though more recent studies demonstrate superior research quality, the median number of BD cases is only 10. Four studies examined acute rather than prophylactic treatment of BD (none were about Li): two noted that changes in SQ [e.g. TST and sleep efficiency (SE)] were associated with good episode outcome (Henriksen et al., Reference Henriksen, Gronli, Assmus, Fasmer, Schoeyen and Leskauskaite2020; Kim, Lee, Lee, & Cho, Reference Kim, Lee, Lee and Cho2014), another reported change in circadian rhythms (phase shift) was the best predictor of a good outcome for BD depression (Benedetti et al., Reference Benedetti, Dallaspezia, Fulgosi, Barbini, Colombo and Smeraldi2007) and the fourth identified change in both SQ and phase was associated with outcome (Moon et al., Reference Moon, Cho, Son, Geum, Chung and Kim2016). However, sleep variability (SV) parameters were not reported and/or studies relied on relatively brief actigraphy recordings (mitigating against variability assessment). Other research explored the course of illness rather than treatment effects per se, and noted that some improvement in objective SQ parameters can accompany clinical improvement; however, earlier relapse or rehospitalization was associated with greater intra-individual variability in SQ, more disorganized rest–activity patterns and circadian dysrhythmias (Novak, Albert, & Spaniel, Reference Novak, Albert and Spaniel2014; Salvatore et al., Reference Salvatore, Ghidini, Zita, De Panfilis, Lambertino, Maggini and Baldessarini2008; Scott, Reference Scott2011). Longitudinal actigraphy data from 12 individuals identified a relationship between BD and fractal regulation of motor activity (a measure of adaptability/flexibility of physiological systems), although the investigators highlighted that it may be a stronger diagnostic than a prognostic marker (Knapen et al., Reference Knapen, Li, Riemersma-van der Lek, Verkooijen, Boks and Schoevers2020). Interestingly, the early studies were most likely to report associations between the introduction or withdrawal of Li and change in one or more markers of rest–activity patterns (Heninger & Kirstein, Reference Heninger and Kirstein1977; Klein, Mairaz, Pascal, Hefez, & Lavie, Reference Klein, Mairaz, Pascal, Hefez and Lavie1991; Reference Klein, Lavie, Meiraz, Sadeh and Lenox1992; Kripke, Mullaney, Atkinson, & Wolf, Reference Kripke, Mullaney, Atkinson and Wolf1978; Reference Kripke, Judd, Hubbard, Janowsky and Huey1979; Kupfer, Weiss, Foster, Detre, & McPartland, Reference Kupfer, Weiss, Foster, Detre and McPartland1974; Weiss, Foster, Reynolds, & Kupfer, Reference Weiss, Foster, Reynolds and Kupfer1974; Wolff, Putnam, & Post, Reference Wolff, Putnam and Post1985).
To summarize, the evidence suggests that heritable circadian phenotypes may be associated with a lifetime risk of BD-I. The rest–activity rhythms are characterized by lower stability, greater variability, and/or more disorganized 24-h rest–activity cycles; reduced activity and circadian adaptability; and less consistently by changes in some elements of SQ. More circumscribed, small-scale studies show that improvement in some of these parameters can be associated with treatment response or disease course. The rest–activity markers can be measured objectively using actigraphy, but to date, no ecological study has assessed all these variables simultaneously to determine which may be more robustly associated with the outcome of Li prophylaxis.
In this study, we identified a cohort of individuals with BD-I who were all being prescribed Li as an ongoing prophylactic treatment, assessed Li response phenotypes using the same instruments employed in genetic and in vitro research, and undertook an extended period (21 days) of actigraphy recording to address the following questions:
1) Do any rest–activity metrics, as measured using actigraphy, demonstrate statistically significant associations with Li response status?
2) Is there a pattern to the variables associated with good response to Li, e.g. do the parameters best represent SQ, SV, or CR?
3) What is the magnitude of any association between composite measures of SQ, SV, or CR and good response to Li?
Methods
The research received ethical approval from the Comite de Protection des Personnes, Ile de France (IDRCB2008/AO1465/50 VI; Pitie Salpetriere 118–08) and complies with the revised Declaration of Helsinki on research involving humans. All study participants gave written informed consent.
Sample
Individuals with BD attending psychiatric clinics affiliated to the University of Paris were invited to participate in a series of projects involving the use of actigraphy, below we describe the eligibility criteria for this cohort study.
Inclusion criteria were: (1) age > 18 years and willing and able to give written informed consent; (2) evidence of a mood disorder meeting diagnostic criteria for BD-I according to DSM-IV; (3) being prescribed Li for long-term prophylaxis (i.e. as a mood stabilizer, not an acute treatment); (4) attending a psychiatric outpatient clinic; (5) euthymic for ⩾ 3 months prior to and 21 days during which actigraphy recordings were undertaken [defined as a score <8 on the Montgomery-Asberg Depression Rating Scale (MADRS) (Montgomery & Asberg, Reference Montgomery and Asberg1979) and Young Mania rating scale (YMRS) (Young, Biggs, Ziegler, & Meyer, Reference Young, Biggs, Ziegler and Meyer1978)] and no changes were made during this period in the class or dose of any prescribed psychotropic medications.
Exclusion criteria were: (1) hospitalization for any reason during the 3 months prior to interview; (2) diagnosed with ongoing alcohol or substance use disorder; (3) diagnosed with an ongoing sleep disorder (e.g. sleep apnoea, narcolepsy, restless leg syndrome), and/or undertaking shift works and/or reported recent trans-meridian air travel; (4) reported a recent major life event (e.g. pregnancy, childbirth or bereavement) and/or diagnosed with a medical condition known to be associated with sleep disruption.
Clinical assessment
Eligible individuals participated in a clinical assessment undertaken by a psychiatrist trained in the use of the diagnostic interview for genetic studies (DIGS; Nurnberger et al., Reference Nurnberger, Berrettini, Tamarkin, Hamovit, Norton and Gershon1988). The assessor first confirmed the diagnosis of BD-I, then gathered key demographic, clinical and treatment information via the DIGS structured assessment and examination of existing case records. The following data were extracted:
a) Basic demography (age, sex) and body mass index (BMI) in kg/m2.
b) History of BD-I: age at onset, number of episodes.
c) Prescribed medications: number of psychotropic medications prescribed and use of adjunctive mood stabilizers (anticonvulsants or atypical antipsychotics) alongside Li.
Lithium response
The Retrospective Assessment of Response to Lithium Scale (which we will refer to as the Alda scale) is the most widely used measure of the Li response phenotype, being employed in international multi-centre collaborative research on genetics and large-scale clinical studies (Hou et al., Reference Hou, Heilbronner, Degenhardt, Adli, Akiyama and Akula2016; Manchia et al., Reference Manchia, Adli, Akula, Ardau, Aubry and Backlund2013; Scott et al., Reference Scott, Etain, Manchia, Brichant-Petitjean, Geoffroy and Schulze2019a; Reference Scott, Hidalgo-Mazzei, Strawbridge, Young, Resche-Rigon and Etain2019b). Information for the whole time during which the individual is prescribed Li is examined to make a rating of response to prophylaxis (including consideration of the duration of Li prophylaxis, adherence, and use of adjunctive mood stabilizers, etc.) (Grof et al., Reference Grof, Duffy, Cavazzoni, Grof, Garnham and MacDougall2002; Manchia et al., Reference Manchia, Adli, Akula, Ardau, Aubry and Backlund2013).
In this study, an independent investigator (blinded to findings from the actigraphy recordings) reviewed all available sources of clinical information to rate the Alda scale. To fully assess Li response, separate ratings were made initially for two subscales:
(a) A scale: this assesses change in illness activity while receiving Li, with response rated on a 0–10 continuum. The anchor points are ‘no change or worsening’ (score = 0) and ‘complete response, no recurrences in the course of adequate treatment, no residual symptoms, and full functional recovery’ (score = 10).
(b) B scale: this assesses five clinical factors that may confound ratings of Li response and/or the interpretation of the magnitude of any response. Information about clinical and treatment history (especially co-prescription of mood stabilizers and other psychotropics) is used to rate the following: number (B1) and frequency of illness episodes before Li (B2); duration of (B3) and adherence with Li treatment (B4) and use of additional medications (B5). Each item is rated 0–2 and a higher item score or total B scale score indicates a lower level of confidence that any observed clinical improvement is a consequence of the introduction of Li alone.
Next, the overall response was calculated by subtracting the B scale score from the A scale score. We employed cut-off scores recommended in genetics studies (which aim to minimize false positives) and categorized individuals as good responders (GR) if the difference in subscale scores (A–B) was ⩾ 7. All other cases were classified as non-responders (NR).
Actigraphic recording of sleep and circadian rhythms
Actiwatches are widely used in ecological research into sleep–wake patterns as they allow continuous monitoring of triaxial movement over time. An event button on the actiwatch allows users to indicate when they intend to go to sleep and get out of bed.
Participants were provided with an actiwatch (AW-7, CamNtech) and given a demonstration of how to use it. They were then asked to wear it continuously on the wrist of their non-dominant hand for 21 consecutive days and nights (the AW-7 is waterproof so does not need to be removed for bathing, etc.). After 3 weeks, actigraphic data (sampled in 1-min epochs) were downloaded and key study parameters were generated using scoring algorithms incorporated in the Actiwatch Activity and Sleep Analysis software program (CamNtech 7.28).
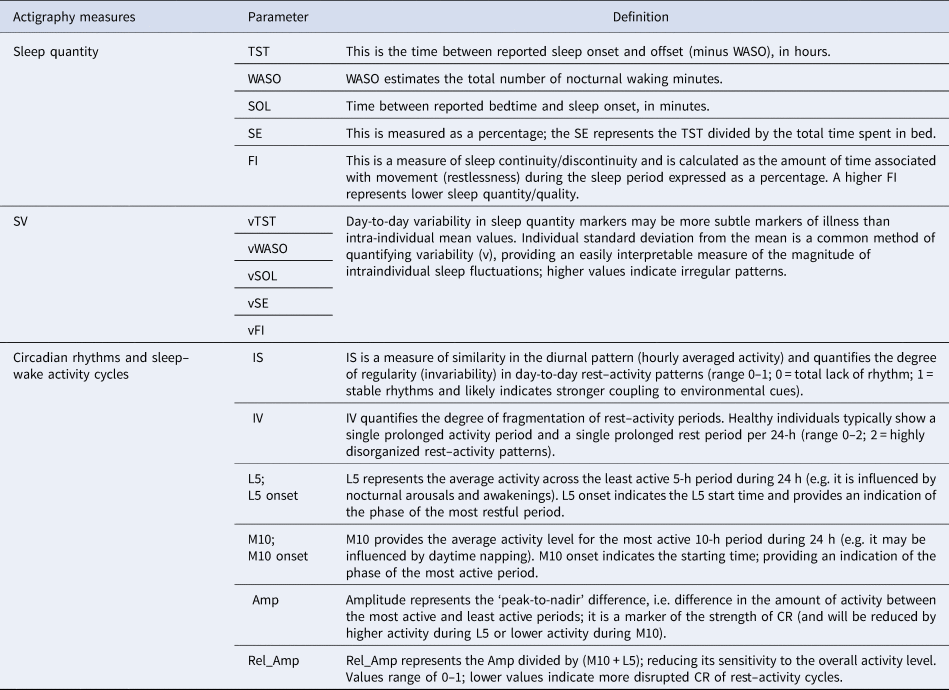
Table 1 gives details of the parameters selected for this study and identifies variables included in the SQ, SV and CR subsets. We focused on the actigraphy parameters reported most often in the literature (reviewed in the Introduction). The five most consistently reported measures of sleep profile (Ancoli-Israel et al., Reference Ancoli-Israel, Cole, Alessi, Chambers, Moorcroft and Pollak2003): TST, SOL, wake after sleep onset (WASO), SE, and the fragmentation index (FI) were estimated using intra-individual mean values (SQ) and also variability for these parameters (SV). The latter was quantified using the individual standard deviation for each parameter selected for analysis, which is a commonly used method as it provides an easily interpretable measure of the magnitude of intraindividual fluctuations (Bei, Wiley, Trinder, & Manber, Reference Bei, Wiley, Trinder and Manber2016). We also extracted data for eight recommended circadian markers (van Someren, Lijzenga, Mirmiran, & Swaab, Reference van Someren, Lijzenga, Mirmiran and Swaab1997): IS, intra-daily variability (IV), M10 and M10 onset, L5 and L5 onset, amplitude (Amp) and Rel_Amp. In the text, we refer to these collectively as circadian rhythms (as this is how they were described originally by van Someren et al. (Reference van Someren, Lijzenga, Mirmiran and Swaab1997), although we acknowledge that some of these measures are only proxy measures of activity and rhythms of the circadian system.)
Overview of key actigraphy parameters (see text for details)

TST, total sleep time; WASO, wake time after sleep onset; SOL, sleep onset latency; SE, sleep efficiency; FI, fragmentation index; IS, inter-daily stability; IV, intra-daily variability; L5, least active 5 h; M10, most active 10 h; Amp: amplitude; Rel_Amp: relative amplitude.
Statistical analysis
Analyses were undertaken using SPSS version 26 and R 3.5.0 packages (R Core Team, 2018). Assuming a GR rate of about 33% (30–36%), we estimated that a sample size of 70 would include a GR group of about 21 individuals (range: 20–25); which would provide a smaller subgroup of similar size to those typically recruited to actigraphy studies. However, as the planned analyses involve multiple comparisons, we minimized the risk of type 1 errors by applying the Benjamini Hochberg (BH) correction for false discoveries [the false discovery rate (FDR) represents the proportion of significant results that are likely to be false positives] (Benjamini & Hochberg, Reference Benjamini and Hochberg1995). We selected a FDR of 10% and followed the recommended BH procedure (McDonald, Reference McDonald2009).
The GR and NR categorization is made using information from the A scale and five separate B items of the Alda scale, which in turn are rated by using a range of clinical information (e.g. prior illness history, duration of Li treatment, co-prescription of other medications with Li). As such, we do not report separate statistical comparisons of these variables between GR and NR subgroups in the main text. However, for information, Figure 1S in the online supplementary materials provides the details of the distributions of A scale and B items ratings according to Li responder status.
The descriptive analysis of the cohort reports categorical data as counts and percentages. As some continuous variables showed non-normal distributions, all are reported as medians and inter-quartile ranges (IQR). The GR and NR groups were compared using the following approaches:
a) We used Mann–Whitney U (MWU) tests to explore differences in SQ, SV and CR parameters according to Li response status (GR v. NR). We employed the Monte Carlo method of repeated sampling to obtain an unbiased estimate of the true p value with 99% confidence interval (CI) and then applied the BH correction.
b) To represent graphically any differences between GR and NR, we generated a spider plot of the SQ, SV and CR parameters according to the group. To allow comparisons within and between subsets of variables we used standardized scores (of the group median value for each parameter).
c) We estimated an aggregate odds ratio (OR) with 95% CI of the association between Li response and each subset of markers (using R-metafor). These analyses were adjusted for age, sex and BMI, which can be associated with rest–activity patterns independently (other relevant co-variates being accounted for by the A and B ratings of the Alda scale). In this analysis, the coding of parameters included within a subset was adjusted to ensure directions of association were compatible (e.g. shorter SOL and higher SE were both coded as positive, whilst e.g. higher FI was coded as negative). Likewise, the reported OR reflects the association with GR (e.g. for CR, an OR > 1 would represent more stable rhythms; for SV, an OR < 1 would indicate lower variability).
Results
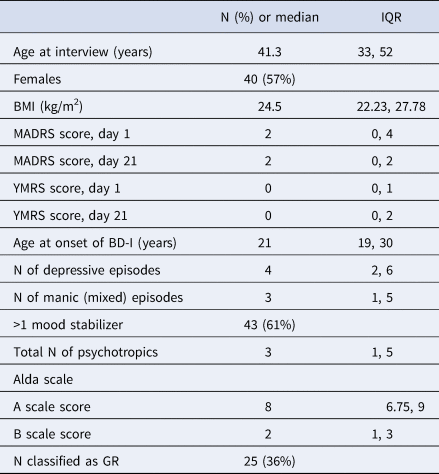
As shown in Table 2, a majority of cohort members were female (57%); age at interview was about 41 years, and age at onset of BD-I was about 21 years. Cohort members reported about seven prior illness episodes, with a slight preponderance of depression. Individuals typically reported receiving three medications for BD-I long term, with 61% receiving a second mood stabilizer (i.e. co-prescribed with Li). Of those receiving >1 mood stabilizer, just over half were receiving sodium valproate (n = 24). Twenty-five individuals met the Alda criteria for GR (36%). Examination of B scale item scores demonstrated that duration of Li treatment (item B3) and adherence level (item B4) did not differ between GR and NR status (see Appendix Figure 1S for Alda subscale scores according to the group).
Cohort characteristics (N = 70)
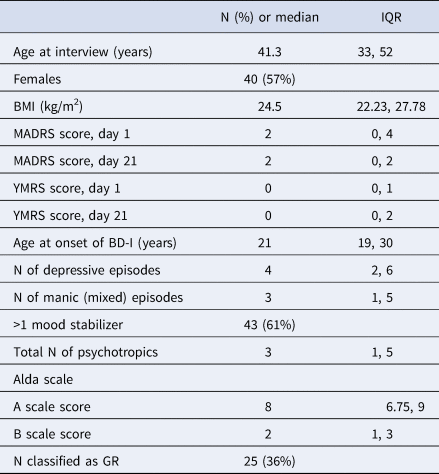
IQR, interquartile range; N, number.
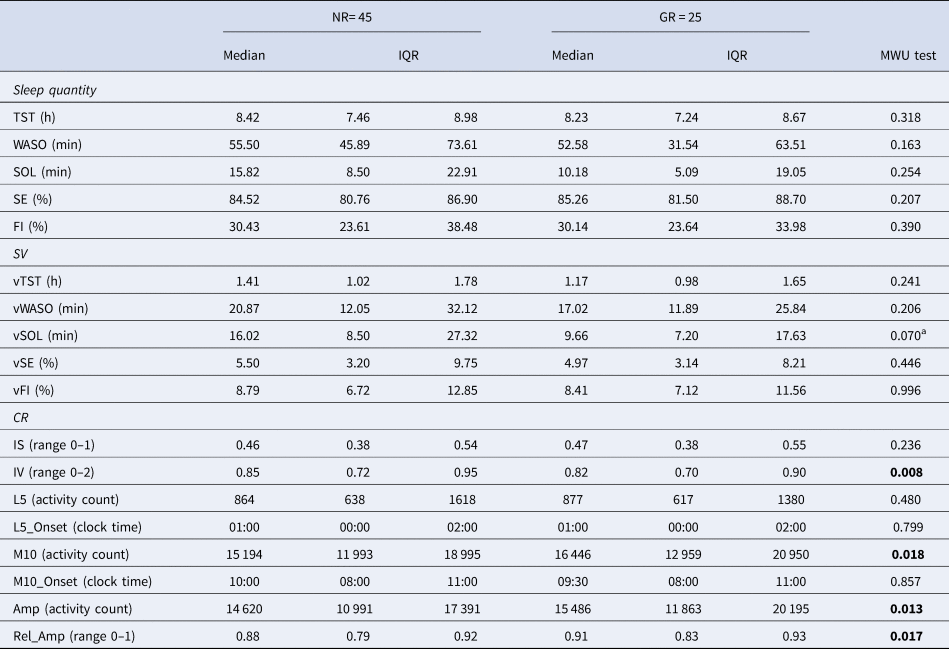
Table 3 shows median and IQR values for SQ, SV and CR variables for GR and NR subgroups. Four between-group differences demonstrated statistical significance (after corrections were applied): IV (median: 0.82 v. 0.85; p < 0.008), M10 (median: 16 446 v. 15 194; p < 0.018), Amp (median: 15 486 v. 14 620; p < 0.013), and Rel_Amp (median: 0.91 v. 0.88; p < 0.017). These variables are all categorized as circadian markers associated with variability, amount and/or Amp of day and night-time activity. There was a trend for vSOL to be lower in GR compared to NR groups (for additional details see Table 1S in the supplementary materials).
MWU tests comparing actigraphy parameters in NR and GR to lithium (additional statistical outputs from this analysis are provided in Table 1S)

IQR, interquartile range.
Significant after statistical correction applied.
a Not statistically significant after bootstrapping and correction for false discoveries.
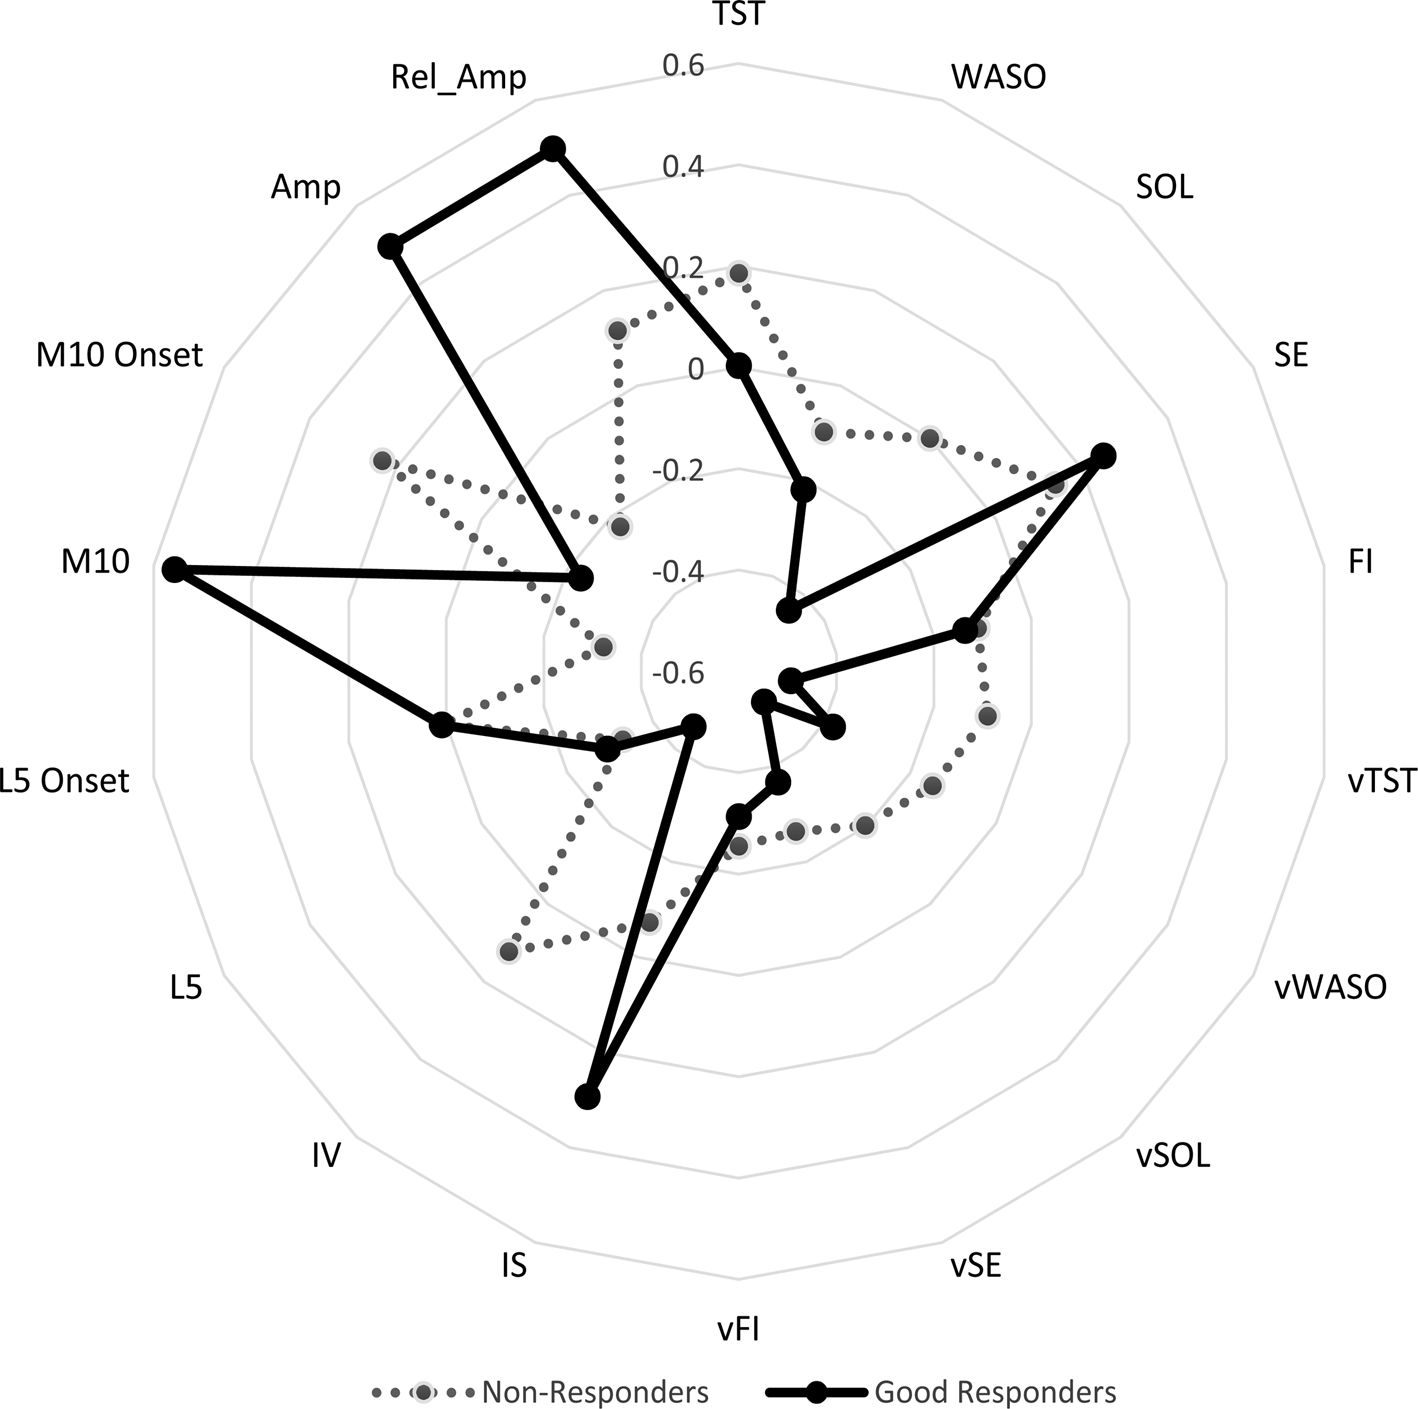
The spider plot (Fig. 1) provides a graphical representation of differences across the range of sleep and circadian markers recorded. As demonstrated, CR markers show some obvious between-group differences, although there are other noticeable, albeit non-significant GR–NR differences in variability (e.g. lower median values for vTST, vWASO and vSOL in the GR group). There was minimal evidence of GR-NR differences in SQ markers, although the most obvious divergence in these variables is for SOL (see Fig. 1). The estimated OR for being classified as a GR case was greatest for individuals showing more regular/stable CR (OR 1.41; 95% CI 1.08, 2.05; p < 0.04), with a similar trend for GR to be associated with lower SV (OR 0.56; 95% CI 0.31, 1.01; p < 0.06). The aggregate measure of SQ did not show an association with GR or NR (OR 0.84; 95% CI 0.56, 1.26; p < 0.40). Additional details regarding the OR estimated are provided in Table 2S in the supplementary materials.
Spider plots showing standardized values for actigraphy parameters measuring sleep and circadian markers in GR compared with a NR. Legend: The median of the standardized value for each parameter was used to enable comparisons across different units of measurement, e.g. SOL and vSOL are lower in GR (values nearer the centre of the plot) than for NR, indicating lower SOL and less variability in SOL in GR; also, higher Rel_Amp is associated with good response. TST, total sleep time; WASO, wake time after sleep onset; SOL, sleep onset latency; SE, sleep efficiency; FI, fragmentation index; v, variability in TST, etc.; IS, inter-daily stability; IV, intra-daily variability; L5, least active 5 h; M10, most active 10 h; Amp, amplitude; Rel_Amp, relative amplitude.

Discussion
To our knowledge, this is the largest ecological actigraphy study that examines whether a comprehensive set of rest–activity rhythm metrics can be used to differentiate between individuals with BD-I who respond to Li prophylaxis and those who do not. We suggest that this can be done, and identified that GR cases were characterized by less fragmentation of rest–activity rhythms within and between days (IV), higher daily levels of activity during the most active period (median value of M10) and Amp (median difference in peak-to-nadir activity), and less disorganized circadian rhythms (Rel_Amp of rest–activity cycles). Although the strength of association was modest between these objective markers of CR and Li response (OR: 1.41; p < 0.04), the findings for these parameters appear to identify BD-I cases with rest–activity rhythms that mimic those of healthy controls [for reviews see De Crescenzo et al. (Reference De Crescenzo, Economou, Sharpley, Gormez and Quested2017); Geoffroy et al. (Reference Geoffroy, Scott, Boudebesse, Lajnef, Henry and Leboyer2015); Scott et al. (Reference Scott, Murray, Henry, Morken, Scott and Angst2017)]. These key metrics are similar (IV/IS) or the same (Rel_Amp; M10) as those that identify individuals at greater risk of BD-I (Lyall et al., Reference Lyall, Wyse, Graham, Ferguson, Lyall and Cullen2018; Pagani et al., Reference Pagani, St Clair, Teshiba, Service, Fears and Araya2016; Shou et al., Reference Shou, Cui, Hickie, Lameira, Lamers and Zhang2017). Also, the findings overlap with findings from small-scale studies of actigraphy and treatment outcomes (noted in the Introduction), especially the likelihood that SQ measures (mean values of TST, SOL, etc.) are less valuable for assessing longer-term treatment outcomes. Finally, we believe the trend for an association between Li response and lower SV is important (OR 0.56; p < 0.06) and, given increasing evidence that variability is also linked with BD phenotypes, further investigation of SV is needed (Bei et al., Reference Bei, Wiley, Trinder and Manber2016; Krane-Gartiser et al., Reference Krane-Gartiser, Scott, Nevoret, Benard, Benizri and Brochard2019).
The study employed the Alda scale to assess Li response. This scale was specifically developed to evaluate the long-term mood stabilization effect under naturalistic conditions (Grof et al., Reference Grof, Duffy, Cavazzoni, Grof, Garnham and MacDougall2002) and is the instrument of choice in large-scale, resource-intensive studies of genetic linkage and GWAS (e.g. Hou et al., Reference Hou, Heilbronner, Degenhardt, Adli, Akiyama and Akula2016). This is important to note because the scale rates Li response retrospectively. So, neither the genetic nor the clinical studies are measuring response prediction. In this study, the association between Li response and actigraphy does not constitute support for CR biomarkers of Li response (Frey et al., Reference Frey, Andreazza, Houenou, Jamain, Goldstein and Frye2013). The methodology used means it is impossible to know whether individuals rated as GR had pre-existing trait rest–activity patterns (prior to initiation of Li) that increased the likelihood they had a good-outcome variant of BD-I or that treatment with Li led to a change in CR parameters to more stable/regular patterns (which then led to low levels of symptoms), or Li led to a reduction in BD symptoms that in turn led to more stable CR. These different propositions have clinical and research implications. For example, if there are ‘healthy’ rest–activity traits associated with good treatment outcome, then using actigraphy might enable early identification of individuals with a good prognosis, allowing treatment to be tailored accordingly (Scott et al., Reference Scott, Etain, Manchia, Brichant-Petitjean, Geoffroy and Schulze2019a; Reference Scott, Hidalgo-Mazzei, Strawbridge, Young, Resche-Rigon and Etain2019b). However, the research implication is that a patient with this rest–activity profile might benefit from a wide range of treatments, and studies will be needed to determine if this rest–activity profile specifically identifies a group that only benefits from Li. The next steps would be prospective studies with sample sizes sufficient to partial out the benefits or different prophylactic treatments or combinations of treatments (Howes et al., Reference Howes, McCutcheon, Agid, de Bartolomeis, van Beveren and Birnbaum2017).
The alternative hypothesis is that our findings indicate that Li treatment directly or indirectly (via the change in other symptoms) mediated change in CR (Etain et al., Reference Etain, Milhiet, Bellivier and Leboyer2011). The clinical implication is that actigraphy (undertaken pre- and post-initiation of Li) might be used to monitor response and, depending on the rate of improvement in CR, might be used as an early marker of those individuals who should continue on Li treatment long-term (Scott et al., Reference Scott, Etain, Manchia, Brichant-Petitjean, Geoffroy and Schulze2019a; Reference Scott, Hidalgo-Mazzei, Strawbridge, Young, Resche-Rigon and Etain2019b). This is important as a major barrier to Li prophylaxis is that response is determined only after a long period of trial and error (Kessing et al., Reference Kessing, Bauer, Nolen, Severus, Goodwin and Geddes2018). The research implication is that there would be a need to determine cause and effect. There are plausible models that suggest Li effects on e.g. dopamine, inositol, or glycogen synthase kinase 3-beta, which may play a prominent role in the regulation of several circadian genes necessary for stable and organized CR (Bellivier et al., Reference Bellivier, Geoffroy, Etain and Scott2015; Etain et al., Reference Etain, Milhiet, Bellivier and Leboyer2011; Harwood, Reference Harwood2005; McClung, Reference McClung2013). Furthermore, stabilization of CR and reduced variability in sleep–wake cycles are associated with stabilization of mood states (and vice versa) (Bei et al., Reference Bei, Wiley, Trinder and Manber2016). The next steps to clarify these issues are important given the pivotal role of Li in prophylaxis, the opportunity to examine the sequence of change in mood, cognition, behaviour and rest–activity patterns and the potential to use these to explore the mechanism of action of Li and the underlying pathophysiology of BD-I.
We acknowledge that our study has several limitations. Although large in comparison to other actigraphy studies and with a superior methodology to the early studies of actigraphy and Li response (including our use of statistical approaches to minimize errors), the current sample size may have undermined our attempts to uncover all relevant associations between key variables. For example, whilst no cases of seasonal affective disorder were identified, the season has a potential influence on the sleep-wake cycle; likewise engagement in employment and daytime activity did not differ between NR and GR, but the relatively small sample would mitigate against finding such effects (and a larger sample is required to truly establish any confounding due to the social activity patterns or light exposure, etc.). We tried to minimize the risk that mood variability might influence the study by using a structured clinical interview to identify BD-I cases (and exclude other comorbidities that might confound the findings), and by employing specific criteria to establish stable euthymia (3 months prior to study entry) and euthymia during the study (pre- and post-actigraphy assessment using established severity ratings of depression and mania). However, this methodology is fallible, and we cannot assume that the sample excluded all individuals with mood variability and/or symptom fluctuations. Given the prevalence of mood variability and borderline personality traits in individuals with BD and the potential impact of such instability on the Amp and other rest–activity rhythms, it is clear the current findings need replication in independent samples (Carr et al., Reference Carr, Saunders, Tsanas, Bilderbeck, Palmius and Geddes2018; McGowan, Goodwin, Bilderbeck, & Saunders, Reference McGowan, Goodwin, Bilderbeck and Saunders2020). Also, future studies should examine any effects associated with the use of different types of mood stabilizers or combinations of mood stabilizers. Whilst the Alda scale assesses illness activity alongside several confounders of response, such as adherence to Li, it is not without problems in terms of its psychometrics and clinimetrics (Scott et al., Reference Scott, Etain, Manchia, Brichant-Petitjean, Geoffroy and Schulze2019a; Reference Scott, Hidalgo-Mazzei, Strawbridge, Young, Resche-Rigon and Etain2019b). Furthermore, in clinical practice, Li response can be viewed as a dimensional rather than a categorical construct (Scott, Etain, Nierenberg & Bellivier, Reference Scott, Etain, Nierenberg and Bellivier2020). In this study, we chose to classify individuals into GR or NR groups as this was the most reported measure of Li response in a recent systematic review (Grillaut-Laroche, Etain, Severus, Scott, & Bellivier, Reference Grillaut-Laroche, Etain, Severus, Scott and Bellivier2020). However, other prospective assessments of Li response and those that measure continuous or categorical outcomes should be considered instead of or as well the Alda scale. We constructed composite measures for SQ, SV and CR. Whilst statistically justifiable (Suh, Nowakowski, & Bernert, Reference Suh, Nowakowski and Bernert2012), future studies employing composite measures might develop more sophisticated algorithms for combining markers. For example, although some metrics offer insights into period and phase, we do not formally assess chronotype, which in recent publications has been identified as a potential marker of Li response (Etain et al., Reference Etain, Milhiet, Bellivier and Leboyer2011; Takaesu et al., Reference Takaesu, Inoue, Ono, Murakoshi, Futenma, Komada and Inoue2018). Lastly, the timing of actigraphy and Li response assessment (as noted above) do not allow us to determine the chronology of any events or to consider cause and effect, so pre–post-Li-initiation projects are required (such as the H2020 R-LiNK study; see Scott et al., Reference Scott, Etain, Manchia, Brichant-Petitjean, Geoffroy and Schulze2019a, Reference Scott, Hidalgo-Mazzei, Strawbridge, Young, Resche-Rigon and Etain2019b).
In conclusion, this study is one of the first studies to demonstrate that objective markers of CR, analysed singularly and together, might be used to identify a Li response phenotype from a clinically representative cohort of individuals with BD-I. However, the modest magnitude of most associations clearly indicates the need to examine these further and to replicate all our findings in future studies. If confirmed in independent studies, the findings may suggest that a good response could be associated with lower SV than non-response. This importance of the current project rests mainly on highlighting the feasibility of this research protocol and the range of actigraphy metrics that might be most useful in such research. The study supports the notion that prospective projects aimed at identifying disease course, predictive and treatment response biomarkers or biosignatures should consider employing actigraphy as an adjunct to ‘omic’, neuro-endocrine, biochemical and brain imaging. Actigraphy offers an additional ecological perspective, which is a relatively low cost, places a minimum burden on the wearer, and can be integrated easily into clinical settings and applied science research. Given this adaptability, it may readily assist projects aimed at developing personalized treatments or exploring the stratification of individuals with BD-I into treatment-relevant subgroups.
Supplementary material
The supplementary material for this article can be found at https://doi.org/10.1017/S0033291720004171
Acknowledgments
We thank the individuals with BD who agreed to participate in this study and the staff at the recruitment sites in Paris Fernand-Widal/Lariboisière (France). We acknowledge the input of Drs Benard, Benizri, Brochard, Boudebesse, Geoffroy, Maruani, Yeim (listed alphabetically) for their participation in the assessments of participants.
Ethical statement
The authors assert that all procedures contributing to this work comply with the ethical standards of the relevant national and institutional committees on human experimentation and with the Helsinki Declaration of 1975, as revised in 2008.
Financial support
This work was supported by the Institut National de la Santé et de la Recherche Médicale (INSERM – Research Protocol C0829), Assistance Publique des Hôpitaux de Paris (APHP – Research Protocol GAN12). This research was also supported by the Investissements d'Avenir, program managed by the Agence Nationale de la Recherche (ANR) under reference ANR-11-IDEX-0004 and Fondation FondaMental (RTRS Santé Mentale).
Data availability statement
The authors confirm that the summary data for all variables supporting the findings of this study are included within the article and its supplementary materials. The raw data are being used at the lead research centre and form part of an ongoing programme of research. Data are not publicly available due to the confidentiality restrictions and because research participants did not give permission for dissemination beyond our research team. However, some of the data may be available upon reasonable request made in writing.
Conflict of interest
The authors report no financial affiliation or other relationship relevant to the subject matter of this article.