Introduction
Most eukaryotic cytochrome P450 monooxygenases (CYPs) are heme-dependent microsomal enzymes that, coupled with NADPH-dependent P450 reductases, constitute one of the primary systems for phase I detoxification of xenobiotics encountered by organisms (Feyereisen, Reference Feyereisen, Gilbert, Iatrou and Gill2005). CYP superfamily P450 genes, mostly belonging to microsomal CYP4, CYP6, CYP9, CYP28, CYP321 and mitochondrial CYP12 families, have frequently been associated with detoxification processes allowing tolerance of insect to insecticides (Scott & Wen, Reference Scott and Wen2001; Feyereisen, Reference Feyereisen, Gilbert, Iatrou and Gill2005) or host-plant allelochemicals (Li et al., Reference Li, Schuler and Berenbaum2007). In insects, metabolism of toxic natural plant compounds has arisen as a result of coevolution between herbivorous animals and toxic allelochemical-producing plants (Berenbaum, Reference Berenbaum, Puga and Wallace1999). Cytochrome P450-catalyzed elimination of toxic plant allelochemicals appears to be a key factor in host-plant utilization (Berenbaum et al., Reference Berenbaum, Cohen, Schuler, Mullin and Scott1992).
Among the best characterized insect P450 systems are the set of lepidopteran CYP6B isozymes in the larval digestive tract that metabolize toxic furanocoumarins, which is characteristic of plant species in the Apiaceae and Rutaceae. In Papilio polyxenes (Lepidoptera: Papilionidae), Papilio glaucus (Lepidoptera: Papilionidae), Papilio canadensis (Lepidoptera: Papilionidae) and Helicoverpa zea (Lepidoptera: Noctuidae), CYP6B transcripts can be significantly induced by a subset of host-plant furanocoumarins (Li et al., Reference Li, Baudry, Berenbaum and Schuler2004b, Reference Li, Schuler and Berenbaum2007). Baculovirus-mediated expression of these cDNAs in insect cell cultures has indicated that CYP6B subfamily members metabolize furanocoumarins (Li et al., Reference Li, Baudry, Berenbaum and Schuler2004b). Several studies associating P450 transcript levels and enzyme activities have suggested that P450s from other CYP families also participate in the detoxification of other classes of host-plant allelochemicals. For instances, CYP28A transcripts and indole alkaloid metabolism are differentially induced in Drosophila mettleri (Diptera: Drosophilidae) and Drosophila nigrospiracula (Diptera: Drosophilidae) by senita and saguaro alkaloids in their host-plants (Danielson et al., Reference Danielson, Macintyre and Fogleman1997, Reference Danielson, Foster, McMahill, Smith and Fogleman1998; Fogleman et al., Reference Fogleman, Danielson and MacIntyre1998). Family 4 P450s have been shown to be induced by alkaloids and phenobarbital in Drosophila and proposed to be involved in host-plant utilization (Danielson et al., Reference Danielson, Foster, McMahill, Smith and Fogleman1998). Expression of CYP4M and CYP9A genes are induced in Manduca sexta (Lepidoptera: Sphingidae) by aliphatic ketones (2-undecanone and 2-tridecanone) in their solanaceous host-plants (Snyder et al., Reference Snyder, Stevens, Andersen and Feyereisen1995; Stevens et al., Reference Stevens, Snyder, Koener and Feyereisen2000). A CYP321A subfamily gene (CYP321A1) is highly induced in H. zea larval midguts in response to xanthotoxin and may contribute to the resistance of H. zea larvae to toxic furanocoumarins (Sasabe et al., Reference Sasabe, Wen, Berenbaum and Schuler2004; Niu et al., Reference Niu, Wen, Rupasinghe, Zeng, Berenbaum and Schuler2008). Aedes aegypti (Diptera: Culicidae) larvae pre-exposed to toxic leaf litter show a higher tolerance to those xenobiotics together with a strong increase in P450 activity levels. Expression studies revealed a 2.3-fold over-expression of CYP6AL1 gene after larval pre-exposure to toxic leaf litter (David et al., Reference David, Boyera, Mesneaub, Ballc, Ransonc and Dauphin-Villemant2006). The level of both CYP9A12 and CYP9A17 mRNA in Helicoverpa armigera (Lepidoptera: Noctuidae) is affected in dose-dependent and tissue-specificmanners by deltamethrin, gossypol and phenobarbital (Zhou et al., Reference Zhou, Ma, Li, Sheng, Liu and Qiu2010).
The brown planthopper Nilaparvata lugens Stål (Homoptera: Delphacidae) is of great economical interest as it is an important specialist pest of rice (Rubia-Sanchez et al., Reference Rubia-Sanchez, Suzuki, Miyamoto and Watanabe1999). In N. lugens, two CYP6 family genes, CYP6AX1 and CYP6AY1, were cloned and the possible role of the two P450 genes in adaptation of N. lugens nymphs to host rice was discussed (Yang et al., Reference Yang, Yang and He2007). However, whether there are more P450 genes other than CYP6AX1 and CYP6AY1 involved in dealing with the allelochemicals from rice remain undocumented. In the present study, we report the cloning and characterization of two novel P450 genes CYP6CS1 and CYP6CW1 from N. lugens. The transcription profile of the two genes was investigated in nymphs feeding on a susceptible TN1 and a moderately resistant MH63 rice varieties. The distribution of the two P450 transcripts in the gut tissues from N. lugens nymphs was visualised by whole mount in situ hybridization. This study examines the potential role of P450 genes in the adaptation of N. lugens to host rice.
Materials and methods
Experimental insects and RNA isolation
A colony of N. lugens (biotype II) were reared on TN1 rice plants (Huang et al., Reference Huang, Chang and Chang1972) at 25°C with a photoperiod of 16:8 (L:D) h and 80% relative humidity. The seeds of rice TN1 and MH63 (Ren et al., Reference Ren, Weng, Zhu and He2004) were planted in plastic pots. The fourth instar nymphs of N. lugens were transferred from TN1 plants to MH63 and TN1 seedlings in the third leaf stage and maintained for 0, 12, 24, 48 to 72 h. The nymphs were collected separately. Gut tissues, fat bodies and carcass of the nymphs treated for 24 h were dissected in 0.9% NaCl (w/v) on ice under an ordinary stereomicroscope, and used for total RNA extraction by using TRIzol reagent (Invitrogen, USA) according to the manufacturer's instruction. For usage in whole mount in situ hybridization, a portion of guts from nymphs treated for 24 h were immediately fixed in MEMFA (0.1 M MOPS, 2 mM EDTA, 1 mM MgSO4, 3.7% formaldehyde) for 1 h at room temperature and stored in 100% ethanol at −20°C.
The 5′ and 3′ rapid amplification of cDNA ends (RACE)
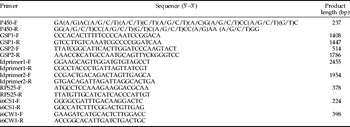
Reverse transcription polymerase-chain reaction (RT-PCR) was carried out by using the Access RT-PCR System Kit (Promega, USA), with the condition and degenerate primers (P450-F and P450-R) according to previous report (Kasai et al., Reference Kasai, Weerashinghe, Shono and Yamakawa2000). All primer sequences are listed in table 1. The amplification product was cloned and sequenced. An EST (GenBank accession numbers: AJ629023), representing a P450 allele was used to design the gene-specific primers: GSP1-F for 3′ RACE and GSP1-R for 5′ RACE, respectively. Full-length cDNA synthesis and RACE were performed exactly following the instruction manual of the SMART RACE cDNA Amplification Kit (BD Bioscience Clontech, USA). The PCR products were resolved in a 0.8% (w/v) agarose gel in TAE buffer (40 mmol l−1 Tris–acetate, 2 mmol l−1 Na2EDTA·2H2O) by ethidium bromide staining. Amplified fragments were recovered and routinely cloned into pGEM-T vector (Promega, USA), and sequenced from both ends by using M13 forward and M13 reverse universal primers. More than four independent clones of 5′ and 3′ end of cDNAs were sequenced to eliminate possible PCR mutations, respectively. The nucleotide sequences of the 5′ and 3′ RACE products were aligned to form a full-length cDNA sequence.
Sequence of primers used for RACE, RT-PCR, LD-PCR and in situ hybridization.

F and R indicate forward primer and reverse primer, respectively. Y=C/T, K=T/G.
To clone novel P450 gene(s), a degenerate antisense primer GSP2-R was synthesized accordingly (Li et al., Reference Li, Bisgaard and Forbes2004a). The 5′ cDNA end was amplified by PCR using GSP2-R and Universal Primer as the primer pair, 5′-RACE Ready cDNA as template and using Advantage 2 PCR Kit (Clontech, BD Biosciences). The amplification profiles were 94°C for 3 min for initial denaturation, 35 cycles of 94°C for 30 s for denaturation at 65°C for 30 s for annealing, and 68°C for 5 min for extension, and then final extension at 68°C for 8 min. The PCR product was cloned and sequenced. The 5′ cDNA sequence was used to design the sene gene-specific primer (GSP2-F) to amplify the 3′ cDNA end. The 5′ and 3′ cDNA ends were aligned to form the second full-length cDNA sequence.
Cloning the full-length cDNAs by LD-PCR
To confirm that the 5′ and 3′ cDNA ends have been amplified from the same genes, two pairs of primers for the long distance-polymerase chain reactions (LD-PCRs; table 1) were designed on the two aligned cDNA sequences. The primers were used to amplify the two P450 cDNAs containing the putative open reading frames and part segments of 5′- and 3′- untranslated regions, respectively. The reaction mixture was prepared as that used for amplification of the 5′- ends of cDNA, except the LD-PCR primers were used. The mixture was heat-denatured at 95°C for 1 min and then amplified for 35 cycles (95°C for 30 s, 62°C for 30 s and 72°C for 3 min). The amplified fragments were cloned and sequenced as described above. The predicted proteins of the two full cDNAs were designated as CYP6CS1 and CYP6CW1 by the P450 nomenclature committee (D.R. Nelson and D.W. Nebert), respectively.
Computer-assisted analysis of P450 cDNAs
Clustal X v1.8 (Thompson et al., Reference Thompson, Gibson, Plewniak, Jeanmougin and Higgins1997) was used for analyzing the alignment and edition. Molecular mass and isoelectric point were predicted by Compute pI/Mw tool (http://us.expasy.org/tools/pi_tool.html). N-terminal transmembrane anchor of the deduced proteins was predicted by the TMHMM Server v. 1.0 (http://www.cbs.dtu.dk/services/TMHMM/). Protein sequence similarity and amino acid identities were done using BLAST program command blastx on the National Center for Biotechnology Information website (http://www.ncbi.nlm.nih.gov/).
Northern analysis of the temporal induction of the two P450 genes by resistant rice
Ten micrograms of total RNA isolated from fourth instar nymphs exposed to rice TN1 and MH63 seedlings were run in formaldehyde denatured agarose gels (1.5%). Total RNA was transferred onto a Hybond-N+ (Amersham, USA) nylon membrane and hybridized with the full cDNAs of CYP6CS1 and CYP6CW1 labeled with [α-32P]-dCTP (Perkin Elmer Life Sciences, USA), respectively. Hybridization was conducted overnight at 65°C, followed by a series of washes in 1×SSC, 0.2% (w/v) SDS at 65°C for 15 min, and in 0.5×SSC, 0.1% (w/v) SDS at 65°C for another 15 min. The membranes were scanned in a Typhoon 9400 Scanner (Amersham Biosciences, USA) to detect hybridization signals.
A 378 bp cDNA segment of ribosomal protein S25 (RPS25) gene (FM212939) was amplified with primer pairs RPS25-F/R (table 1). The PCR mixture was heat-denatured at 95°C for 3 min, then amplified for 35 cycles (95°C for 30 s, 52°C for 30 s and 72°C for 30 s) and finally 72°C for 8 min. The PCR products were recovered and labeled as probe in control hybridization. The hybridizing bands of CYP6CS1 and CYP6CW1 were quantified by the software coupled with the scanner and normalized to RPS25 transcripts present in each lane. The experiments were repeated three times.
Northern analysis of the spatial expression of the two P450 genes
The distribution of CYP6CS1 and CYP6CW1 transcripts in the carcass, gut tissues and fat bodies of the fourth instar nymphs exposed to MH63 seedlings was determined by northern blot hybridization. Ten micrograms of total RNA were isolated from each tissue. RNA electrophoresis, blotting and membrane hybridization with the probes were performed as described above. RPS25 transcripts were used as an inner reference. Hybridizing bands were quantified. The experiments were repeated three times.
Whole mount in situ hybridization
The primer pairs used for amplification of the 3′ UTRs of CYP6CS1 and CYP6CW1 were i6CS1-F/i6CS1-R and i6CW1-F/i6CW1-R (table 1). Amplification was conducted as follows: 95°C for 3 min; 35 cycles of 95°C 30 s, 58°C for 30 s, 72°C for 1 min and finally 72°C for 8 min. The PCR products were cloned into pGEM-T vector (Promega, USA) for both orientations with respect to the T7 polymerase annealing site. The sense and antisense constructs were linearized with SalI (Promega, USA), transcribed with T7 polymerase (TaKaRa, Dalian, China), and labeled with digoxigenin-labeled dNTP mix (Roche, Germany).
The hydrated guts were rehydrated in succession with a gradient concentrations of ethanol (100%, 95%, 85%, 70%, 30% for 5 min each), rinsed in phosphate-buffered saline (PBS: 137 mmol l−1 NaCl, 2.7 mmol l−1 KCl, 4.3 mmol l−1 Na2HPO4, 1.4 mmol l−1 KH2PO4, pH 7.4) with 0.1% (v/v) Tween, and incubated with 10 mg ml−1 proteinase K for 1 min at room temperature. Guts were hybridized for 18 h at 60°C with either sense or antisense RNA probes in 50% formamide, 5×SSC, 5 mg ml−1Troula yeast RNA Type VI (Sigma, USA), 100 mg ml−1 heparin, 1×Denhardt's, 0.1% (v/v) Tween, 0.1% (w/v) CHAPS and 10 mmol EDTA, followed by washes in 2×SSC and 0.2×SSC at 60°C, then with maleic acid buffer (MAB; 0.1 mol maleic acid, 0.15 mol NaCl, 0.1% Tween pH 7.5) at room temperature. Guts were blocked in 5% (w/v) BSA, 2% (w/v) Boehringer Mannheim Blocking Reagent in MAB buffer at room temperature for 2 h, and then incubated with anti-DIG antibody linked to alkaline phosphatase (Roche, Germany) at a dilution of 1:2000 in blocking solution at 4°C overnight. The alkaline phosphatase based detection was carried out by a colour reaction with BCIP/NBT (Sigma, USA) according to the manufacturer's instruction. Endogenous phosphatase activity was blocked by adding levamisole (5 mmol) to the colour substrate. At least five intact guts were observed in each sample.
Results
cDNA cloning and characterization
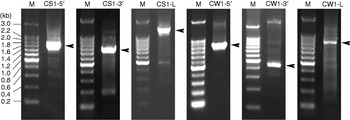
Two cDNA contigs, 2700 bp and 2063 bp in length, were obtained by aligning the 5′ and 3′ cDNA ends amplified by RACE (fig. 1). LD-PCR resulted in two clones that were 2455 bp and 1954 bp in length (fig. 1). The LD-PCR product with 2455 bp in length, amplified by using primers ldprimer1-F and ldprimer1-R, proved to be the slightly internal sequence of the 2700 bp cDNA contig. Another LD-PCR product with 1954 bp was amplified by ldprimer2-F and ldprimer2-R, and was the internal sequence of the 2063 bp cDNA contig. The 2700 bp gene was designated CYP6CS1 and the 2063 bp gene was designated CYP6CW1 and deposited in the GenBank with accession numbers: FM994118 for CYP6CS1 and FN421126 for CYP6CW1, respectively.
Amplified cDNA segments of CYP6CS1 and CYP6CW1 by RACE and LD-PCR. The products were run in a 0.8% agarose gel and stained with ethidium bromide. M indicates a DNA marker. CS1-5′, the 5′ RACE product of CYP6CS1; CS1-3′, the 3′ RACE product of CYP6CS1; CS1-L, the LD-PCR product of CYP6CS1; CW1-5′, the 5′ RACE product of CYP6CW1; CW1-3′, the 3′ RACE product of CYP6CW1; CW1-L, the LD-PCR product of CYP6CW1.

The BLAST program demonstrated that CYP6CS1 exhibits greatest similarity with Liposcelis bostrychophila CYP6CE2 (EF421246), Tribolium castaneum CYP6BK17 (XP_974742), Culex pipiens pallens CYP6F1 (AAT72405), and Ochlerotatus sollicitans CYP6BB1v4 (AAW69913). Amino acid identity of CYP6CS1 with each of the four P450s is 37%, 35%, 38% and 37%, respectively. CYP6CW1 exhibits greatest similarity with Tribolium castaneum CYP6BK17 (XP_974742), Hodotermopsis sjoestedti CYP6AM1 (BAD84176), Culex pipiens pallens CYP6F1v1 (AAX47271), and Anopheles gambiae CYP6N1 (AAK32960) with amino acid identity of 34%, 35%, 34% and 36%, respectively. CYP6CS1 and CYP6CW1 share 27% amino acid identity with each other. The predicted isoelectric points of CYP6CS1 and CYP6CW1 are 8.97 and 8.33, respectively. The molecular weights (MW) are 61618 and 63890 daltons, respectively. CYP6CS1 and CYP6CW1 are typical microsomal P450s, for there are hydrophobic transmembrane regions in the N-terminals of the two deduced proteins.
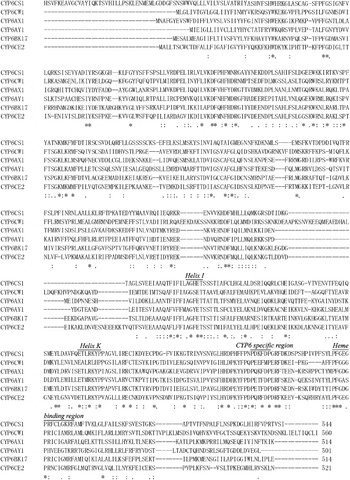
To identify important conserved domains and conserved amino acids in CYP6CS1 and CYP6CW1, a peptide alignment was made (fig. 2). The sequences included the two cDNA-predicted P450s, their two most similar sequences CYP6CE2 and CYP6BK17, N. lugens CYP6AX1 and CYP6AY1. The alignment results indicated CYP6CS1 and CYP6CW1 contain the oxygen binding motif (helix I) of P450 (AG–T, positions 315 to 319 in CYP6CS1, 438 to 442 in CYP6CW1), the helix K (E–R–P, positions 372 to 378 in CYP6CS1, 494 to 500 in CYP6CW1), the heme-binding motif (PF–G—C-G–F, positions 446 to 459 in CYP6CS1, 564 to 577 in CYP6CW1). More importantly, both of them have a 6-residue sequence (P–F-P) specific to CYP6 but not other P450s. In addition, 74 and 71 conserved amino acid residue positions for CYP6CS1 and CYP6CW1 are found identical with the four P450 sequences included in the alignment (fig. 2). Therefore, they represent two new subfamilies in the CYP6 family.
Deduced amino acid sequence and homology of N. lugens P450s. Shown is the homology of CYP6CS1 (FM994118) and CYP6CW1 (FN421126) with four CYP6 members: N. lugens CYP6AX1 (AJ852422), N. lugens CYP6AY1 (AJ852423), Liposcelis bostrychophila CYP6CE2 (EF421246) and Tribolium castaneum CYP6BK17 (XP_974742). Identical amino acids are indicated by asterisks and conservative substitutions by dots. The helix I, helix K, the heme-binding motif and the six-residue sequence specific to CYP6 members are indicated by a line and corresponding italic words.

Temporal expression analysis of CYP6CS1 and CYP6CW1 by northern blot analysis
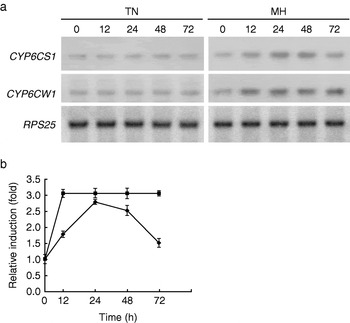
Northern blots screened for CYP6CS1 and CYP6CW1 transcripts indicated that the transcripts of the two P450 genes are scarcely detectable in fourth instar nymphs fed with TN1 seedlings but remarkably induced after exposure of the nymphs to MH63 seedlings (fig. 3a). The induction of CYP6CS1 by host rice resistance was observed in two phases, first a gradual increase between 0 (1.0-fold) and 12 h (1.8-fold), then a rapid increase from 12 (1.8-fold) to 24 h (2.8-fold), which peaked at 24 h and then declined steadily from 48 (2.5-fold) to 72 h (1.5-fold) (fig. 3b). However, an obvious induction of CYP6CW1 was found from 0 (1.0-fold) to 12 h (3.0-fold), and the expression was kept at a constant level from 12 to 72 h (fig. 3b).
Northern blot analysis of the expression of CYP6CS1 and CYP6CW1 in N. lugens nymphs subjected to its susceptible rice TN1 and resistant rice MH63 for the indicated time course. (a) An example from northern blot experiments. Ribosomal protein S25 (RPS25) gene acts as an inner reference. The italic words ‘RPS25, CYP6CS1 and CYP6CW1’ represent probes used in each hybridization experiment. TN1 indicates the nymphs fed with TN1 plants and MH63 indicates the nymphs exposed to MH63 plants for 24 h. (b) Fold induction of CYP6CS1 and CYP6CW1 over time in response to MH63 seedlings. The induction levels for each sample were quantified according to the density and area of the hybridization signal, after normalization to the level of RPS25 transcripts present in each sample. Each point represents the mean±SD of three determinations of mRNA level in N. lugens subjected to MH63 relative to that in nymphs ingestion of TN1 at the indicated time course ( , CYP6CS1;
 , CYP6CW1).

Spatial expression analysis of CYP6CS1 and CYP6CW1 by northern blot analysis
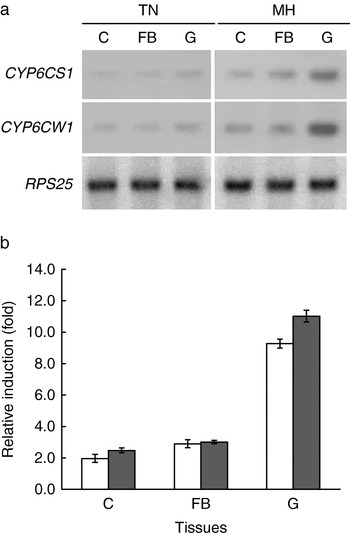
Northern blot experiments showed that the resistant rice MH63 induced the expression of CYP6CS1 in gut tissues (9.0-fold), fat bodies (3.0-fold) and carcass (2.0-fold). With resistant rice induction regimes, CYP6CW1 were highly expressed in gut tissues (11.0-fold), but expressed with a slight enhancement in fat bodies (3.0-fold) and carcass (2.5-fold) (fig. 4b). The two P450 genes were expressed at a basal level in the three tissues of nymphs fed with TN1 plants, and a representative result of the northern hybridization is shown in fig. 4a.
Detection of CYP4CE1 expression by northern blot hybridization, using the RNA samples extracted from the indicated tissues of the nymphs fed with TN1 and MH63, respectively. (a) An example from northern blot experiments. RPS25 acts as inner reference. The italic words ‘RPS25, CYP6CS1 and CYP6CW1’ represent probes used in each hybridization experiment. G, FB and C represent the gut tissue, fat body and carcass, separately. TN1 indicates the nymphs fed with TN1 plants and MH63 indicates the nymphs exposed to MH63 seedlings. (b) Spatial induction of CYP6CS1 and CYP6CW1 in N. lugens nymphs exposed to MH63. The mean±SD of three determinations of mRNA level in each tissue of N. lugens subjected to MH63 relative to that in the corresponding tissue of lavae ingestion of TN1 were shown as histograms (□, CYP6CS1;  , CYP6CW1).

Whole mount in situ location of the two P450 transcripts in gut tissues
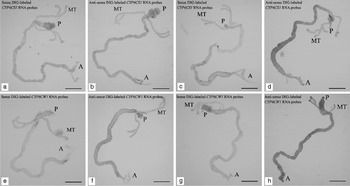
There should be more than one P450 member in the same CYP6 family with CYP6CS1 or CYP6CW1; to avoid off-target in hybridization, we chose 3′ untranslational regions (3′ UTRs) as specified targets to design primers. Whole mount in situ hybridizaion revealed all the five guts displayed the same color pattern with the same intensity/distribution within each treatment group, as representative micrographs displayed in fig. 5, CYP6CS1 and CYP6CW1 are expressed at a basal level in gut tissue, including foregut, midgut, hindgut regions and Malpighian tubules in nymphs fed with TN1 rice (fig. 5b, f). After exposure of nymphs to MH63 rice, the expression of CYP6CW1 is dramatically increased in these same tissues (fig. 5h). However, CYP6CS1 transcripts are significantly increased in midgut, while slightly inducible in foregut, hindgut and Malpighian tubules (fig. 5d).
Location of CYP6CS1 and CYP6CW1 mRNA in N. lugens gut tissues. (a), (c) sense and (b), (d) antisense DIG-labeled CYP6CS1 RNA probes. (e), (g) sense and (f), (h) antisense DIG-labeled CYP6CW1 RNA probes. (a), (b), (e) and (f) panels show complete guts, including foregut, midgut, hindgut regions and Malpighian tubules, of nymphs on TN1 seedlings. (c), (d), (g) and (h) panels show guts of nymphs on MH63 seedlings. Colorimetric analysis was used to detect hybridized probes. A, anterior end of gut; P, posterior end of gut; MT, Malpighian tubule. Bar=100 μm.

Discussion
The indica rice variety TN1 (Huang et al., Reference Huang, Chang and Chang1972), with a resistant level of 9, is completely susceptible to N. lugens and usually used to rear the rice pests, e.g. N. lugens, or used as a control in experiments. MH63 contains a minor resistant locus on its second chromosome, showing a resistant level of 8 (Ren et al., Reference Ren, Weng, Zhu and He2004). Therefore, MH63 is endowed with some tolerance and moderate resistance qualities to N. lugens. Nevertheless, such a moderate resistance can not prevent MH63 from being infested by N. lugens. The capacity of N. lugens to continuously feed on MH63 plants resulted in the successive induction of CYP6CW1. In contrast, CYP6CS1 presented a rather different expression pattern compared with that of CYP6CW1 (fig. 3). The expression level of CYP6CS1 was first increased and then declined in response to the resistant rice. This may be explained by that certain P450(s), which had the same or similar biochemical characteristics as CYP6CS1, gradually replaced this enzyme during the treatment. As is known, an herbivorous insect encountering different classes of host plants will induce a different but sometimes overlapping subset of P450 genes from its repertoire (Stevens et al., Reference Stevens, Snyder, Koener and Feyereisen2000).
The insect midgut is the largest portion of the digestive tract, playing an important role in digesting food and absorbing nutrients, and is also a target of pathogenic microbes, insecticides and plant toxins. Detoxification of allelochemicals in the key metabolic tissue, gut tissue, may prevent the toxins diffused to the other tissues or organs (Wigglesworth, Reference Wigglesworth1972). For example, the role of the D. melanogaster midgut in food digestion is well accepted (Terra & Ferreira, Reference Terra, Ferreira, Gilbert, Iatrou and Gill2005). In addition, the anterior portion of the midgut is suggested to play some role in immunity (Senger et al., Reference Senger, Harris and Levine2006). The middle portion of the midgut is supposed to have an important role in detoxification processes, as the metabolism of both exogenous and endogenous compounds (Tzou et al., Reference Tzou, Ohresser, Ferrandon, Capovilla, Reichhart, Lemaitre, Hoffmann and Imler2000). It has been demonstrated that the Malpighian tubules are important for the metabolism and detoxification of xenobiotics, and might also be involved in immunity (Dow & Davies, Reference Dow and Davies2006). The expression pattern of different P450s in different midgut regions in third instar D. melanogaster larvae was detected, with a predominance of P450s in the anterior (55% of all midgut expressed P450s) and middle midgut regions (49% of all midgut expressed P450s) (Chung et al., Reference Chung, Sztal, Pasricha, Sridhar, Batterham and Daborn2009). In this work, spatial expression profiles of N. lugens CYP6CS1 and CYP6CW1 demonstrated that the two P450 enzymes, CYP6CS1 and CYP6CW1 were mainly induced in the gut tissues after exposure of N. lugens nymphs to resistant rice (fig. 4). Whole mount in situ hybridization further revealed that CYP6CW1 was activated in all gut tissues including the Malpighian tubules, but induction of CYP6CS1 was notably restricted in midgut (fig. 5). These data, associating the results of the temporal expression analyses, imply potential roles in detoxification processes and protection from harmful rice compounds, and the regulatory elements controlling the expression of these two genes may be acting differently.
Homologous analysis revealed that CYP6CS1 exhibits greatest similarity with some insect P450s, such as CYP6F1 (AAT72405) and CYP6BB1v4 (AAW69913). CYP6F1 is a novel gene cloned from the deltamethrin-resistant fourth instar larvae of Culex pipiens pallens and was expressed at higher levels in the deltamethrin-resistant strain and may confer some insecticide resistance (Gong et al., Reference Gong, Gu, Hu, Sun, Ma, Li, Sun, Sun, Qian and Zhu2005). CYP6BB1 transcription in females was significantly increased 24 h after a blood meal, suggesting that CYP6BB1 may play a role in the metabolism of substances in the blood (Huang et al., Reference Huang, Sun and Brattsten2008). Among the P450s most homologous to CYP6CW1, CYP6AM1 was specifically expressed in pseudergates and soldiers of the damp-wood termite Hodotermopsis sjostedti. Pyriproxyfen may be a substrate for CYP6AM1 (Cornette et al., Reference Cornette, Koshikawa, Hojo, Matsumoto and Miura2006). The high homology of CYP6CS1 and CYP6CW1 to these xenobiotics-metabolizing P450s further suggests the possibility of similar physiological functions of the two 450s in detoxification of rice herbicides. However, the low identity (27%) of CYP6CS1 and CYP6CW1 to each other likely results from their different exogeneous substrates. The subfunctionalisation of the two genes may have occurred in the evolution. It could be of interest to investigate whether the two poorly related P450 isoforms have evolved independently.
In this paper, we reported the successful cloning of two novel P450 genes, CYP6CS1 and CYP6CW1, from N. lugens. Both CYP6CS1 and CYP6CW1 are typical microsomal P450s with characteristics common to other members in the CYP6 family. They were induced by rice resistance and mainly expressed in guts, suggesting their potential roles in xenobiotic responses. These results, together with our previous work (Yang et al., Reference Yang, Yang and He2007), should lead to a better understanding of N. lugens/rice interaction with emphasis on the midgut as a critical interface with host rice. Further in vitro metabolic studies on these heterologously expressed CYP6 enzymes are needed in order directly to demonstrate their catalytic activity.
Acknowledgements
We thank Dr David R. Nelson and Dr Daniel W. Nebert for classifying the N. lugens P450s before their publication. This work was supported by grants from the National Natural Science Foundation of China (30500328).