


Introduction
Invasive species have recently become a large international concern of ecologists, representing the second most important cause of species extinction globally after habitat destruction (Fitoussi et al., Reference Fitoussi, Pen-Mouratov and Steinberger2016). The giant goldenrod, Solidago gigantea Ait. (Asteraceae), a perennial herb native to North America, is a common, widespread and important invasive species in most European countries (Weber, Reference Weber1998). Solidago gigantea often forms dense monospecific stands in a broad range of habitats (Weber & Jakobs, Reference Weber and Jakobs2005; De Groot et al., Reference De Groot, Kleijn and Joganc2007) and substantially changes the physicochemical and biological properties of the soil (Liao et al., Reference Liao, Xie, Peng, Chai and Chen2013), confirmed by many studies, published in the last decade, on the effect of S. gigantea on the belowground which has increasing trend in the last decade. For example, Chapuis-Lardy et al. (Reference Chapuis-Lardy, Vanderhoeven, Dassonville, Koutika and Meerts2006) mentioned that S. gigantea enhances soil phosphorus turnover rates, Sterzyńska et al. (Reference Sterzyńska, Shrubovych and Nicia2017) reported increase in soil acidity and Baranová et al. (Reference Baranová, Manko and Jászay2014) found changes in soil moisture in invaded ecosystems. Solidago gigantea invasion negatively affected plant diversity and average plant cover (Moroń et al., Reference Moroń, Lenda, Skórka, Szentgyörgyi, Settele and Woyciechowski2009) and significantly decreased bacterial and increased fungal biomass in soil (Scharfy et al., Reference Scharfy, Güsewell, Gessner and Venterink2010). Invasion of S. gigantea had a very strong negative effect on diversity and abundance of wild pollinator (Moroń et al., Reference Moroń, Lenda, Skórka, Szentgyörgyi, Settele and Woyciechowski2009) and ants (Lenda et al., Reference Lenda, Witek, Skórka, Moroń and Wojciechowski2013), but Baranová et al. (Reference Baranová, Manko and Jászay2014) mentioned significant changes in Coleoptera families and Carabidae assemblages, but not necessarily reduction in their diversity. Soil nematodes are ubiquitous and numerous and constitute an informative bioindicator group for the functioning of soil food webs due to their trophic diversity and extensive interconnectedness within the soil food web (Neher et al., Reference Neher, Wu, Barbercheck and Anas2005). The analysis of the composition of nematode fauna serves as a basis for the ecological assessment of soil (De Goede & Bongers, Reference De Goede and Bongers1994). These authors reported that nematode communities could be defined for a range of terrestrial habitats and that these communities could be associated with characteristics of the soil and vegetation. Plants, as primary producers and providers of resources to soil food webs, are of vital importance for the composition, structure and functioning of soil communities, including nematodes (De Deyn et al., Reference De Deyn, Raaijmakers, Van Ruijven, Berendse and Van Der Putten2004). So far, the impact of invasive plants on soil free living and plant parasitic nematodes has received little attention (Chen et al., Reference Chen, Li, Fang, Chen and Wu2007; Renčo & Baležentiené, Reference Renčo and Baležentiené2015; Renčo et al., Reference Renčo, Kornobis, Domaradzki, Jakubska-Busse, Jurová and Homolová2019), and to our knowledge only one recent study from Germany is available about the impact of invasive S. gigantea on soil nematofauna (Quist et al., Reference Quist, Vervoort, Van Megen, Gort, Bakker, Van der Putten and Helder2014). Solidago gigantea as well as other invasive species are known to invade a wide range of ecosystems which can have specific community compositions of soil nematodes. Therefore, estimating the status of, and associated changes in, the structures of soil nematode communities after the establishment of invasive plants must thus include the assessment of different habitats (Renčo & Baležentiené, Reference Renčo and Baležentiené2015).
Our objective was to assess and compare the nematode communities in areas invaded and uninvaded by S. gigantea in two types of ecosystem: a lowland semi-natural grassland and a temperate broadleaved mixed forest. We hypothesized that changes caused by the S. gigantea in native habitats would affect soil physical properties, reduce nematode abundance and species diversity, and affect the trophic structure and selected ecological and functional indices of the nematode communities. We studied the impact of S. gigantea on the nematode communities in these two semi-natural ecosystems by analysing the communities at the species level and calculating diversity, ecological and functional indices to characterize the condition of the soil food webs in both invaded and uninvaded soils.
Material and methods
Study sites and area
Sites invaded by S. gigantea were found by actively searching a suitable area. We established sites across the entire range of habitats and environmental conditions in which the species occurred. Invaded sites had at least 80% coverage of S. gigantea, and uninvaded sites did not contain this species. The study was carried out in a region of the Košice Basin in the lowlands of south eastern Slovakia (48°42′N′′, 21°18′E′′). This region has a warm climate; winter and summer temperatures range from −1 to −3 °C and from 18 to 20 °C, respectively, and mean annual precipitation is 600 mm. The soil is classified as a Haplic Cambisol (Miklós, Reference Miklós2002).
The characteristics of the sites were:
Uninvaded forest (F): ten study sites in stands dominated by Quercus, Fagus, Carpinus and Betula (deciduous forests). Mean soil organic carbon content Corg was 2.79% (2.29–3.18), and mean soil nitrogen (N) content was 0.24% (0.19–0.26).
Uninvaded grassland (G): ten study sites with indigenous multispecies vegetation dominated by Dactylis glomerata, Lolium perenne, Trifolium pratense, Capsella bursa-pastoris and Taraxacum officinale. Mean Corg was 3.30% (2.27–4.29), and mean N was 0.36% (0.25–0.47).
Invaded forest (FS): ten nearly monospecific stands of S. gigantea on forest edges, with an estimated time of invasion of 10–15 years. Mean Corg content was 2.31% (1.54–3.12), and mean N content was 0.22% (0.17–0.30).
Invaded grassland (GS): ten study sites in nearly monospecific stands of S. gigantea on grassland edges, with an estimated time of invasion of 10–20 years. Mean Corg content was 3.27% (2.38–4.18), and mean N content was 0.34% (0.26–0.43).
The Corg and N data from obtained soil samples were provided by the National Agriculture and Food Centre, Slovakia. The sites were within an area of 20 × 15 km and separated by a mean distance of 3.5 km. Elevation at the sites ranged from 192 to 380 m a.s.l. (Miklós, Reference Miklós2002). The uninvaded and invaded sites were adjacent to each other (mean distance between the invaded and uninvaded sites was 50 m; range 30–80 m). The uninvaded sites were assumed to represent sites prior to invasion by S. gigantea. Invaded and uninvaded sites had highly similar overall habitat conditions. Pairs of invaded and uninvaded sites did not differ in elevation, inclination, exposition, type or management.
Sampling and processing
Composite soil samples consisted of five subsamples that were collected in September 2016 and September 2017 in the 10–20 cm layer in each site using a hand spade. A total of 80 composite samples (20 sites (ten in forest and ten in grassland) × two invasion states (invaded and uninvaded areas) × two sampling dates) were collected. The samples were transferred to the laboratory in plastic bags. Each sample was gently homogenized manually before processing. Soil-moisture content was measured gravimetrically after the soil had been dried to a constant weight in an oven at 105 °C for 24 h. Soil pH was determined for air-dried soil samples in a 1:3 solution of soil: 0.01 m CaCl2. All determinations were performed in triplicate.
Nematodes were isolated from 100 g of the composite soil samples by a combination of Cobb sieving and decanting (Cobb, Reference Cobb1918) and a modified Baermann technique (Van Bezooijen, Reference Van Bezooijen2006). Nematodes were extracted from aqueous soil suspensions using a set of two cotton-propylene filters. Subsamples were removed after extraction at room temperature for 24 h. The aqueous suspensions containing nematodes were examined under a stereomicroscope, excessive water was removed and the nematodes were fixed in a formalin/alcohol/acetic acid solution and evaluated on permanent glycerine slides (Southey, Reference Southey1986). All isolated nematodes were microscopically identified to species, or juveniles to genus using an Eclipse 90i light microscope (Nikon, Japan), with original species descriptions and several taxonomic keys: Brzeski (Reference Brzeski1998), Loof (Reference Loof1999), Siddiqi (Reference Siddiqi2000), Andrássy (Reference Andrássy2005, Reference Andrássy2007, Reference Andrássy2009) and Geraert (Reference Geraert2008, Reference Geraert2010).
The total number of species, nematode abundance, abundance of nematodes per trophic group and a species diversity index (Shannon & Weaver, Reference Shannon and Weaver1949) were determined. Nematode species were assigned to five trophic groups: bacterivores, fungivores, herbivores, omnivores and predators (Yeates et al., Reference Yeates, Bongers, de Goede, Freckman and Georgieva1993; Wasilewska, Reference Wasilewska1997). Ecological indices such as the Maturity Index (MI) for free living taxa, and the Plant Parasite Index (PPI) for plant parasitic taxa were used to assess the status of the soil ecosystems using nematode communities (Bongers, Reference Bongers1990). Both maturity indices (MI, PPI) were calculated using a c-p value that represented the life history characteristics of the nematode taxa associated with r- and K-selection. Species with c-p values of 1 or 2 are r-selected or colonisers. These species are very tolerant to disturbances due to their short generation times, large population fluctuations and high fecundities. Species with a c-p value of 5 are K-selected, or persisters, with long life cycles, low reproductive rates, low metabolic activities and slow movement; they are thus very sensitive to disturbances. Lower c-p values are indicative of more disturbed environments, and higher values are characteristic of less disturbed environments (Bongers, Reference Bongers1990).
Functional indices, such as the Enrichment Index (EI), Structure Index (SI) and Channel Index (CI) (Ferris et al., Reference Ferris, Bongers and de Goede2001), and the Basal Index (BI) (Ferris et al., Reference Ferris, Bongers and de Goede2001; Berkelmans et al., Reference Berkelmans, Ferris, Tenuta and van Bruggen2003) associated with development of the maturity indices led to a functional guild classification of nematodes as a basis for studying and comparing ecosystem processes. Considering soil nematode taxa as representatives of functional guilds generates an indicator profile that is not constrained by population distribution patterns and microenvironment effects (Ferris & Bongers, Reference Ferris and Bongers2006). Indices of soil food webs such as the EI, SI, CI and BI are used to infer food web complexity and the main pathways of organic matter decomposition (Ferris et al., Reference Ferris, Venette and Scow2004). EI is based on the abundance of enrichment opportunistic nematodes, and indicates rapid decomposition of low C:N organic matter mediated by bacteria. EI thus suggest whether the soil environment is nutrient enriched (high EI) or depleted (low EI). SI weights the prevalence of omnivore and predatory nematodes in the soil food web as an indicator of long and complex soil food webs with high connectance and numerous trophic links, and indicates if the soil ecosystem is structured with more trophic links (high SI) or degraded with fewer trophic links (low SI). The CI, in contrast, is based on the abundance of fungal feeding opportunistic nematodes and indicates slower decomposition of high C:N organic matter mediated by fungi. A high CI (>50%) indicates a higher proportion of fungal decomposition while low CI (<50%) suggests bacterial decomposition channels (Ferris et al. Reference Ferris, Bongers and de Goede2001). The BI is derived from the abundance of persistent microbial feeding nematodes; high BI values indicate short and depleted soil food webs. All community indices were calculated using the online programme ‘NINJA: An automated calculation system for nematode-based biological monitoring’ (Sieriebriennikov et al., Reference Sieriebriennikov, Ferris and de Goede2014; http://spark.rstudio.com/bsierieb/ninja).
Statistical analysis
Soil pH, soil-moisture content, mean nematode abundance, mean abundance of nematodes per trophic group, nematode cp1-5 groups and the diversity, ecological and functional indices (the Shannon–Weaver species diversity index and the MI, PPI, EI, SI, CI and BI) were analysed using Statistica (StatSoft Inc. 2013).
The data were analysed with a repeated, two-way ANOVA, with ‘ecosystem’ (F, G), ‘invasion status’ (invaded, uninvaded), ‘year’ (as a repeated measure) and their interactions as factors. Box–Cox transformation was applied to satisfy the assumptions of these parametric tests using maximum likelihood and the Golden Search iteration on all variables except those that were normally distributed (mean nematode abundance and the BI and MI). The factor ‘year’ strongly influenced the majority of the variables tested, so the data set was split to investigate the effects of ‘ecosystem’ and ‘invasion status’ separately with two-way ANOVAs for the samples from 2016 and 2017. A main-factor ANOVA (factors ‘ecosystem’, ‘invasion status’ and no interaction) was used if ‘ecosystem’ and ‘invasion status’ did not interact. t-tests were applied separately for each ecosystem to determine the effect of ‘invasion status’ if ‘ecosystem’ and ‘invasion status’ interacted.
A redundancy analysis (RDA) was used on the nematode community data for the two years separately, with explanatory variables soil pH, soil-moisture content, ‘ecosystem’ and ‘invasion status’ to identify the relationships between the nematode taxa and soil properties. All data were log-transformed. The entire data set was first included in the RDA, and the analysis was then repeated with the 71 (of 90) and 57 (of 70) most abundant genera for 2016 and 2017, respectively, which covered >99% of the total abundance, to obtain a clear ordination site (see Results). The effects of the explanatory variables were quantified by automatic forward selection. These ordination analyses were performed in Canoco 5 for Windows (Ter Braak & Šmilauer, Reference Ter Braak and Šmilauer2012).
Results
Soil acidity and moisture content
Soil pH was higher at the invaded than the uninvaded sites, but differed significantly only in 2017 (P < 0.001), not taking the ‘ecosystem’ into account. pH was significantly higher in the grassland than the forest (P < 0.001) in both years. The interaction of ‘ecosystem’ × ‘invasion status’ had a significant impact on pH in 2016 (P < 0.001), and subsequent t-tests confirmed a significant effect of ‘invasion status’ on pH for both grassland and forest (P < 0.05 and <0.01, respectively). Soil-moisture content was slightly higher at the invaded than the uninvaded sites (P < 0.001) and at the forest than the grassland sites (P < 0.05), but both only in 2016 (tables 1 and 2).
F values from two-way ANOVAs in the samples from 2016 with ‘ecosystem’ (Forest, Grassland) ‘invasion status’ (Invaded, Uninvaded) and their interactions as factors from analysis of soil pH, soil moisture, total nematode abundance, species diversity index, abundance in trophic groups, abundance in cp value, particular ecological and functional indices with associated probabilities (P) and degree of freedom reported.

***0.001; **0.01; *0.05.
F values from two-way ANOVAs in the samples from 2017 with ‘ecosystem’ (Forest, Grassland)’, invasion status’ (Invaded, Uninvaded) and their interactions as factors from analysis of soil pH, soil moisture, total nematode abundance, species diversity index, abundance in trophic groups, abundance in cp value, particular ecological and functional indices with associated probabilities (P) and degree of freedom reported.

***0.001; **0.01; *0.05.
Soil nematode abundance, species diversity and species composition
Mean nematode abundance and species diversity were distinct between invaded and uninvaded soils. While S. gigantea invasion significantly increases nematode abundance (both years P < 0.001) the species diversity was significantly lower (P < 0.05 or <0.01) at the invaded than the uninvaded sites in both years (tables 1 and 2), not taking ‘ecosystem’ into account. The bi-factorial interaction ‘ecosystem’ × ‘invasion status’ significantly influenced mean nematode abundance and species diversity (P < 0.05 and <0.01, respectively) in 2017 only. Subsequent t-tests confirmed a significant effect of ‘invasion status’ for both variables only at the forest sites (P < 0.01 and <0.001).
A total of 91 nematode species were recorded in study sites. The number of identified nematode species was highest in G (2016 and 2017: 68 and 55), followed by F (60 and 49), GS (62 and 56) and FS (53 and 48) (table 3). Aulolaimus costatus and Plectus longicaudatus were observed only in FS and GS. Anaplectus granulosus, Aulolaimus oxycephalus, Ceratoplectus assimilis, Microdorylaimus parvus, Tylencholaimus minimus, Trophurus sculptus and Tylenchus arcuatus were exclusively in GS, and Dorylaimoides limnophilus was exclusively in FS.
Check-list of nematode species in trophic groups, cp value and mean total abundance (A) (individual/100 g soil) and standard deviation (SD) in two years 2016 and 2017; in ‘ecosystem’ (Forest, Grassland) and ‘invasion status’ (Invaded, Uninvaded).

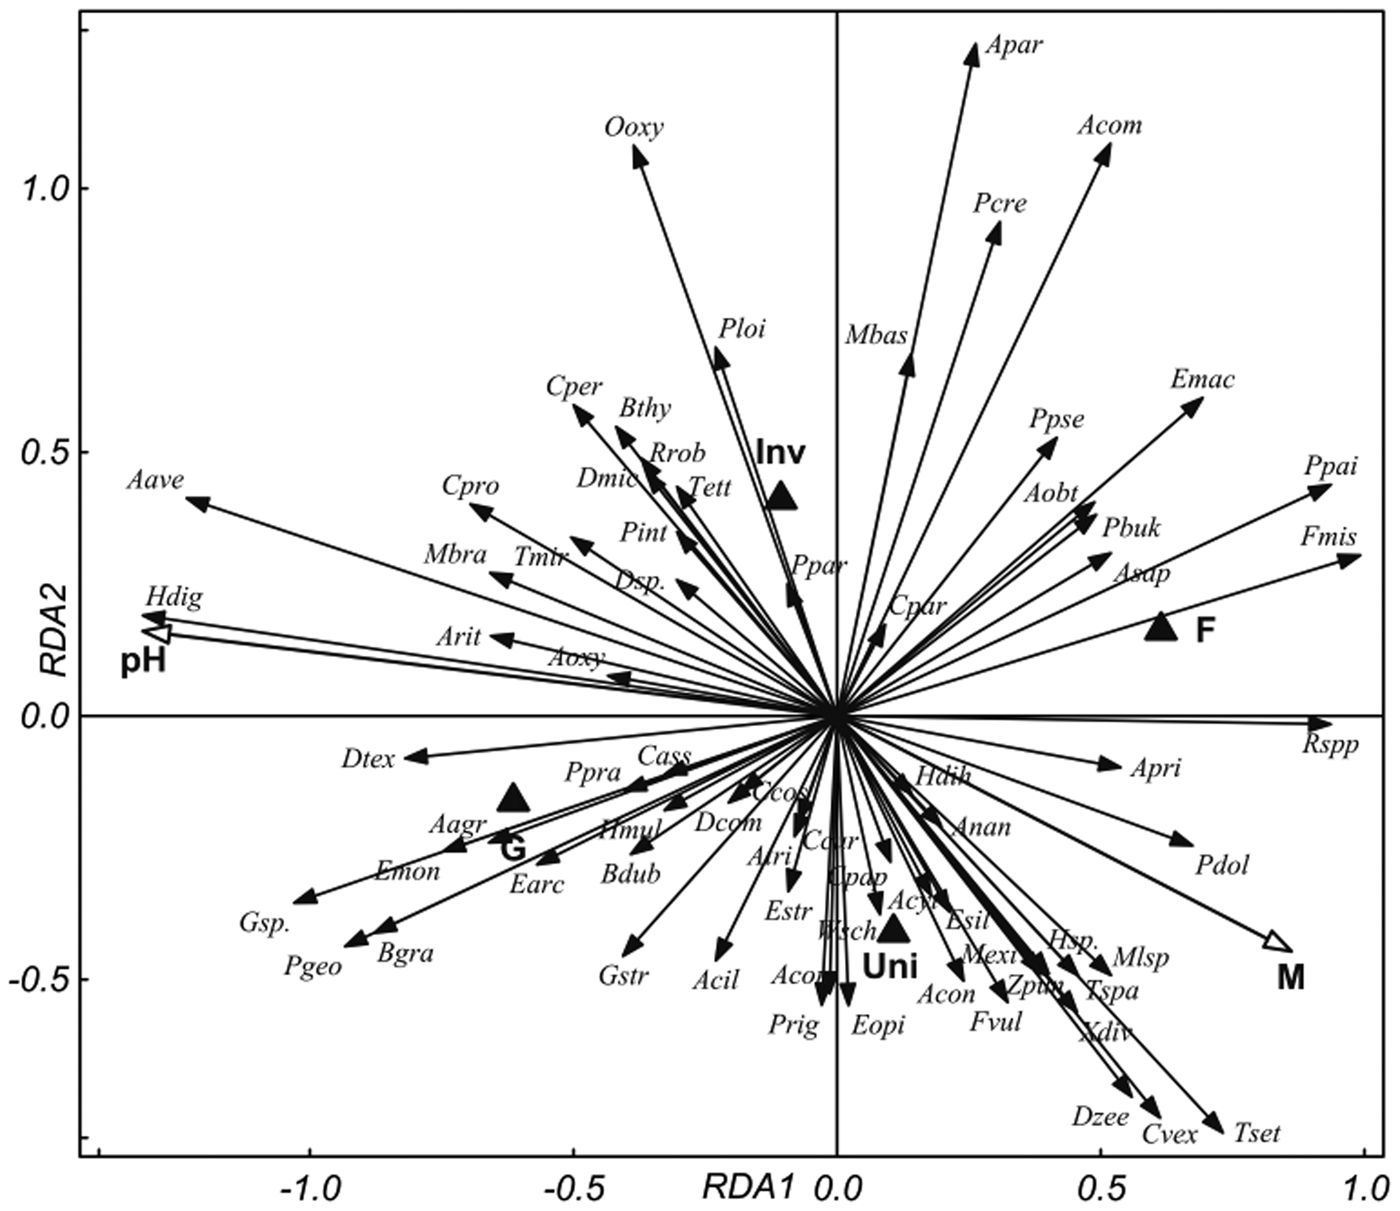
The RDA ordinations of the selected nematode species (containing 99% of total nematode abundance) for 2016 and 2017 are presented in figs 1 and 2, respectively. The two values of both nominal variables, ‘ecosystem’ and ‘invasion status’, differed from each other. For 2016, interactive forward selection indicated that pH (explaining 19.7% of the variance, P (adjusted) = 0.002), ‘ecosystem’ (7.1%, P (adjusted) = 0.002), soil-moisture content (6.7%, P (adjusted) = 0.002) and ‘invasion status’ (5.4%, P (adjusted) = 0.002) were significant. Monte Carlo permutation tests confirmed the significance of all constrained axes (pseudo F = 5.6, P = 0.002).
RDA ordination diagram of the nematode communities in the samples from 2016 with explanatory variables: soil pH; M, soil moisture; ‘ecosystem’ and ‘invasion status’. Ecosystem: F, forest; G, grassland. Invasion status: Inv, Invaded; Uni, Uninvaded. Quantitative variables are plotted as arrows with white heads, nominal variables as black triangles. Nematode genera are plotted as arrows with black heads (for abbreviations see table 3). The eigenvalues of the first two axes are 0.21 and 0.07 and they explain 55.2% and 19.3% of the fitted variation, respectively.
RDA ordination diagram of the nematode communities in the samples from 2017 with explanatory variables: soil pH; M, soil moisture; ‘ecosystem’ and ‘invasion status’. Ecosystem: F, forest; G, grassland. Invasion status: Inv, Invaded; Uni, Uninvaded. Quantitative variables are plotted as arrows with white heads, nominal variables as black triangles. Nematode genera are plotted as arrows with black heads (for abbreviations see table 3). The eigenvalues of the first two axes are 0.23 and 0.07 and they explain 60.9% and 19.1% of the fitted variation, respectively.
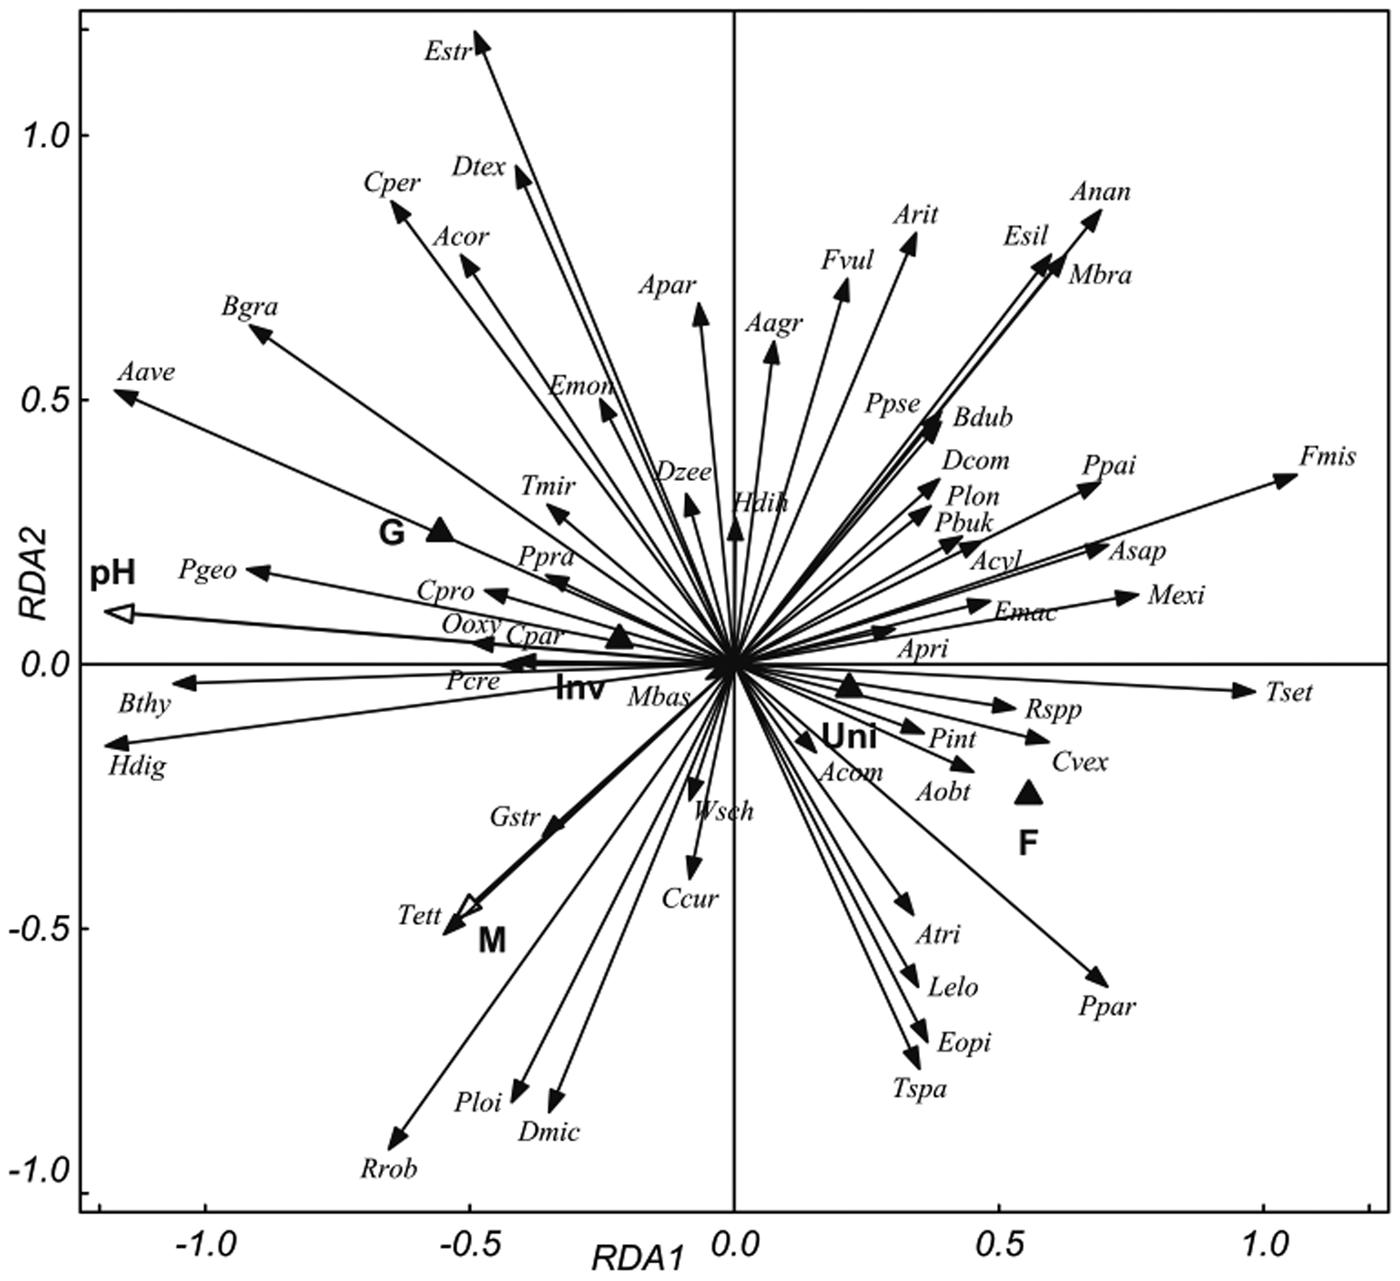
The results were similar for 2017: pH (explaining 20.9% of the variance, P (adjusted) = 0.003) ‘ecosystem’ (6.4%, P (adjusted) = 0.002), moisture content (6.1%, P (adjusted) = 0.002) and ‘invasion status’ (4.5%, P (adjusted) = 0.002) were significant. Monte Carlo permutation tests confirmed the significance of all constrained axes (pseudo F = 5.3, P = 0.002). Soil pH was the most important factor in both years, explaining >50% of the total variance (50.6, and 55.1% for 2016 and 2017, respectively), and the other factors explained between 11% and 18%. The general trends were similar for both years: forest and uninvaded sites were associated with soil-moisture content whereas grassland and invaded sites were associated with soil acidity. RDA analysis indicated that species diversity tends to be higher in uninvaded habitats, which is also supported by table 3. Several nematode species were found to be in positive correlation with S. gigantea invaded habitat, e.g. Aphelenchoides parietinus, A phelenchus avenae, Boleodorus thylactus, Coomansus parvus, Diphtherophora communis, Dorylaimoides micoletzkyi, Oxydirus oxycephalus, Pratylenchoides crenicauda and Thonus ettersbergensis. In contrast, Anatonchus tridentatus, Cervidellus vexilliger, Eudorylaimus opistohystera, E. silvaticus, Malenchus exiguus and Tripyla setifera were more abundant in the uninvaded sites. Bacterivore Plectus geophilus, fungivore A. avenae and herbivore Helicotylenchus digonicus tend to have higher abundance at higher pH, while T. setifera, C. vexilliger and Rhabditis spp. negatively correlated with soil acidity. In contrast, clear relation of species to soil moisture was not confirmed, different patterns were observed for different years, e.g. H. digonicus is at once positively (fig. 2) and once negatively (fig. 1) associated with soil moisture.
Nematode trophic groups and evaluation of the ecological and functional indices
Bacterivores were the most abundant trophic group at the forest sites, followed by fungivores and herbivores in 2016 and by herbivores and fungivores in 2017. In contrast, herbivores were most abundant at the grassland sites in both years, followed by bacterivores and fungivores (tables 1 and 2). The only trophic group significantly affected by both invasion status and ecosystem was herbivores. Their numbers were higher at the invaded than the uninvaded sites (P < 0.01; P < 0.001) and at the grassland than the forest sites (P < 0.001; P < 0.01). Besides herbivores, S. gigantea invasion significantly influenced the abundance of fungivores and predators in 2016; both were more abundant at the invaded than the uninvaded sites mostly due to the high abundances of Aphelenchoides spp. and O. oxycephalus. The bi-factorial interaction ‘ecosystem’ × ‘invasion status’ did not show significant impact on nematode trophic groups in 2016. A similar trend was recorded in 2017; however, two trophic groups, herbivores (P < 0.05) and predators (P < 0.01), were significantly affected by ‘ecosystem’ × ‘invasion status’. A subsequent t-test confirmed an invasion effect for both herbivores and predators (P < 0.001 and P < 0.01, respectively) at the forest sites, but only for predators (P < 0.05) at the grassland sites.
Only nematodes of cp3 group were significantly affected by both ecosystem and invasion status in both years (tables 1 and 2). Their numbers, mainly plant parasitic nematodes Helicotylenchus, Geocenamus and Pratylenchus, were significantly higher at the grassland than at the forest sites (P < 0.001) and at the invaded than at the uninvaded sites (P < 0.01) in both years. Solidago gigantea invasion also significantly affects the abundance of cp2 nematodes in 2016 and cp4 nematodes in 2017; however, while cp2 increased, cp4 decreased under invasive plant in comparison to uninvaded control sites (P < 0.01; P < 0.05). The number of cp1 nematodes was significantly higher at the forest than the grassland sites; mainly bacterivores (P < 0.001; P < 0.05) represented by Rhabditis spp.
MI, PPI, BI, EI and SI were not significantly different between the invaded and uninvaded sites. Only the CI differed significantly between the invaded and uninvaded sites in 2016 (P < 0.05) (tables 1 and 2). The CI and BI were significantly higher at the grassland than the forest sites in both years (P < 0.001; P < 0.01). On the other hand, the EI was lower at the grassland than the forest sites in both years (P < 0.001 or P < 0.01). The interaction of ‘ecosystem’ × ‘invasion status’ differed significantly for the BI, EI and SI in 2016 (all P < 0.01) (table 1) and only for the SI in 2017 (P < 0.05) (table 2). Subsequent t-tests confirmed the invasion effect for all these cases only for the forest sites (P < 0.05).
The results of the EI and SI plotted 95% of the forest soil samples in Quadrat B (figs 3 and 4), which characterized the soil food web as N-enriched, with bacterial pathways of decomposition, a low C:N ratio and a regulated food web. Most samples from G or GS were plotted in Quadrat B (25% or 45%) or C (40% or 30%), which characterized the soil as N-enriched, with bacterial and fungal pathways of decomposition channel, and a maturing or structured food web. Samples from FS were allocated in 50% in Quadrat A, which characterized a disturbed soil food web, with a lower C:N ratio and bacterial pathways of decomposition.
Food web condition in soil (forest and grassland) invaded and uninvaded by Solidago gigantea in 2016. The evaluation is based on nematode faunal analysis according to Ferris et al. (Reference Ferris, Bongers and de Goede2001).

Food web condition in soil (forest and grassland) invaded and uninvaded by Solidago gigantea in 2017. The evaluation is based on nematode faunal analysis according to Ferris et al. (Reference Ferris, Bongers and de Goede2001).

Discussion
The investigation of the belowground effects of S. gigantea invasion in two semi-natural habitats, grassland and forest, on soil properties such as soil-moisture content and pH was ambiguous. Lower soil-moisture content at the invaded sites in one year was probably due more to the season than plant invasion. Grassland soils tend to be less acidic than forest soils (Tisdale et al., Reference Tisdale, Nelson, Beaton, Tisdale, Nelson and Beaton1985), as we also observed (P < 0.001). pH was significantly higher at the invaded sites only in one of the two years. The effect of S. gigantea on soil pH was similarly inconsistent in other studies. Sterzyńska et al. (Reference Sterzyńska, Shrubovych and Nicia2017) and Zhang et al. (Reference Zhang, Wang, Qian and Li2009) reported that invasion by S. gigantea significantly increased soil pH, but Herr et al. (Reference Herr, Chapuis-Lardy, Dassonville, Vanderhoeven and Meerts2007) and Quist et al. (Reference Quist, Vervoort, Van Megen, Gort, Bakker, Van der Putten and Helder2014) reported the opposite trend, slightly lower pH where S. gigantea had invaded. Invasions by different alien plants often, but not always, alter soil properties, as recently reported by Ehrenfeld & Scott (Reference Ehrenfeld and Scott2001), Ehrenfeld (Reference Ehrenfeld2003) and Gaggini et al. (Reference Gaggini, Rusterholz and Baur2018).
Soil nematode abundance, diversity and species composition
Our results demonstrated that nematode abundance and diversity in soils invaded by S. gigantea differed significantly from neighbouring soils with native flora, regardless of ecosystem. We assumed that invasive plant S. gigantea would decrease both nematode abundance and diversity, which have been reported previously in surveys with some other invasive plants, e.g. Heracleum sosnowskyi (Renčo & Baležentiené, Reference Renčo and Baležentiené2015; Renčo et al., Reference Renčo, Kornobis, Domaradzki, Jakubska-Busse, Jurová and Homolová2019), Spartina alterniflora (Zhang et al., Reference Zhang, Neher, Li and Wu2018) or Bromus tectorum (Belnap et al., Reference Belnap, Phillips, Sherrod and Moldenke2005), but our hypothesis was only partly supported. Nematode diversity was lower at the sites invaded by S. gigantea than at both uninvaded grassland and forests ecosystems. On the other hand, we observed higher nematode abundance at invaded than uninvaded sites; however, abundance was higher only for some species from herbivore trophic group as B. thylactus, Geocenamus sp., Helicotylenchus spp., P aratylenchus bukowinensis, P. crenicauda and R otylenchus robustus.
Yeates (Reference Yeates1999) reported that lower diversities of plant species in ecosystems negatively affected the populations of herbivorous nematodes, and Bongers (Reference Bongers1990) indicated that herbivores depended on the establishment of higher plants with root systems that could serve as food sources. S. gigantea often grows in clumps, forming mostly monospecific stands. Therefore, the abundance of some herbivorous species in our study may have been higher because nutrient-use efficiency and biomass production are high in sites with S. gigantea (Vanderhoeven et al., Reference Vanderhoeven, Dassonville, Chapuis-Lardy, Hayez and Meerts2006; Scharfy et al., Reference Scharfy, Eggenschwiler, Olde Venterink, Edwards and Gusewell2009), which has a well-developed root system on which some plant parasitic nematodes can feed. Invasive plants are also generally exposed to more favourable plant soil feedback interactions than are their native neighbours (Klironomos, Reference Klironomos2002; Quist et al., Reference Quist, Vervoort, Van Megen, Gort, Bakker, Van der Putten and Helder2014). Similar, a higher abundance of herbivorous nematodes has been reported in the woody legume mesquite (Prosopis glandulosa) in its historical habitats (playas and arroyos) than in recently invaded desertified perennial grasslands in the Chihuahuan Desert, USA (Virginia et al., Reference Virginia, Jarell, Whitford and Freckman1992), or in sites invaded with Ambrosia trifida than in sites with native Chenopodium serotinum (Liang et al., Reference Liang, Li, Li and Zhang2007). Yeates & Williams (Reference Yeates and Williams2001) found seven additional taxa of herbivorous nematodes in areas invaded by the weed Tradescantia fluminensis than in reference locations in New Zealand. In contrast, Renčo & Baležentiené (Reference Renčo and Baležentiené2015) found significantly fewer plant parasites, e.g. Gracilacus straeleni, H. digonicus, P. bukowinensis, Pratylenchus pratensis and R. robustus, under invasive H. sosnowskyi than uninvaded control sites in three different habitats, suggesting a high sensitivity to accumulated toxic compounds. A similar lower abundance of herbivores was observed by Zhang et al. (Reference Zhang, Neher, Li and Wu2018). Scharfy et al. (Reference Scharfy, Güsewell, Gessner and Venterink2010) studied the effect of S. gigantea on soil microbes in typical wetland soils (Gleysols and a gleyic Cambisol) under controlled mesocosmic conditions and observed a significant decrease in bacterial biomass and an increase in fungal biomass in plant communities dominated by S. gigantea. Bacterivorous nematode taxa that feed on soil microbes in our study did not have a clear response to invasion, but the abundance of fungivorous nematodes that feed on fungal biomass was higher at the invaded sites. Quist et al. (Reference Quist, Vervoort, Van Megen, Gort, Bakker, Van der Putten and Helder2014) used a quantitative PCR-based method and determined 11 nematode taxa, also observed a higher abundance of fungivorous nematodes, but only of one family, Aphelenchoididae, in invaded sites in two contrasting habitats in riparian zones and semi-natural grasslands invaded by S. gigantea, but nematode families Aphelenchidae and Diphtherophoridae were unaffected. In our study we observed higher abundance of nematodes Aphelenchoides composticola, A. parietinus, A. ritzemabosi, A. saprophilus (Aphelenchoididae) and A. avenae (Aphelenchidae) and lower abundance of D. communis (Diphtherophoridae) in invaded than uninvaded sites (table 3). Other trophic groups such as omnivores and predators that tend to be sensitive to environmental changes (Bongers, Reference Bongers1990; Yeates et al., Reference Yeates, Bongers, de Goede, Freckman and Georgieva1993, Ferris et al., Reference Ferris, Bongers and de Goede2001) were slightly or not affected by ecosystem or invasion status. Quist et al. (Reference Quist, Vervoort, Van Megen, Gort, Bakker, Van der Putten and Helder2014), Renčo & Baležentiené (Reference Renčo and Baležentiené2015) and Fitoussi et al. (Reference Fitoussi, Pen-Mouratov and Steinberger2016) reported similar results.
Evaluation of the nematode ecological and functional indices
Nematodes possess the most important attributes among soil organisms of any prospective bioindicator (Cairns et al., Reference Cairns, McCormick and Niederlehner1993), due to their high abundance, diversity and trophic structure in soil (Bongers, Reference Bongers1990). Several attempts have been made to identify relationships between nematode community structure and the succession of natural ecosystems or environmental disturbances (De Goede et al., Reference De Goede, Georgieva, Verschoor and Kamerman1993; Yeates, Reference Yeates1999). The MI and PPI have also been used to infer the position of nematode communities along ecological successions (Bongers, Reference Bongers1990; Korthals et al., Reference Korthals, De Goede, Kammenga, Bongers, Van Straalen and Krivolutsky1996). The MI, used as a measure of the ecological successional status of soil communities (Bongers, Reference Bongers1990), was generally low in our study (mean MI 2.0–2.4), regardless of ecosystem or invasion status, indicating a disturbed and stressed environment (Bongers & Bongers, Reference Bongers and Bongers1998). The MI is based on the principle that different taxa have contrasting sensitivities to stress or disruption of the successional sequence because of their life-history characteristics expected by cp1-5 values. Cp1 nematodes represent colonisers with short generation times, large population fluctuations and high fecundity, and cp5 nematodes represent persisters, produce few offspring and generally appear later in succession (Bongers & Bongers, Reference Bongers and Bongers1998; Bongers & Ferris, Reference Bongers and Ferris1999). The abundances of cp1 and cp2 nematodes were higher at the invaded than the uninvaded sites, but not significantly.
The EI is a measure of opportunistic bacterivorous and fungivorous nematodes present in the soil ecosystem (Ferris et al., Reference Ferris, Bongers and de Goede2001). The mean EI value for all sites was higher than 50%, which indicates that the soil ecosystem was nutrient-enriched with prevailed bacteria-mediated, organic matter decomposition. Comparing ecosystems, EI was lower at the grassland than the forest sites in both years, but EI did not differ significantly between the invaded and uninvaded sites. The SI is the relative contribution of nematodes with higher cp-value (3–5) and indicates the state of food webs affected by stress or disturbance (Ferris et al., Reference Ferris, Bongers and de Goede2001). The value of SI can also specify the possibility of control of predators, but in our study did not differ significantly between invaded and uninvaded sites or ecosystems, confirming the findings by Renčo et al. (Reference Renčo, Kornobis, Domaradzki, Jakubska-Busse, Jurová and Homolová2019).
The CI indicates the predominant pathways of decomposition in soil food webs; values <50% indicate pathways dominated by bacteria, and values >50% indicate a higher proportion of fungal decomposition (Ferris, et al., Reference Ferris, Bongers and de Goede2001). The CI in our study was higher at the grassland than the forest sites (P < 0.01 both years) and at the invaded than the uninvaded sites (P < 0.05 only in 2016) but was below 50% in both cases, indicating that the decomposition was dominated by bacterial pathways. A similar value of CI under invasive H. sosnowskyi in the several different ecosystems with a monoculture was observed by Renčo et al. (Reference Renčo, Kornobis, Domaradzki, Jakubska-Busse, Jurová and Homolová2019). The BI provides information about the relative proportion of the basal (cp2) component of all nematodes present (Berkelmans et al., Reference Berkelmans, Ferris, Tenuta and van Bruggen2003) and was higher at the grassland than the forest sites, but did not differ significantly between the invaded and uninvaded sites. In conclusion, the colonization of S. gigantea in Europe represents a hazard at the scales of plant community and landscape (Quist et al., Reference Quist, Vervoort, Van Megen, Gort, Bakker, Van der Putten and Helder2014) and may greatly affect aboveground–belowground feedback, especially, when the invading species has vastly different physiological trays from native flora (Wardle et al., Reference Wardle, Bardgett, Klironomos, Setälä, van der Putten and Wall2004).
This study provides insights into the impact of invasion by S. gigantea on the variation of soil nematode communities in grassland and forest ecosystems it invades. Our results demonstrated that S. gigantea invasion affected the soil nematode communities positively by increasing their total abundance (mainly herbivores), but negatively by decreasing their diversity relative to neighbouring soil with native flora. The higher abundance of plant parasitic nematodes observed in both years at the invaded grasslands suggested that S. gigantea can serve as a potential reservoir of plant nematode pests, which can make recovery of these ecosystems more difficult. Maturity indices (MI, PPI) and SI were not able to distinguish the differences in the nematode communities between invaded and uninvaded sites in both ecosystems. Relative low values of MI, PPI and CI, moderate values of SI and high values of EI however suggest prevailing bacterial decomposition pathways in the soil food web of habitats studies, indicating disturbed and stressed environment.
Author ORCIDs
A. Čerevková, https://orcid.org/0000-0002-9615-9870.
Acknowledgement
The authors would like to thank National Agriculture and Food Centre, Slovakia, for providing the Corg and N data in soils samples.
Financial support
This study was supported by project Slovak scientific agency VEGA (grant number 2/0013/16) (0.8) and the project Environmental protection against parasitozoonoses under the influence of global climate and social changes (code IMTS: 26220220116) (0.2) supported by the ERDF-funded operational programme Research and Development.
Conflict of interest
None.



