1. Introduction
Examples of drop motion through a narrow opening are abundant in many natural as well as industrial applications such as geological
 $\text{CO}_{2}$
sequestration, underground oil recovery, food and pharmaceutical processing as well as other porous media flows. Accurate prediction of such flow is challenging for multiple reasons. First, if the drop fluid makes contact with the solid phase, the wettability of the surface affects the dynamics, and the motion of the contact line between interface and the solid surface is challenging to observe or simulate numerically (Herminghaus, Brinkmann & Seemann Reference Herminghaus, Brinkmann and Seemann2008; Bonn et al.
Reference Bonn, Eggers, Indekeu, Meunier and Rolley2009; Snoeijer & Andreotti Reference Snoeijer and Andreotti2013). Secondly, these flows can include a wide range of spatial and temporal scales. Third, in geological flows the natural formations of solid structures are complex (Olbricht Reference Olbricht1996).
In general, a moving drop must displace a second fluid when it interacts with an opening. The dynamics of the interaction can be influenced by gravity, the drop inertia, capillary and viscous forces, opening size and surface properties of the solid. Drops with negligible inertia have been studied widely in relation to porous media flows where contact line, viscous and capillary effects dominate the dynamics (Denesuk et al.
Reference Denesuk, Smoth, Zelinski, Kreidl and Uhlmann1993; Clarke et al.
Reference Clarke, Blake, Carruthers and Woodward2002). Drops can penetrate through the opening if their inertia is sufficient to overcome opposing interfacial tension, where a Weber number (
 $\mathit{We}$
):
 $$\begin{eqnarray}\mathit{We}={\it\rho}_{d}U^{2}D/{\it\sigma},\end{eqnarray}$$
can characterize this effect. Above,
 $D$
is the drop diameter,
 ${\it\rho}_{d}$
is the density of drop fluid,
 $U$
is approach velocity and
 ${\it\sigma}$
is interfacial tension. Literature that has considered inertial effects of drops entering a narrow opening in the presence of another liquid is limited. Experimental studies on drops falling through air have shown that axisymmetric impact of liquid drops on circular openings leads to various regimes of drop/opening interactions based on the drop velocity and the opening size (Lorenceau & Quéré Reference Lorenceau and Quéré2003; Delbos, Lorenceau & Pitois Reference Delbos, Lorenceau and Pitois2010). Lorenceau & Quéré (Reference Lorenceau and Quéré2003) studied axisymmetric impact of ethanol, acetone and silicone oil drops on an orifice plate made of stainless steel. They found a criterion for drop capture as a Weber number (
 $\mathit{We}_{d}$
) based on the orifice diameter
 $d$
that was independent of the drop diameter. For
 $We_{d}>7$
, a fraction of the drop penetrated and ejected a daughter drop below, while the remaining drop fluid spread laterally above the plate. Delbos et al. (Reference Delbos, Lorenceau and Pitois2010), who considered drops of water and water/glycerin mixture impacting on a cylindrical capillary tube axisymmetrically, showed that the penetration volume was a function of the tube diameter
 $d$
and contained only the drop fluid immediately above the tube orifice during impact. They also showed the existence of additional regimes such as limited impregnation, bubble formation, and slug formation for fixed drop size with a range of drop impact velocity (
 $0.1{-}2.5\ \text{m}\ \text{s}^{-1}$
) corresponding to a range of
 $\mathit{We}$
between 0.5 and 250.
In gravity-driven flows, the interfacial tension at the opening entrance acts against gravity, and Bond number (
 $\mathit{Bo}$
):
 $$\begin{eqnarray}\mathit{Bo}={\rm\Delta}{\it\rho}gD^{2}/{\it\sigma}\end{eqnarray}$$
(where
 ${\rm\Delta}{\it\rho}={\it\rho}_{d}-{\it\rho}_{s}$
is the difference in densities between drop and surrounding fluids, and
 $g$
is the acceleration due to gravity) can be used to characterize such interactions. Ratcliffe, Zinchenko & Davis (Reference Ratcliffe, Zinchenko and Davis2010) studied buoyancy-driven motion of drops (
 $\mathit{Bo}<50$
) through toroidal ring constrictions using an axisymmetric boundary integral method and predicted the transition between drop capture and release. In that study, inertia was negligible. Contrary to the liquid/air studies mentioned above, the authors found that the capture/release transition depended on opening-to-drop diameter ratio (
 $d/D$
) as well as
 $\mathit{Bo}$
. They also verified these results by conducting experiments on water/glycerin drops falling through canola oil and impacting on a rubber O-ring.
Depending on the flow conditions, drops may interact with a solid boundary indirectly, such that the drop deforms according to the bounding geometry, but remains separated from the solid surface by a thin layer of the surrounding continuous fluid. Drop/surface interaction may also be direct whereby the separating film is completely drained so that the drop fluid contacts the solid surface. Examples of indirect interaction are prevalent in liquid/liquid systems and have been studied for several geometries such as a constricted capillary, a capillary with obstacle etc. (see Tsai & Miksis Reference Tsai and Miksis1994; Cachile et al. Reference Cachile, Chertcoff, Calvo, Rosen, Hulin and Cazabat1996; Guido & Preziosi Reference Guido and Preziosi2010; Protiére et al. Reference Protiére, Bazant, Weitz and Stone2010; Ratcliffe et al. Reference Ratcliffe, Zinchenko and Davis2010). The numerical study conducted by Ratcliffe et al. (Reference Ratcliffe, Zinchenko and Davis2010) showed that, for drops passing through smooth constrictions, the film thickness can decrease to 0.1–1 % of drop radius depending on the drop Bond number. Zinchenko & Davis (Reference Zinchenko and Davis2006) also showed the existence of a film for drops moving through gaps between closely packed particles.
In the case of direct contact, the flow becomes more complex once the drop enters an opening as the moving contact line becomes difficult to track inside the solid. If the drop fluid makes contact with the solid surface, the wettability of the surface affects the flow. Delbos et al. (Reference Delbos, Lorenceau and Pitois2010) observed that for hydrophobic surfaces, a water drop with low Weber number (
 $\mathit{We}_{d}\sim 0.1$
) never penetrated a tube with very small pore-to-drop diameter ratio (
 $d/D\sim 0.2$
), whereas, for hydrophilic surfaces, the drop was sucked completely into the tube due to contact line motion. At higher
 $\mathit{We}_{d}\ ({\sim}13.6)$
, on the other hand, the drop broke in two: a slug of drop fluid penetrated the tube while the remaining fluid spread laterally across the outer surface. These results were supported by a recent numerical study on penetration and spreading of a drop impacting a on hydrophilic substrate containing a single capillary (see Ding & Theofanous Reference Ding and Theofanous2012).
In the current study, we investigate a liquid/liquid system with gravity-driven drops (
 $\mathit{Bo}\sim 0.8{-}11$
) encountering a circular opening on the axis of symmetry. The opening consists of an orifice within a thin plate with orifice-to-drop diameter ratio (
 $d/D$
) less than one. In practical situations, the edge of the opening entrance can be either rounded or sharp, so we address these two scenarios. We also investigate the effect of surface wetting by considering orifice plates made of different materials.
2. Experimental facility and methods
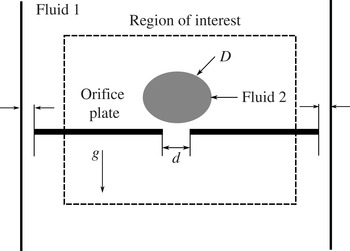
Figure 1 shows a schematic of the experimental set-up used for the current investigation. The set-up includes a tank (with cross-section
 $255\ \text{mm}\times 255\ \text{mm}$
and height of
 $280\ \text{mm}$
) made of acrylic sheets (thickness:
 $12\ \text{mm}$
) supported on an iron frame. The tank was filled with silicone oil to a height of
 $160\ \text{mm}$
. A rectangular plate (
 $254\ \text{mm}\times 230\ \text{mm}\times 2\ \text{mm}$
) with a circular orifice at its centre was suspended horizontally inside the tank at 120 mm below the free surface. Drops of water/glycerin, released above and axisymmetric to the orifice, encounter the plate after reaching terminal speed. The size of the tank was large enough (approximately 20 times the maximum drop diameter of
 $13\ \text{mm}$
), that the effects of the tank wall on the subsequent dynamics of the drop were minimal.
Schematic of the experimental set-up.

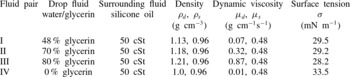
The physical properties of the liquid pairs used are summarized in table 1. The interfacial tension (
 ${\it\sigma}$
) for combination I was measured by Mohamed-Kassim & Longmire (Reference Mohamed-Kassim and Longmire2003, Reference Mohamed-Kassim and Longmire2004). The interfacial tension of combinations II, III and IV was measured using an imaging method. First, the shape of a drop with unknown
 ${\it\sigma}$
resting on, but not contacting, a flat surface was matched with the shape of a drop from combination I having known
 ${\it\sigma}$
, implying a matched Bond number. Then, the unknown surface tension was determined based on the matched Bond numbers for the two drops. Based on multiple measurements,
 ${\it\sigma}$
was estimated within an uncertainty of 3 %.
Liquid properties of water/glycerin solutions and silicone oil (Dow Corning fluid) at 20 °C. The subscripts
 $d$
and
 $s$
denote properties of the drop and surrounding fluids respectively. Second column shows percentage of glycerin by volume.

The drop fluid was extracted from a separate reservoir of water/glycerin mixture into a long glass tube. Two tubes with internal diameter 6.5 and
 $8\ \text{mm}$
were used to produce drops of different diameters. The tube, carrying the drop fluid, was passed through a hole in a small rectangular piece confined to a slot cut across the tank lid. The bottom end of the tube was held at the free surface and the top end was connected to a closed solenoid valve. To release the drop, the valve was opened using the leading edge of a positive square wave.
Two materials – commercial acrylic and borosilicate glass – were used for the orifice plates. In order to study the effect of orifice geometry, we considered two cases. In one, the edges of the orifice were rounded (with edge radius approximately
 $0.5\ \text{mm}$
) on both sides of the plate. In the other case, the edges were maintained sharp. Both rounded and sharp edges were considered for four orifice diameters (
 $d$
): 4, 5, 6 and
 $8\ \text{mm}$
. Two additional acrylic plates with
 $d=5.5\ \text{mm}$
and
 $4.5\ \text{mm}$
were used with rounded and sharp edges respectively. Both round and sharp edged glass orifices were fabricated with utmost care to minimize any irregularity near the edge. Before each experiment, the plate was first washed with distilled water, then dried and carefully cleaned with ethyl alcohol and acetone in sequence to remove any oil specks.
For flow visualization, the tank was back-lit by a white fluorescent lamp. Since the drop and the surrounding oil were either matched (combination I) or fairly close in their refractive indices, a very small amount (one drop) of food-dye was mixed with the drop fluid in the drop reservoir to distinguish the drop from the surrounding oil. The resulting volume fraction of the dye was approximately
 $1\times 10^{-4}$
. The added dye has negligible effect on the surface tension between the drop and surrounding fluid. A Fastcam Ultima APX camera (10 bit CMOS sensor,
 $1024\times 1024$
resolution and frame rate 250–1000 Hz) monitored the side view of the drop during its interaction with the orifice. A
 $105\ \text{mm}$
Micro Nikkor lens was mounted on the camera to obtain fields of view of
 $42\ \text{mm}\times 42\ \text{mm}$
.
In order to estimate the equivalent drop diameter (
 $D$
), the boundary of the drop was isolated for 10 consecutive instantaneous images from a given sequence. This was done in an automated way using MATLAB. First an image without the drop was subtracted from the image containing the drop to remove all background noise. Then the image was converted to binary format, and morphological closing was applied to remove the rough edges from the boundary of the drop. Further, morphological filling was used to fill background holes that might remain within the drop. Finally, the area opening operation was used to clear remaining noise from the background. Once the drop was isolated from the background, its volume and surface area were calculated from the identified drop interface image by summing up the volume and surface area of each horizontal cross-section. Then, a spherical-equivalent drop diameter was determined based on the calculated drop volume. An average drop diameter was then calculated based on 10 sequential images prior to drop impact. Using this method, the spherical diameter (
 $D$
) was estimated within an uncertainty of
 $\pm 0.1\ \text{mm}$
to 95 % confidence. The terminal velocity (
 $U_{t}$
) of the drop was calculated by first identifying the centroid of the drop (using regionprops() function in MATLAB) and then averaging the displacements of the centroid for 10 consecutive images separated by
 ${\rm\Delta}t=10\ \text{ms}$
. The uncertainty in
 $U_{t}$
was estimated as
 $0.1\ \text{cm}\ \text{s}^{-1}$
.
3. Results and discussion
3.1. Surface wetting
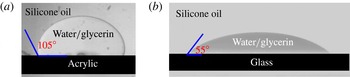
When a drop surrounded by a less dense liquid approaches a surface, the underlying film of surrounding liquid has to drain before the drop fluid can contact the solid surface. We conducted a series of experiments to measure the static contact angles the drop fluid made with the acrylic and glass surfaces in the presence of silicone oil. For liquid combination I (the primary combination used in the experiments) and a drop with diameter
 ${\sim}5\ \text{mm}$
, the film takes approximately 30 s to drain before a contact between the drop fluid and the surface is initiated. Immediately after the initial contact, the interfacial contact line advances radially outward such that the drop fluid spreads over the surface and eventually attains an equilibrium shape. Figures 2(a) and 2(b) show the static advancing contact angles (
 ${\it\theta}$
) for acrylic and glass surfaces respectively. For the acrylic surface, the contact angle is obtuse (
 $107^{\circ }\pm 2^{\circ }$
) with less contact area (weak wetting) between drop and solid surface. For the glass surface, the contact angle is acute (
 $55^{\circ }\pm 1.5^{\circ }$
) with more contact area (strong wetting). Both contact angles are estimated within 95 % confidence.
Snapshot of a drop in equilibrium contacting a flat surface: (a) acrylic surface and (b) glass surface. The viscosity ratio (
 ${\it\lambda}={\it\mu}_{d}/{\it\mu}_{s}$
) is 0.15. Equivalent drop diameter (
 $D$
) is approximately 5 mm.

3.2. Scaling
In this study, a drop at rest accelerates under gravity and attains significant inertia before reaching a terminal speed (
 $U_{t}$
) above the orifice. Since the drop is driven downward by gravity, both before and after orifice impact, we use
 $\mathit{Bo}$
rather than
 $\mathit{We}$
as the primary parameter to characterize the flow. As will be shown in the results, even if the approach inertia, characterized by
 $\mathit{We}$
, is small or dissipated during drop/plate impact, gravity can still, under appropriate conditions, provide sufficient potential to drive the drop through the orifice. In this way, the flow under study is similar to the gravity-driven flow of Ratcliffe et al. (Reference Ratcliffe, Zinchenko and Davis2010) where inertia was negligible. The range of
 $\mathit{Bo}$
considered in the current study is 0.8–11, while the range of
 $\mathit{We}_{i}$
is 0.1–7 (see table 2). Here,
 $\mathit{We}_{i}$
is based on drop velocity immediately before impact.
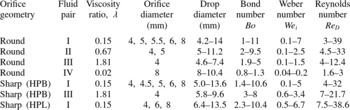
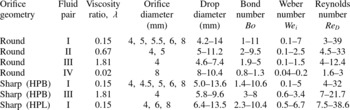
Experimental parameters for drop impact. The drop-to-surrounding oil viscosity ratio (
 ${\it\mu}_{d}/{\it\mu}_{s}$
) is denoted as
 ${\it\lambda}$
.
 $\mathit{We}_{i}={\it\rho}_{d}U_{i}^{2}D/{\it\sigma}$
is the drop Weber number immediately before impact.
 $\mathit{Re}_{D}={\it\rho}_{s}U_{t}D/{\it\mu}_{s}$
is the Reynolds number of the drop during free fall. HPB denotes hydrophobic and HPL hydrophilic.
The inertia of the approaching drop can be compared to the gravitational force using a Froude number (
 $\mathit{Fr}$
):
 $$\begin{eqnarray}\mathit{Fr}=\frac{{\it\rho}_{d}U_{t}^{2}}{{\rm\Delta}{\it\rho}gD},\end{eqnarray}$$
where
 ${\it\rho}_{d}$
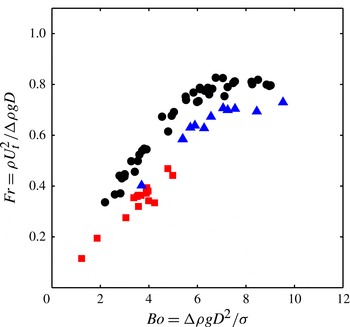
is the density of drop fluid. Figure 3 shows the variation of
 $\mathit{Fr}$
with respect to
 $\mathit{Bo}$
for three drop-to-surrounding-fluid viscosity ratios (
 ${\it\lambda}={\it\mu}_{d}/{\it\mu}_{s}=0.15$
, 0.67 and 1.81). For the cases considered,
 $\mathit{Fr}$
varies from 0.85 down to 0.1. As
 $\mathit{Bo}$
decreases below 5,
 $\mathit{Fr}$
decreases sharply due to increasing drag exerted by the surrounding oil on the drop. Thus, for the higher
 $\mathit{Bo}$
drops considered, gravity and inertia are of similar order, but for the lower
 $\mathit{Bo}$
drops, inertia at and after plate impact is small compared to gravity. This range of
 $\mathit{Fr}$
can be contrasted with the liquid/air studies of Lorenceau & Quéré (Reference Lorenceau and Quéré2003) and Delbos et al. (Reference Delbos, Lorenceau and Pitois2010) where Froude numbers were of order 4–40 and the low-inertia liquid/liquid studies of Ratcliffe et al. (Reference Ratcliffe, Zinchenko and Davis2010) where Froude numbers were 0.06–0.08. We note also that, as the drop approaches the orifice plate, it has to drive the oil above the plate out of its way causing a deceleration. The impact velocity (
 $U_{i}$
) was measured by estimating the drop displacement over a time interval
 ${\rm\Delta}t\sim 10\ \text{ms}$
prior to the intersection of the leading interface with the plate surface plane. This interval was chosen to minimize uncertainty in estimating pixel displacement. For cases including a range of
 $d/D$
,
 ${\it\lambda}$
and
 $\mathit{Bo}$
, the impact velocity was
 $U_{i}=(0.8\pm 0.05)U_{t}$
.
Drop Froude number (
 $\mathit{Fr}$
) with respect to Bond number (
 $\mathit{Bo}$
) for viscosity ratios
 ${\it\lambda}=0.15$
(●), 0.67 (▴) and 1.81 (▪).

After impact, the gravitational force that drives the drop fluid downward can be estimated as
 $F_{g}\sim {\rm\Delta}{\it\rho}gD^{3}$
. A characteristic time scale based on
 $F_{g}$
is defined as:
 $$\begin{eqnarray}t_{g}=\sqrt{\frac{{\it\rho}_{d}D}{{\rm\Delta}{\it\rho}g}}.\end{eqnarray}$$
On the other hand, the dominant force opposing the forward drop motion is related to the scale of the orifice (
 $d$
). A characteristic time scale for this capillary force is
 $$\begin{eqnarray}t_{{\it\sigma}}=\sqrt{\frac{{\it\rho}_{d}d^{3}}{{\it\sigma}}}.\end{eqnarray}$$
The ratio of these two time scales (
 $\mathscr{R}=t_{{\it\sigma}}/t_{g}$
) relates to
 $\mathit{Bo}$
and the orifice-to-drop diameter ratio (
 $d/D$
) as
 $$\begin{eqnarray}\mathscr{R}=\sqrt{\frac{{\rm\Delta}{\it\rho}gd^{3}}{{\it\sigma}D}}=\sqrt{\mathit{Bo }(d/D)^{3}}.\end{eqnarray}$$
In addition to the capillary force, viscous forces oppose the drop motion through the orifice. The viscous force inside the orifice is related to a viscous time scale (
 $t_{{\it\mu}}={\it\rho}_{d}d^{2}/{\it\mu}_{d}$
). The ratio between
 $t_{{\it\sigma}}$
and
 $t_{{\it\mu}}$
can be written as the Ohnesorge number (
 $\mathit{Oh}$
), where
 $$\begin{eqnarray}\mathit{Oh}=\frac{{\it\mu}_{d}}{\sqrt{{\it\rho}_{d}{\it\sigma}d}}.\end{eqnarray}$$
For the four drop fluids used (see table 1) and the smallest orifice diameter
 $d=4\ \text{mm}$
,
 $\mathit{Oh}=0.02$
, 0.08, 0.2 and 0.003 respectively. Based on these values, capillary forces will typically play a stronger role than viscous forces within the orifice.
3.3. Round-edged orifice
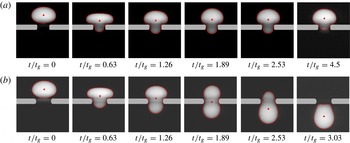
In general, after impacting on an orifice, a drop may either be captured above it or pass through completely. The visualization sequences in figures 4(a) and 4(b) show examples of these outcomes for
 ${\it\lambda}=0.15$
(fluid combination I) and
 $\mathit{Bo}=4.9$
impacting on a round-edged hydrophobic (HPB) orifice at orifice-to-drop diameter ratios
 $d/D=0.54$
and 0.65 respectively. Time is normalized by
 $t_{g}$
, with
 $t=0$
at impact. The drop boundary and centre of mass are marked in each frame.
Time sequence of a drop (
 $\mathit{Bo}=4.9$
,
 ${\it\lambda}=0.15$
) impacting on a circular round-edged hydrophobic orifice with (a)
 $d/D=0.54$
and (b)
 $d/D=0.65$
. Time is normalized by the gravitational time scale
 $t_{g}$
. The drop boundary (– –), drop centroid (
 $\boldsymbol{\cdot }$
) and location of the orifice plate are shown in each frame.

After impact, most of each drop expands radially above the plate. At
 $t=0.63t_{g}$
, both drops have reached a maximum width of approximately
 $1.2D$
(see figure 4). A small part of each drop penetrates into the orifice, but the forward motion is opposed by surface tension. For the smaller orifice with
 $d/D=0.54$
, the maximum axial penetration occurs at
 $t=1.26t_{g}$
, after which the leading interface retracts backward (see
 $t=1.89{-}4.5t_{g}$
). During this sequence, the drop fluid above the plate also retracts radially inward. The interfacial motion in combination with gravity result in some shape oscillations until
 $t=4.5t_{g}$
, after which all macroscopic motions in the drop subside, and the captured drop remains stationary above the orifice. This example demonstrates a case where the available potential and kinetic energy are just balanced by the increase in drop surface energy required to squeeze through the orifice.
When
 $d/D$
is increased to 0.65 as in figure 4(b), the drop deformation as well as the increase in required surface energy is smaller. After
 $t=1.26t_{g}$
, the lateral interface retraction leads to further penetration of the drop fluid into and through the orifice. While the drop leading interface continues to move forward, the trailing fluid above the plate is accelerated downward by the curved interface at
 $t=1.89t_{g}$
. As the trailing interface moves through the orifice, however, it rotates so that it becomes slightly concave after it emerges underneath (
 $t=3.03t_{g}$
). The released drop eventually relaxes back to its initial shape as it accelerates and propagates downward.
Due to the continuously varying slope of the rounded orifice edge, a thin film of surrounding oil exists between the drop fluid and the solid surface throughout each sequence. For comparison, the drainage time of the oil film between an equivalent drop and an underlying continuous surface of approximately 30 s is 30–50 times higher than the total time of drop motion through the orifice for the cases studied. Since the drop fluid does not contact the orifice surface during the macroscopic motion described above, the surface wettability does not affect the outcome. This was verified by conducting multiple experiments with round-edged hydrophilic and hydrophobic orifices under various matched flow conditions. Here we note that the thin film separating captured drops from the plate would eventually drain, leading to a contact between drop fluid and the orifice surface. For
 ${\it\lambda}=0.15$
, this drainage time was
 $t\sim 100t_{g}$
. Once the drop fluid contacted the surface, the drop shape changed from that observed in the last frame of figure 4(a), and the subsequent equilibrium shape was dependent on the surface wettability (HPB versus HPL). For both HPB and HPL surfaces, however, the drop fluid remained captured so that the critical capture boundary of
 $\mathscr{R}=0.9$
was not affected.
In order to establish conditions separating drop passage from capture, we plot
 $d/D$
against
 $\mathit{Bo}$
and
 $\mathscr{R}$
for various cases of drops impacting on a round-edged HPB orifice (see figure 5). The data include all four fluid combinations in table 1 as well as orifice sizes ranging from 4 to 8 mm in table 2. In addition to the above two outcomes, some drops broke into two or more fragments after their release. The three regimes of drop capture, release, and release with breakup are each depicted by a sample snapshot.
Round-edged hydrophobic orifice: regime maps for
 $d/D$
against (a)
 $\mathit{Bo}$
and (b)
 $\mathscr{R}$
, delineating three outcomes: capture (
 ${\it\lambda}=0.15$
: ●, 0.67: ♦, 1.81: ▴, 0.02: ▪), release (
 ${\it\lambda}=0.15$
: ○, 0.67: ♢, 1.81: ▵, 0.02: ▫) and release with breakup (
 ${\it\lambda}=0.15$
:
 $\otimes$
, 0.67:

 $d/D$
near
 $\mathscr{R}=0.9$
. The maximum uncertainty in
 $\mathit{Bo}$
is estimated as
 $\pm 0.2$
. The maximum uncertainty in
 $\mathscr{R}$
falls within the size of the symbol.

Each plot includes a curve representing
 $\mathscr{R}=0.9$
showing that this criterion nicely separates the capture and release regimes over the entire range studied except for water drops near
 $\mathit{Bo}=1$
where
 $d/D>0.88$
. Thus, except for the cases with large
 $d/D$
, all drops with
 $\mathscr{R}<0.9$
were captured. Under these conditions, neither the drop inertia during impact nor the drop weight can overcome the capillary force required to penetrate the orifice. All drops with
 $\mathscr{R}>0.9$
completely penetrated the orifice and were subsequently released, exhibiting dynamics similar to those described in figure 4(b). These results are in good agreement with the numerical results of Ratcliffe et al. (Reference Ratcliffe, Zinchenko and Davis2010) who found a similar division between capture and release of
 $\mathscr{R}=0.83$
for gravity-driven drops moving through rings with
 $d/D<0.7$
. The current data suggest that
 $\mathscr{R}=0.9$
works well up to
 $d/D=0.8$
for the orifice geometry. As
 $d/D$
increases beyond these limits, the drop deformation required for passage through the orifice become small. The critical value of
 $\mathscr{R}$
separating capture and release therefore must decrease toward zero as
 $d/D$
approaches one. This effect is also observable in the simulation results of Ratcliffe et al. (Reference Ratcliffe, Zinchenko and Davis2010).
For the drops that release, we define release time (
 $t_{r}$
) as the duration between impact time and the time when the drop trailing interface crosses the lower surface of the orifice plate. If capillary and viscous effects are small, the release time (
 $t_{r}$
) for drops with
 $\mathscr{R}>0.9$
can be related to drop volume and the volumetric flow rate passing through the orifice as
 $V/Q$
where
 $V$
is drop volume (
 ${\sim}D^{3}$
) and
 $Q\sim U_{i}d^{2}$
. The impact velocity
 $U_{i}$
is defined as the drop centroid velocity measured immediately before the drop impacts on the orifice. This leads to a passage time scale
 $t_{i}^{\ast }$
defined as:
 $$\begin{eqnarray}t_{i}^{\ast }=\frac{D^{3}}{U_{i}d^{2}}.\end{eqnarray}$$
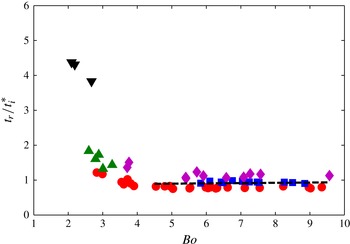
Figure 6 shows
 $t_{r}$
normalized by
 $t_{i}^{\ast }$
for drops with viscosity ratios
 ${\it\lambda}=0.15$
, 0.67 and
 $\mathit{Bo}=0.8{-}11$
. For
 $\mathit{Bo}>4.5$
and both viscosity ratios, all data points collapse at
 $t_{r}\sim 0.9t_{i}^{\ast }$
suggesting that, over this range, the drop release time is independent of capillary or viscous effects. As
 $\mathit{Bo}$
decreases below 4.5,
 $t_{r}/t_{i}^{\ast }$
begins to increase for both viscosity ratios suggesting that capillary effects become important. The sharper increase for larger drop viscosity suggests that viscous effects also become important.
Variation of release time (
 $t_{r}$
) normalized by
 $t_{i}^{\ast }$
for drops with
 $\mathscr{R}>0.9$
impacting on a round-edged hydrophobic orifice with orifice diameter
 $d=5\ \text{mm}$
(▴,
 $d/D=0.66{-}0.81$
and
 ${\it\lambda}=0.15$
), 6 mm (●,
 $d/D=0.47{-}0.85$
and
 ${\it\lambda}=0.15$
), 8 mm (▪,
 $d/D=0.64{-}0.85$
and
 ${\it\lambda}=0.15$
), 4 mm (▾,
 $d/D=0.5{-}0.75$
and
 ${\it\lambda}=0.67$
) and 5 mm (♦,
 $d/D=0.69{-}0.75$
and
 ${\it\lambda}=0.67$
). The dashed line indicates a linear fit for
 $\mathit{Bo}>4.5$
.

To understand these effects, we first compare examples with matched
 ${\it\lambda}$
but different
 $\mathit{Bo}$
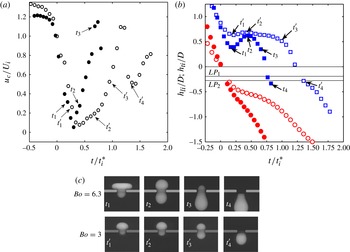
in figure 7 which includes variation of drop centroid velocity (
 $u_{c}$
) normalized by terminal velocity (
 $U_{i}$
), normalized vertical positions of drop leading (
 $h_{li}$
) and trailing interfaces (
 $h_{ti}$
), and visualizations at four specific times from each case.
(a) Centroid velocity (
 $u_{c}$
) normalized by
 $U_{i}$
(
 $\mathit{Bo}=6.3$
: ●,
 $\mathit{Bo}=3$
: ○) and (b) vertical position of drop leading interface (
 $h_{li}$
) and trailing interface (
 $h_{ti}$
) normalized by drop diameter (
 $D$
) for drops (
 ${\it\lambda}=0.15$
) with
 $\mathit{Bo}=6.3$
,
 $d/D=0.57$
(
 $h_{li}$
: ●,
 $h_{ti}$
: ▪) and
 $\mathit{Bo}=3$
,
 $d/D=0.68$
(
 $h_{li}$
: ○,
 $h_{ti}$
: ▫) impacting on a round-edged hydrophobic orifice. Time is normalized by
 $t_{i}^{\ast }$
. The lines
 $\mathit{LP}_{1}$
and
 $\mathit{LP}_{2}$
show normalized locations of the lower plate surface for
 $\mathit{Bo}=6.3$
and 3 respectively. (c) Snapshots of drop at four specific times for each case.

We first consider
 $\mathit{Bo}=6.3$
, for which part of the impacting drop penetrates the orifice while the remainder flattens against the plate. The drop fluid above the plate quickly rebounds and reorients itself into a dumbbell shape with diameter close to
 $d$
(
 $t_{2}$
in figure 7
c). Although the drop centroid velocity decreases to near zero after impact (see figure 7
a), the leading interface and accompanying drop fluid maintain a relatively steady downward velocity (see figure 7
b). After the drop reorients itself, it then moves easily through the orifice, and the centroid velocity accelerates to nearly the drop terminal speed. At this time, the orifice is still filled with the trailing drop fluid. The centroid velocity then decelerates as the drop fluid and trailing interface exit the orifice. This temporary deceleration is likely to be due to the necessity that, by continuity, the exiting drop must drag the more viscous surrounding fluid behind it through the orifice. Zinchenko & Davis (Reference Zinchenko and Davis2006) and Ratcliffe et al. (Reference Ratcliffe, Zinchenko and Davis2010) observed a similar deceleration in their simulations.
When
 $\mathit{Bo}$
is reduced to 3, the drop is slowed significantly in its passage through the orifice such that
 $t_{r}/t_{i}^{\ast }=1.4$
. The images in figure 7(c) show that this drop deforms much less upon impact, and consequently the drop fluid above the plate retracts inward and upward by only a small amount. Thus, a portion of the drop fluid comes to rest on top of the plate reducing the available gravitational potential above the orifice. In addition, the leading drop fluid slows significantly by
 $t_{1}^{\prime }$
(figure 7
b), and the centroid velocity drops nearly to zero. (This example has
 $\mathscr{R}=0.97$
, which is barely above the threshold for release.) The centroid velocity remains low over a significant time (
 $t_{2}^{\prime }$
to
 $t_{3}^{\prime }$
) during which drop fluid slowly spills over the plate edge and through the orifice. After a dumbbell shape is achieved at
 $t_{3}^{\prime }$
, the drop accelerates in a manner similar to the
 $\mathit{Bo}=6.3$
case. Also similar to the
 $\mathit{Bo}=6.3$
case, this drop decelerates as the trailing fluid exits the orifice. Since it has a smaller gravitational potential, the deceleration is somewhat stronger than for
 $\mathit{Bo}=6.3$
.
If
 $\mathit{Bo}$
is held constant at 3, but the drop viscosity (and
 ${\it\lambda}$
) are increased, figure 6 shows that
 $t_{r}/t_{i}^{\ast }$
will also increase. In terms of the evolution described above, the initial impact of the higher viscosity drop appears similar in terms of dimensionless velocity and shape evolution (up to
 $t_{2}^{\prime }$
). The subsequent spillage of drop fluid through the orifice (to reach the dumbbell shape at
 $t_{3}^{\prime }$
in figure 7
c) lasts much longer however, due to the larger drop viscosity. This is the dominant factor in the relative increase in
 $t_{r}/t_{i}^{\ast }$
.
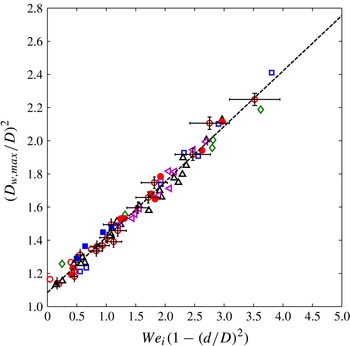
Based on the visualizations in figures 4 and 7(c), we consider further the lateral drop deformation upon impact where we define the maximum lateral diameter of the deformed drop as
 $D_{w,max}$
. For a drop impacting on a plate with no orifice, an energy balance can be written as:
 ${\it\rho}U_{i}^{2}D^{3}\sim {\it\sigma}(D_{w,max}^{2}-D^{2})$
if viscous losses are neglected. This yields a relation
 $(D_{w,max}/D)^{2}\sim \mathit{We}_{i}$
similar to the one noted by Richard & Quéré (Reference Richard and Quéré2000), but contradicting
 $D_{w,max}/D\sim \mathit{We}_{i}^{1/4}$
found by Clanet et al. (Reference Clanet, Béguin, Richard and Quéré2004) for water drops in air with higher
 $10<\mathit{We}_{i}<10\,000$
impacting on a superhydrophobic surface. For the impact parameters in the present experiments, which have maximum
 $\mathit{We}_{i}\sim 7$
, the results follow the first relation and not the second, most likely due to the more limited drop deformation.
If we extend the energy balance to drops impacting on a plate with an orifice, part of the drop kinetic energy remains with the fluid that initially penetrates into the orifice. If we assume that the remaining volume of drop fluid has kinetic energy
 ${\it\rho}_{d}U_{i}^{2}D(D^{2}-d^{2})$
, and that this kinetic energy is converted into surface energy, we obtain a modified relation for the maximum lateral diameter as:
 $$\begin{eqnarray}(D_{w,max}/D)^{2}\sim \mathit{We}_{i}(1-(d/D)^{2}).\end{eqnarray}$$
These quantities are plotted in figure 8 for two viscosity ratios and cases with no orifice,
 $d=4$
, 5, 6, and
 $8\ \text{mm}$
. All of the data collapse on a single line with slope 0.33. These results therefore reinforce visual observations that drop viscosity and any associated dissipation have no significant effect on the initial drop flattening after impact.
Maximum radial expansion
 $(D_{w,max}/D)^{2}$
with respect to
 $We_{i}(1-(d/D)^{2})$
for
 ${\it\lambda}=0.15$
(flat plate: ♢,
 $d=4\ \text{mm}$
: ▫, 5 mm: ○, 6 mm: ▵, 8 mm: ◃) and
 ${\it\lambda}=0.67$
(
 $d=4\ \text{mm}$
: ▪ and 5 mm: ●). The dashed line is a linear fit to all the data. The error bars indicate uncertainties for the case with
 ${\it\lambda}=0.15$
and
 $d=5\ \text{mm}$
.

Drops with
 $\mathscr{R}>0.9$
and larger
 $\mathit{Bo}$
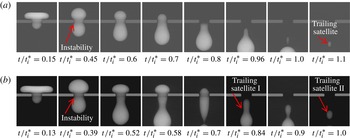
broke into two or more fragments below the orifice plate as shown in figure 5. In general, breakup of a liquid column is initiated by a capillary instability that grows in time (see Bogy Reference Bogy1979; Longmire, Norman & Gefroh Reference Longmire, Norman and Gefroh2001). Figure 9 shows sequences of drop motion for
 $\mathit{Bo}=6.6$
(single breakup) and 9.4 (multiple breakup). The first two frames correspond with the local minimum and maximum of trailing interface height observed in figure 7. In the second frame, each drop has been squeezed into a dumbbell shape with neck inside the orifice. The leading head then propagates downward due to gravity while the trailing head fluid is restrained and slowed by the plate. The drop elongates in the axial direction so that the neck (local inflection in the interface curvature) travels downward. In both cases, the neck diameter shrinks until the leading fluid pinches off leaving a trailing satellite behind it. For
 $\mathit{Bo}=6.6$
, the breakup occurred after the entire drop exited the orifice. For
 $\mathit{Bo}=9.4$
, on the other hand, the first breakup occurred when the trailing edge was still above the plate. This trailing drop fluid develops a second inflection and instability at the orifice which grows in a similar fashion and leads to a second breakup. The line plotted in figure 5(a), represents a best fit separating the release and release with breakup outcomes for the orifice with rounded edge. Ratcliffe, Zinchenko & Davis (Reference Ratcliffe, Zinchenko and Davis2012), who studied gravity-driven drop motion through rounded three-dimensional constrictions, also observed breakup for some drops that released. Similar to the present study, the trailing satellite was never captured at the orifice so that all of the drop fluid passed through the constriction.
Time sequence of drop breakup during release through a round-edged orifice with
 ${\it\lambda}=0.15$
for (a)
 $\mathit{Bo}=6.6$
,
 $d/D=0.56$
and (b)
 $\mathit{Bo}=9.4$
,
 $d/D=0.47$
. Time is normalized by
 $t_{i}^{\ast }$
.

The sequence in figure 9(b) helps demonstrate that deformation of the drop fluid into a longer, narrower column (associated with larger
 $\mathit{Bo}$
for fixed
 $d/D$
or smaller
 $d/D$
for fixed
 $\mathit{Bo}$
) favours growth of the capillary instability and eventual pinch off. Within the breakup regime (see figure 5), either an increase in
 $\mathit{Bo}$
or a decrease in
 $d/D$
led to an increase in the volume fraction (
 $V_{s}/V$
), where
 $V_{s}$
is the volume of the trailing satellite. For example, for
 $\mathit{Bo}=8.3$
, if
 $d/D$
decreases from 0.66 to 0.5,
 $V_{s}/V$
increases from 0.02 to 0.2. On the other hand, for
 $d/D=0.5$
, if
 $\mathit{Bo}$
increases from 6.8 to 8.2,
 $V_{s}/V$
increases from 0.15 to 0.2. The largest satellite was measured for
 $\mathit{Bo}=9.4$
,
 $d/D=0.47$
(figure 9
b) where
 $V_{s}/V$
was 0.32.
3.4. Sharp-edged orifice
With sharp-edged orifices, the drop fluid contacts the leading orifice edge immediately upon impact. Then, two interface contact lines propagate along the neighbouring surfaces in order to approach their equilibrium contact angle. Compared to the round-edged cases, the subsequent drop motion is more complex and depends on the wettability of the orifice surface. In the following two sections, we discuss the flow outcomes for hydrophobic (HPB) and hydrophilic (HPL) surfaces respectively.
3.4.1. Hydrophobic surface
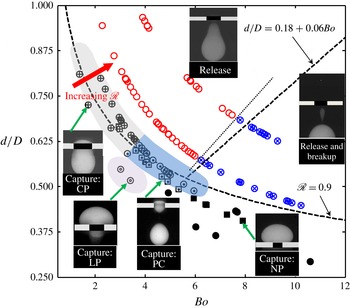
In figure 10, we plot
 $d/D$
with respect to
 $\mathit{Bo}$
for various test cases of drops impacting a sharp-edged HPB orifice (see table 2). A snapshot of final outcome is shown inside each regime.
Sharp-edged hydrophobic orifice. Regime map delineating capture: no penetration (NP,
 ${\it\lambda}=0.15$
: ●, 1.81: ▪), capture: limited penetration (LP,
 ${\it\lambda}=0.15$
:
 $\circledcirc$
), capture: complete penetration (CP,
 ${\it\lambda}=0.15$
:
 $\oplus$
, 1.81:
 $\boxplus$
), partial capture (PC,
 ${\it\lambda}=0.15$
:
 $\odot$
, 1.81:
 $\boxdot$
), release (
 ${\it\lambda}=0.15$
: ○), and release with breakup (
 ${\it\lambda}=0.15$
:
 $\otimes$
). A sample snapshot representing each outcome is shown. The two dashed lines (
 $\mathscr{R}=0.9$
and
 $d/D=0.18+0.06\mathit{Bo}$
) from figure 5 are included for reference.

The sharp-edged HPB case exhibited all three outcomes seen with round-edged orifices, namely capture, release, and release with breakup. In figure 10, the two dashed lines mark the boundaries between these regimes in the round-edged case (see also figure 5). For the sharp-edged HPB orifice, when
 $\mathit{Bo}<4$
, the capture boundary moved above
 $\mathscr{R}=0.9$
. Also, the boundary for breakup of released drops shifted to slightly lower
 $\mathit{Bo}$
and higher
 $d/D$
compared to the round-edged case (see the dotted line in figure 10).
Within the regime of capture for the sharp-edged HPB case, we distinguish four separate capture outcomes: no penetration (NP), limited penetration (LP), complete penetration (CP) and partial capture (PC). In the NP regime, the drop expands above the plate after impact and eventually settles there without penetrating the orifice. This regime is similar to the capture regime observed in the round-edged case. In the LP regime, a small fraction of the drop fluid penetrates through the orifice while most of the drop remains above the plate. In the CP regime, all of the drop fluid penetrates into the orifice, but the trailing interface remains pinned at the upper edge holding the fluid in place. In the PC regime, most of the drop fluid breaks away from the orifice while a sub-volume remains pinned and captured inside the orifice.
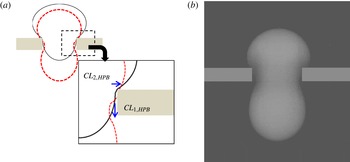
The wettability of the HPB plate is relatively weak such that the contact line motion along the upper surface is limited. Figure 11(a) shows a schematic of this motion after impact. The solid curve represents the drop at impact. The dashed curves represent a later time when the leading and trailing interface contact lines,
 $\mathit{CL}_{1,HPB}$
and
 $\mathit{CL}_{2,HPB}$
, move along the vertical and horizontal plate surfaces respectively. An image corresponding to the dashed boundary is shown in figure 11(b).
(a) Schematic of drop at time of impact (solid line) and subsequently (dashed line) in a sharp-edged hydrophobic orifice. (b) A snapshot showing location of contact lines.

If the gravitational potential is strong, the surface contact forces and contact line motions are inconsequential with respect to the overall drop motion. For
 $\mathit{Bo}>6$
, the boundary between capture and release coincides with that for the round-edged orifice (see figure 10). However, for
 $\mathit{Bo}<6$
the contact effects become important. After originating at the orifice edge, the leading contact line (
 $\mathit{CL}_{1,HPB}$
) moves downward along the vertical surface inside the orifice (see figure 11
a). This aids downward motion of the drop fluid, leading either to limited (capture: LP) or complete penetration (capture: CP and PC) for
 $\mathscr{R}<0.9$
(see the shaded regions in figure 10). For drops slightly above
 $\mathscr{R}=0.9$
, although the motion of
 $\mathit{CL}_{1,HPB}$
helps the leading interface penetrate through the orifice, the pinning of
 $\mathit{CL}_{2,HPB}$
hinders the motion of the trailing drop fluid. Due to weak wettability,
 $\mathit{CL}_{2,HPB}$
first spreads a short distance across the upper plate surface but then is pulled back until it becomes pinned at the orifice edge. For
 $\mathit{Bo}<3.5$
(within the shaded strip in figure 10), the drop fluid penetrates the orifice completely, yet eventually the drop weight is balanced by the pinning restriction at the orifice edge. As a result, the drop remains captured (see capture: CP regime in figure 10). As
 $\mathit{Bo}$
increases above 3.5, the drop fluid below the orifice accelerates due to gravity. This, combined with the pinning, leads to strong axial strain so that eventually a fraction of drop fluid breaks away (see PC regime in figure 10).
Figure 12 compares the vertical locations of the drop centroid (
 $h_{c}$
) and the leading (
 $h_{li}$
) and trailing (
 $h_{ti}$
) interfaces normalized by drop diameter (
 $D$
) for sharp and round-edged orifice cases with
 $\mathit{Bo}=3.03$
and
 $d/D=0.82$
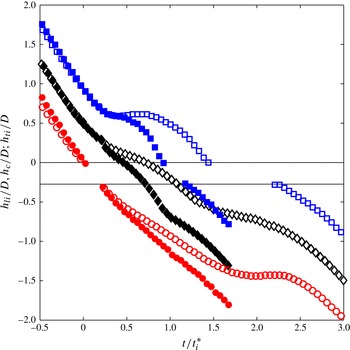
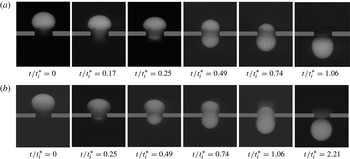
. Figure 13 shows the corresponding image sequences. The shapes and motions of both drops are the same until about
 $t=0.25t_{i}^{\ast }$
, after which the drop in the sharp-edged case is slowed. The trailing interface of this drop reaches the orifice at
 $1.5t_{i}^{\ast }$
compared to
 $1.0t_{i}^{\ast }$
for the round-edged case. It then remains pinned at the orifice edge until
 $2.0t_{i}^{\ast }$
(see figure 12). However, the weight of the drop overcomes the pinning restriction so that the drop is eventually released. The time of release is about double that for the round-edged case (see also figure 13).
Vertical location of drop leading interface (
 $h_{li}$
), trailing interface (
 $h_{ti}$
) and centroid (
 $h_{c}$
) normalized by drop diameter (
 $D$
) for
 $\mathit{Bo}=3.03$
,
 $d/D=0.82$
and
 ${\it\lambda}=0.15$
impacting the round-edged (
 $h_{li}$
: ●,
 $h_{ti}$
: ▪,
 $h_{c}$
: ♦) and sharp-edged (
 $h_{li}$
: ○,
 $h_{ti}$
: ▫,
 $h_{c}$
: ♢) hydrophobic orifice.

Time sequence of a drop with
 $\mathit{Bo}=3.03$
and
 $d/D=0.82$
impacting on the (a) round-edged and (b) sharp-edged HPB orifices.

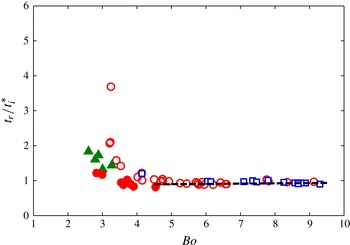
Figure 14 shows the variation of normalized release time (
 $t_{r}/t_{i}^{\ast }$
) for drops with
 $\mathit{Bo}=2{-}10$
impacting on sharp-edged hydrophobic orifices with
 $d=6$
and
 $8\ \text{mm}$
. The dashed line indicates the linear fit for the release time in the round-edged case for
 $\mathit{Bo}>4.5$
. For
 $\mathit{Bo}<4.5$
, data points from the round-edged case are included for comparison. The general trend for the sharp-edged case is similar. Above
 $\mathit{Bo}=4.5$
,
 $t_{r}/t_{i}^{\ast }$
appears constant irrespective of
 $\mathit{Bo}$
and the orifice size, and equal to the value in the round-edged case. This indicates that for sufficiently large
 $\mathit{Bo}$
, gravity still dominates the overall drop motion, and the effects of contact and pinning are minimal. However, for drops with
 $\mathit{Bo}<4.5$
, the release time in the sharp-edged orifice case is larger than for the equivalent round-edged case. The retarding effect of pinning becomes progressively more prominent as
 $\mathit{Bo}$
decreases below 4.5, so that the normalized release time increases at a sharper rate.
Variation of release time (
 $t_{r}$
) normalized by
 $t_{i}^{\ast }$
for drops with
 ${\it\lambda}=0.15$
and
 $\mathscr{R}>0.9$
impacting on a sharp-edged hydrophobic orifice with orifice diameter
 $d=6\ \text{mm}$
(○) and
 $8\ \text{mm}$
(▫). The data for the round-edged case with
 $\mathit{Bo}<5$
(
 $d=5\ \text{mm}$
: ▴,
 $d=6\ \text{mm}$
●) are included in the plot for reference. The dashed line indicates the linear fit in figure 6 for
 $\mathit{Bo}>4.5$
.

The mechanism of drop breakup during or after release is similar in the sharp- and round-edged cases. However, additional resistance at the upper orifice edge leads to increased axial strain causing the boundary for breakup to shift toward lower
 $\mathit{Bo}$
and larger
 $d/D$
(see figure 10). For the same reason, the fractional volume of the trailing satellite drop (
 $V_{s}/V$
) increases for matched
 $\mathit{Bo}$
,
 $d/D$
, and
 ${\it\lambda}$
in the sharp-edged case. This increase in
 $V_{s}/V$
decreases with increasing
 $\mathit{Bo}$
as the relative importance of the pinning effect diminishes. By
 $\mathit{Bo}=9$
(
 $d/D=0.47$
) (see figures 5 and 10),
 $V_{s}/V$
becomes equivalent for the sharp- and round-edged orifices.
3.4.2. Hydrophilic surface
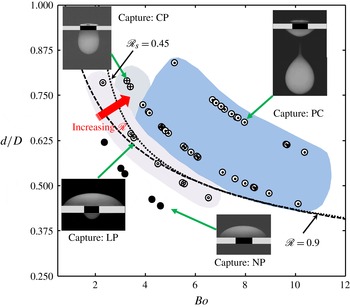
Figure 15 shows the regime map for the sharp-edged HPL case. The outcome regimes are labelled, and a snapshot of each outcome is shown. Due to strong wettability of the HPL surface with equilibrium contact angle 55°, a fraction of the drop fluid is always captured at the orifice surface. The HPL case includes all of the sub-regimes of capture observed in the HPB case. However, the boundaries between the sub-regimes shift. For the HPL surface, all drops with
 $\mathscr{R}<0.8$
are located in the capture: no penetration (NP) regime. The limited penetration (LP) and complete penetration (CP) regimes both shift to larger values of
 $\mathscr{R}$
. The partial capture (PC) regime also shifts to larger
 $\mathscr{R}$
and occupies a much larger portion of the parameter space.
Sharp-edged hydrophilic orifice. Regime map delineating four outcomes for drops with
 ${\it\lambda}=0.15$
(capture: no penetration (NP, ●), capture: limited penetration (LP,
 $\circledcirc$
), capture: complete penetration (CP,
 $\oplus$
) and partial capture (PC,
 $\odot$
)). A snapshot representing each outcome is shown.

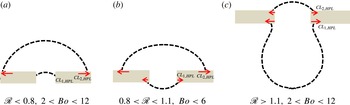
The drop outcomes in the HPL case are influenced strongly by the motion of the contact lines and their attraction to the solid surface. The schematics in figure 16 depict three wetting scenarios observed for drops with different
 $\mathit{Bo}$
and
 $\mathscr{R}$
. The drop interfaces are shown using dashed lines with the directions of motion of
 $\mathit{CL}_{1,HPL}$
and
 $\mathit{CL}_{2,HPL}$
indicated. For all drops within the NP regime, the motion of
 $\mathit{CL}_{2,HPL}$
is significant so that the drop fluid spreads outward along the upper plate surface (see figure 16
a). As the drop spreads above the plate, some fluid moves into the orifice along
 $\mathit{CL}_{1,HPL}$
. However, this downward motion is insufficient for the leading drop interface to penetrate completely through the orifice. (The motion of
 $\mathit{CL}_{1,HPL}$
within the orifice could not be observed directly due to visual obstruction by the plate.)
Schematic of a drop under three different wetting scenarios. The direction of motion of
 $\mathit{CL}_{1,HPL}$
and
 $\mathit{CL}_{2,HPL}$
is indicated with the arrows.

For drops in the LP regime, most of the drop fluid spreads above the plate similar to the NP cases. However, the drop fluid that moves into the orifice reaches and contacts the downstream orifice edge. The leading contact line
 $\mathit{CL}_{1,HPL}$
then propagates radially outward across the lower plate surface as shown in figure 16(b). Note that, in the sharp-edged HPB case, the drops with equivalent
 $\mathit{Bo}$
and
 $d/D$
completely penetrated the orifice. In the HPL case, on the other hand, due to the wide radial spread of drop fluid on the upper plate surface, the gravitational potential immediately above the orifice is reduced such that it cannot overcome the opposing contact force. Most of the drop fluid eventually rests and makes equilibrium contact above the plate. A fraction that penetrates the orifice and makes contact with the downstream orifice edge spreads radially across the lower plate surface due to the hydrophilic attraction (see figure 16
b).
If both
 $d/D$
and
 $\mathit{Bo}$
are sufficiently large, most of the drop penetrates the orifice during the initial expansion and retraction process, so that the propagation of
 $\mathit{CL}_{2,HPL}$
above the plate is reduced (see figure 16
c). After the downward moving
 $\mathit{CL}_{1,HPL}$
contacts the downstream orifice edge, it rounds the corner and advances radially outward across the lower plate surface due to hydrophilic attraction similar to the LP case. However, this outward motion is opposed by the presence of continuity and the downward pull of gravity on the drop fluid beneath the plate so that the radial spread of
 $\mathit{CL}_{1,HPL}$
is limited. Note that the contact angle on the lower surface is increased to approximately 68° compared with that of approximately 44° in figure 16(b) because of this gravitational effect. For
 $\mathit{Bo}<3.5$
and
 $d/D>0.75$
, the drop eventually attains a pendant shape where the weight of the drop is balanced by the hydrophilic attraction (see the capture: CP regime in figure 15). From this point, if
 $\mathit{Bo}$
is increased or
 $d/D$
is decreased, the relative increase in downward gravitational force compared with upward capillary force leads to a portion of the drop breaking off below the plate. After breakup, the remaining fraction is arrested inside the orifice as shown in the PC regime in figure 15. For drops with either CP and PC outcomes, flow of drop fluid through the orifice leads the contact line
 $\mathit{CL}_{2,HPL}$
to reach an equilibrium contact with the upper plate surface after receding, unlike the NP and LP cases where the line advances to an equilibrium. The static receding contact angle was measured as
 $46^{\circ }\pm 4^{\circ }$
. The lower angle compared to the advancing contact (see § 3.1) suggests a hysteresis of approximately 10° for the HPL surface.
The spreading of a contact line on the HPL surface depends strongly on the equilibrium contact angle (
 ${\it\theta}$
), its hysteresis, and the interfacial tension (
 ${\it\sigma}$
) between the drop and the surrounding liquid. The spreading rate is maximized immediately after the initial contact, and continues to decrease following a power law relation (see Bird, Mandre & Stone Reference Bird, Mandre and Stone2008; Courbin et al.
Reference Courbin, Bird, Reyssat and Stone2009) until the equilibrium contact angle is reached. A time scale related to this spreading can be written as
 $t_{s}=\sqrt{(({\it\rho}_{d}D^{3})/{\it\sigma})}$
. If we relate
 $t_{s}$
to the passage time scale
 $t_{i}^{\ast }$
for a drop impacting on the HPL orifice, we obtain
 $$\begin{eqnarray}\mathscr{R}_{s}=t_{s}/t_{i}^{\ast }=\sqrt{\mathit{We }_{i}(d/D)^{4}},\end{eqnarray}$$
where this ratio can be used to quantify the relative importance of spreading on the drop outcome. For the data in figure 15, we include a curve with
 $\mathscr{R}_{s}=0.45$
assuming
 ${\it\lambda}=0.15$
and using a best fit between
 $\mathit{Bo}$
and
 $\mathit{We}_{i}$
. This representative value separates the spreading-dominant NP and LP regimes from the penetration-dominant CP and PC. Given the data presented, values of
 $\mathscr{R}_{s}$
between 0.43 and 0.48 would also fit. Compared to the curve that separated capture and release in the round-edged data, the
 $\mathscr{R}_{s}$
isocurve rises more steeply for lower
 $\mathit{Bo}$
reflecting a weaker sensitivity to changes in
 $d/D\ (\mathit{We}_{i}\sim (D/d)^{2})$
than when
 $\mathscr{R}=0.9\ (\mathit{Bo}\sim (D/d)^{3})$
. In their experiments on silicone oil drops falling through air onto a hydrophilic orifice plate, Lorenceau & Quéré (Reference Lorenceau and Quéré2003) reported outcomes similar to the no penetration (NP) and partial capture (PC) regimes herein. For their examples with
 $\mathit{We}_{i}=52.5$
(NP) and 103 (PC), the corresponding
 $\mathscr{R}_{s}$
values are 0.36 and 0.67, suggesting a threshold or dividing value similar to that observed in the present case.
(a) Vertical location of drop leading interface (
 $h_{li}$
) and trailing interface (
 $h_{ti}$
) normalized by drop diameter (
 $D$
) for a drop with
 ${\it\lambda}=0.15$
,
 $\mathit{Bo}=4.6$
and
 $d/D=0.66$
impacting on a sharp-edged HPL (
 $h_{li}$
: ●,
 $h_{ti}$
: ▪) and HPB (
 $h_{li}$
: ○,
 $h_{ti}$
: ▫) orifice. Time is normalized by
 $t_{i}^{\ast }$
. (b) Snapshots of drop at four specific times for each case.

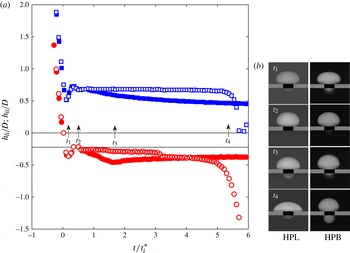
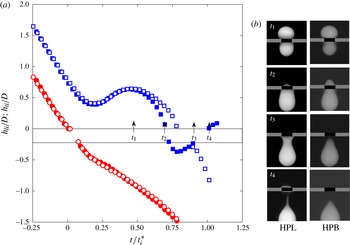
To compare the effects of hydrophilic and hydrophobic orifices, figures 17(a) and 18(a) present trajectories of leading and trailing drop interfaces (
 $h_{li}/D$
and
 $h_{ti}/D$
) and visualizations for two parameter combinations:
 $\mathit{Bo}=4.6$
,
 $d/D=0.66$
and
 $\mathit{Bo}=6$
,
 $d/D=0.58$
respectively. In figure 17, the outcome in the HPL case is capture: LP, while that in the HPB case is capture: PC. The downward motion of the drop immediately after impact is minimal for this combination of
 $\mathit{Bo}$
and
 $d/D$
, and the total time of drop fluid motion extends to approximately
 $6t_{i}^{\ast }$
. In both cases, the drop leading interface first penetrates through the orifice (snapshot at
 $t_{1}$
) and subsequently retracts back into it (snapshot at
 $t_{2}$
) due to surface tension. Beyond
 $t_{2}$
, however, the motion of the two drops differs. In the HPB case, the drop remains nearly stationary above the plate for an extended period of time until gravitational potential eventually drives the drop fluid through the orifice (snapshot at
 $t_{4}$
). By contrast, in the HPL case, as the drop spreads radially above the plate due to the motion of the trailing contact line (
 $\mathit{CL}_{HPL,2}$
), the trailing interface (
 $h_{ti}/D$
) moves downward. Once the leading contact line (
 $\mathit{CL}_{HPL,1}$
) reaches the downstream orifice edge, some drop fluid has emerged beneath the plate (snapshot
 $t_{3}$
). From
 $t_{3}$
onward, both contact lines continue to spread until the leading and trailing interfaces make equilibrium contact with the lower and upper plate surfaces respectively, and the drop becomes stationary (snapshot at
 $t_{4}$
).
(a) Vertical location of drop leading interface (
 $h_{li}$
) and trailing interface (
 $h_{ti}$
) normalized by drop diameter (
 $D$
) for a drop with
 ${\it\lambda}=0.15$
,
 $\mathit{Bo}=6$
and
 $d/D=0.58$
impacting on a sharp-edged HPL (
 $h_{li}$
: ●,
 $h_{ti}$
: ▪) and HPB (
 $h_{li}$
: ○,
 $h_{ti}$
: ▫) orifice. Time is normalized by
 $t_{i}^{\ast }$
. (b) Snapshots of drop at four specific times for each case.

In figure 18 where
 $\mathit{Bo}=6$
,
 $d/D=0.58$
, the outcome in the HPL case is capture: PC, while that for the HPB case is release. For drops with larger
 $\mathit{Bo}$
, the leading interface moves through the orifice at equal speed for both cases (see
 $h_{li}/D$
in figure 18). The drop motion above the plate is also similar through the initial radial expansion and retraction, until
 $h_{ti}$
reaches a local maximum (snapshots at
 $t_{1}$
). Then the leading contact line (
 $\mathit{CL}_{HPL,1}$
) spreads outward on the lower HPL plate surface such that the trailing drop fluid is pulled downward more quickly than that in the equivalent HPB case (snapshots at
 $t_{2}$
). Due to the strong impact inertia, most of the drop fluid penetrates through the orifice so that
 $\mathit{CL}_{HPL,2}$
spreads very little across the upper plate surface. With gravity pulling the drop downward and the attractions of the contact lines to the plate, the drop fluid is strained axially (snapshot at
 $t_{3}$
). The neck that develops underneath the orifice decreases continuously in size and eventually breaks; the leading drop fluid detaches from the plate, whereas the trailing fraction is arrested inside the orifice.
When a drop impacts on a larger sharp-edged HPL orifice with larger
 $\mathit{Bo}$
(i.e.
 $d/D>0.63$
and
 $\mathit{Bo}>5.2$
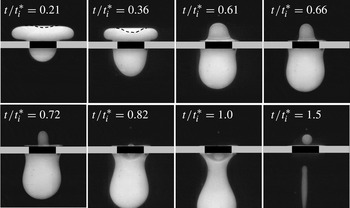
), a secondary pinch-off sometimes occurs above the plate. This pinch-off appears very similar to partial coalescence of a drop at a horizontal liquid/liquid interface (see Mohamed-Kassim & Longmire Reference Mohamed-Kassim and Longmire2004; Chen, Mandre & Feng Reference Chen, Mandre and Feng2006). Figure 19 shows a representative sequence with
 $\mathit{Bo}=7.2$
,
 $d/D=0.71$
. Due to strong inertia at impact, the trailing interface indents inward as the drop fluid expands then retracts above the plate (see dashed lines in figure 19 at
 $t=0.21{-}0.36t_{i}^{\ast }$
). As the lateral interface retracts, the trailing interface bounces back forming a column (
 $t=0.61t_{i}^{\ast }$
). Due to the relatively large orifice, inertia continues to carry most of the drop fluid downward. On the other hand, the HPL attraction keeps the trailing contact line on the upper plate surface (
 $t=0.61{-}0.72t_{i}^{\ast }$
). As a result, the radius of the liquid column decreases continuously, and an inflection forms at its base. The base continues to shrink until eventually a satellite pinches off and ejects upward (
 $t=0.82{-}1.5t_{i}^{\ast }$
). The pinch-off described takes place due to a combined effect of inertia and capillary forces acting on the drop fluid above the orifice. A similar phenomenon was reported by Ding & Theofanous (Reference Ding and Theofanous2012) in their numerical study for drops with negligible inertia (
 $\mathit{We}<1$
) impacting on an HPL capillary tube. Unlike the current observation, the formation of the liquid column above the orifice in their study was driven completely by outward moving contact lines, and inertia had no role in the pinch-off process.
Visualization images showing various stages leading to secondary pinch-off of a drop with
 ${\it\lambda}=0.15$
,
 $\mathit{Bo}=7.2$
and
 $d/D=0.71$
above the orifice during its partial release through a sharp-edged HPL orifice.

4. Conclusions
An important finding of this work is that, for liquid/liquid flows, the geometry of the orifice edge can significantly influence the motion of the drop through the orifice. When the edge was rounded, a thin film of surrounding oil always separated the drop fluid from the orifice surface, so that the surface wettability had no effect on the drop penetration. By contrast, when the edge was sharp, the drop fluid contacted the edge immediately upon impact. In this case, the orifice wettability could strongly influence the drop outcome.
For the round-edged orifice, the parameter
 $\mathscr{R}=\sqrt{\mathit{Bo }(d/D)^{3}}$
, derived based on the two dominant time scales (
 $t_{g}$
and
 $t_{{\it\sigma}}$
), separated the drop outcomes for
 $\mathit{Bo}=0.8{-}11$
and
 $d/D<0.8$
into two distinct regimes: capture and release. The critical
 $\mathscr{R}=0.9$
for drop capture is in reasonable agreement with a value of
 $\mathscr{R}=0.83$
for
 $d/D<0.7$
based on numerical results of Ratcliffe et al. (Reference Ratcliffe, Zinchenko and Davis2010) for drops moving through a ring constriction in a liquid/liquid system. This criterion was satisfied for drops with multiple viscosity ratios and Froude numbers up to 0.8. Thus, it held in a regime where inertia was significant but not dominant over gravity. For
 $d/D>0.8$
, both the present data and the simulations of Ratcliffe et al. (Reference Ratcliffe, Zinchenko and Davis2010) showed a drop off in the critical
 $\mathscr{R}$
value. As
 $d/D$
approaches 1, the drop requires only minimal deformation to pass through the orifice, so that the constant
 $\mathscr{R}$
scaling is no longer valid.
When the orifice edge was sharp, the drop outcome was influenced by two effects: contact line propagation along surfaces and contact line pinning at the upper orifice edge. The forward motion of leading contact lines in the hydrophobic case enhanced penetration of drop fluid compared to an equivalent round-edged case when
 $\mathscr{R}<0.9$
and
 $\mathit{Bo}<6$
. On the other hand, pinning of trailing contact lines at the orifice edge extended drop capture to
 $\mathscr{R}>0.9$
when
 $\mathit{Bo}<6$
. Based on the extent of drop penetration into the orifice, four sub-regimes of capture ranging from no penetration to complete penetration and break off of a sub-volume were identified.
For drops that penetrated and then released from the orifice, the time of release (
 $t_{r}$
) scaled with
 $t_{i}^{\ast }=D^{3}/U_{i}d^{2}$
for both round- and sharp-edged hydrophobic cases independent of
 ${\it\lambda}$
and
 $\mathit{Bo}$
when
 $\mathit{Bo}>4.5$
. For
 $\mathit{Bo}<4.5$
, both surface tension and drop viscosity affected the non-dimensional release time so that
 $t_{r}/t_{i}^{\ast }$
increased with decreasing
 $\mathit{Bo}$
and increasing
 ${\it\lambda}$
. In the sharp-edged case, pinning at the orifice edge added another resistance to the forward motion of the drop so that
 $t_{r}/t_{i}^{\ast }$
increased at a steeper rate.
When drops released, those with larger
 $\mathit{Bo}$
and smaller
 $d/D$
broke due to a capillary instability initiated near the orifice in both round- and sharp-edged hydrophobic cases. Within this breakup regime, the fractional volume of the trailing satellite grew as
 $d/D$
was decreased or
 $\mathit{Bo}$
was increased. The additional pinning resistance in the sharp-edged case shifted the breakup boundary to smaller
 $\mathit{Bo}$
and larger
 $d/D$
compared to the round-edged case. The pinning resistance also led to a larger fractional satellite volume in the sharp-edged case for matched
 $\mathit{Bo}$
and
 $d/D$
, until the pinning effect became negligible at
 $\mathit{Bo}=9$
and
 $d/D=0.47$
.
In the sharp-edged hydrophilic case, a fraction of the drop fluid was always captured at the orifice. This case exhibited the same sub-regimes of capture. However, the strong wettability and spreading of drop fluid along the upper plate surface hindered forward drop motion so that the sub-regime boundaries shifted to larger values of
 $\mathscr{R}$
. A criterion based on the ratio of a spreading time scale
 $t_{s}=\sqrt{({\it\rho}_{d}D^{3})/{\it\sigma}}$
and the inertially-driven passage time scale
 $t_{i}^{\ast }$
,
 $\mathscr{R}_{s}$
, was proposed to compare the relative importance of the two effects in determining the drop outcome, and an isocurve of this ratio was able to divide cases with limited penetration from those with complete penetration. When drops penetrated the orifice completely (
 $\mathscr{R}_{s}>0.45$
), some drop fluid spread across the lower plate surface resulting in partial or complete capture underneath the plate.
A critical factor influencing the drop outcome in the round-edged case was the relatively large time scale associated with the drainage of the surrounding liquid film compared to the drop passage time. This raises the question as to when the two time scales become of similar order. Based on the Stephan–Reynolds equation and an expression for final film thickness before contact (see Steinhaus, Spicer & Shen Reference Steinhaus, Spicer and Shen2006), the drainage time for a macroscopic drop resting on a flat surface increases as
 $D^{3.4}$
and linearly with the viscosity of the surrounding liquid. Our own experiments on drops of varying diameter falling through liquids of multiple viscosities onto a flat surface confirmed both of these scalings. If we assume that these scalings apply for drops impacting on the round-edged orifice, they imply that surface contact and wettability might begin to play a role if, for the current
 $D\sim 7.5\ \text{mm}$
and
 ${\it\sigma}$
, the surrounding fluid viscosity were decreased by a factor of 20. On the other hand, decreasing the drop diameter decreases Bond number, thus increasing drop passage time while simultaneously decreasing drainage time. Thus, for the current fluids, only relatively small decreases from current drop diameters, e.g. 7.5 mm down to 2 mm (with similar decreases in orifice size), might be required to initiate contact effects in flow through a round-edged orifice.
Acknowledgements
The authors gratefully acknowledge the Department of Energy (DE-EE0002764) for providing financial support for this investigation.