Social networks have long been recognized as central to how people speak. Some studies have identified powerful general network mechanisms in language change (e.g., Milroy and Milroy, Reference Milroy, Milroy and Trudgill1978), while others have focused on more community-specific dynamics (e.g., Gal, Reference Gal1978). A broad picture of how and why language is influenced by social networks thus tends to be complicated by the difficulty of comparing across studies and the tendency to select network measures relevant to the community in question.
The present study broadens the lens to better understand network dynamics. It contrasts three different aspects of social network structure—grounded in separate hypotheses—and explores their impact on three different levels of language variation: phonetic form, style range, and language choice. The data examined come from multiple generations of a British Asian community in the United Kingdom, and so additionally permit a consideration of how network effects behave over time in a community undergoing social change. The research design thus incorporates three dimensions:
-
• A network scale (3 levels of network information)
-
• A structural scale (3 levels of language structure)
-
• A temporal scale (3 degrees of community depth)
The study finds that some social network influences are very localized—influencing a particular speech feature for a particular subgroup at a particular historical phase of the community. This is especially true for qualities present within an individual's personal networks (e.g., proportion of a certain ethnicity in the network). By contrast, a structural network measure, which concerns the geometry of the network itself, is shown to exert a more stable, wide-ranging influence. Strength of ties have been argued in the literature to be one such general influence on language variation. In this community, another structural property of networks, the diversity of a person's network, is shown to correspond closely to how diverse their speech repertoire is, regardless of cross-cutting factors such as gender, age, or historical phase.
The article thus distinguishes between two ways in which social networks influence language: their role as the basic structure of our social worlds, potentially exerting more general influence in the data, and their role as a conduit for culturally and historically specific social qualities to affect language. This exploratory two-way typology may help to organize some of the multidimensionality of social networks, inform analysts’ choices of metrics, and “create a more unified social-network research methodology” in the study of language variation (de Bot & Stoessel, Reference de Bot and Stoessel2002:5).
The article first outlines a few concepts from social network theory, which are then used to structure a brief review of sociolinguistic network studies to date. The following section provides details of the community, the research design, and the various indexes used. The analysis that follows reveals temporal and structural scaling in network effects on language across generations in the community. The discussion focuses on why some network components exert more localized effects in the community than others do, with implications for wider network modeling in sociolinguistics.
PROPERTIES OF NETWORKS
The Milroys’ seminal study of Belfast (Milroy, Reference Milroy1987; Milroy & Milroy, Reference Milroy, Milroy and Trudgill1978) not only transformed sociolinguistics, it shifted a long-standing focus on strong network ties in the wider study of language change (“the limit of spread is sure to be along some line of weakness in the network of oral communication” [Bloomfield, Reference Bloomfield1933:328]). While affirming the conservative effect of strong ties, the Belfast study showcased a community in which the central role of weak ties in diffusion was apparent. Milroy (Reference Milroy1987) investigated many dimensions of social networks in the community, but the most influential has been the factor of strength of ties, as measured through density (how interlinked nodes are) and multiplexity (the number of social connections between two nodes). Many sociolinguistics textbooks still cite only these two measures, even though many studies since have employed other metrics, reviewed in the Network Measures in Sociolinguistics section.
In her closing comments, Milroy (Reference Milroy1987) observed that “a convincing case could be made … for using several different kinds of indicator,” noting that although social networks may have “a very general and possibly universal applicability … the indicators which may be said to reflect the underlying structure of personal relationships will vary in accordance with the investigator's perception of the most relevant and easily measurable categories” (216). Her comments highlight a tension between claims of general, even universal, network effects on language and their more community-specific embedding. This tension has impeded systematic comparison of network effects across studies, but it may be remedied with a more reflexive and comparative approach in methodology (how analytic choices affect outcomes) and in theory (why some network traits may have a more consistent effect on language than others).
The present study takes up these open questions: Should we use “several different kinds of indicator” to fully understand network dynamics in a speech community? How localized, general, or even universal, is the effect of such indicators on language use?
To begin to answer these questions, it is useful to step back from the historical focus on strength of ties, while in no way questioning its centrality in language variation, and instead begin with a broader picture of the many loci in a network we could in principle study. One important contrast is whether we choose to examine personal networks or whole networks (sometimes termed ego network analysis and total network analysis; Degenne & Forsé [Reference Degenne and Forsé1999:13]; Wetherell [Reference Wetherell1998:127]).
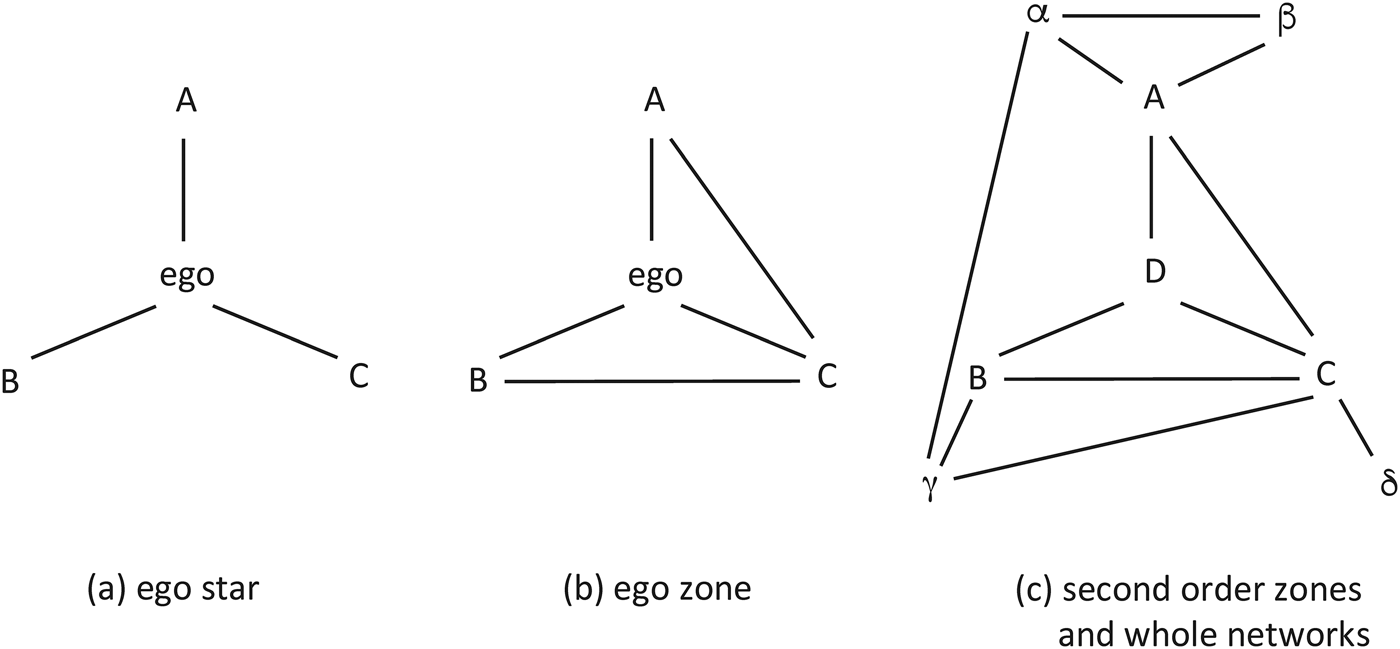
Figure 1 illustrates these levels of network information we might use. An ego star (Figure 1a) represents a set of relations between a given actor (ego) and others (alters). In ego star data, only properties of individual stars, or personal networks, can be studied, such as the multiplexity of each ego-alter dyad, the proportion of a given qualitative trait in each star (e.g., ethnicity, class, sexuality), or the total number of alters in each star. This provides some network information per individual while still permitting stratified sampling, as participants need not be linked in a single network. For these reasons, ego star data are common in sociolinguistic research.
Stars, zones, and networks (modified from Degenne & Forsé, Reference Degenne and Forsé1999:26).

Figure 1b describes a closely related type of information, namely, the ego zone. This expands the information known about an ego to include facts about alter-alter ties, but still excludes details about how this cluster is positioned in the wider network. In sociolinguistics, as reviewed next, studies that extend to this level have tended to focus on density (the number of mutual ties among alters of a given ego). The present study introduces and examines a different ego zone measure, network diversity.
Finally, we can add in the zones of alters, as in Figure 1c, to create second-order ego zones (cf. Milroy, Reference Milroy1987:46–47), moving toward increasingly complex sociograms and ultimately whole networks. Whole networks permit an examination of more complex structural components such as clusters, chains, cohesion, centrality, structural holes, and other formations. These are potentially very powerful for understanding language variation but, for reasons noted in the next section, current sociolinguistic methods are somewhat limited in their ability to conduct whole network analysis.
In addition to these levels of network data, there exists a contrast in the type of information we might choose to examine. As social networks represent the structural arrangement of people as well as the interactions transacted between them, we can distinguish between structural and content (or quality) components at any level. Structural components represent the actual geometry or arrangement of ties, such as density. Content components involve the qualities present within these ties, for instance relating to interaction, such as multiplexity, reciprocity, and transactions (Bergs, Reference Bergs2005; Milardo, Reference Milardo and Milardo1988), or to attributes, such as ethnicity of individuals, the focus of this study. Using ego star and ego zone data, the present study explores the possibility that network structures and network qualities influence language variation in different ways.
NETWORK MEASURES IN SOCIOLINGUISTICS
If we view the history of social network analysis in sociolinguistics through Figure 1, we see that some studies have examined whole networks and structural components, but more have explored ego network data and content or quality components. I offer a brief review here to motivate the comparative approach taken in the present study.
True whole network analysis ideally compares multiple whole networks. For reasons of feasibility and sampling, this is rare in sociolinguistics. In Milroy (Reference Milroy1987), multiplexity and density of neighbourhood networks were inferred from etically derived indexes for clustered individuals in different local communities. Other early studies used detailed sociograms of single networks and so could similarly examine various structural network components. Thus, in their well-known analyses of vernacular language, Labov (Reference Labov1972) used details of network location of gang members, Eckert (Reference Eckert2000) used details of centrality and asymmetry of jocks and burnouts, and Cheshire (Reference Cheshire1982) used adolescents’ core and peripheral engagement in social networks. Community of Practice studies have tended to retain this interest in structural network positions (e.g., Moore, Reference Moore2006). Some studies have found creative solutions to the challenge of gathering whole network data, using computational modeling (Fagyal, Swarup, Escobar, Gasser, & Lakkaraju, Reference Fagyal, Swarup, Escobar, Gasser and Lakkaraju2010), Internet Relay Chat data (Paolillo, Reference Paolillo1999), and historical records (Bergs, Reference Bergs2005; Deumert, Reference Deumert2004), with the last of these also encouraging sensitivity to biographical or political specifics in network coding (see also Lippi-Green [Reference Lippi-Green1989], Matsumoto [Reference Matsumoto2010], and Smith [Reference Smith2002] on the importance of an ethnographic understanding of network clusters). Dodsworth and Benton (Reference Dodsworth and Benton2017) have recently offered a major advance in whole network analysis in sociolinguistics, devising sociologically sophisticated and replicable new measures for large-scale analysis of the effect of structural components such as cohesion.
Ego network analysis is more common in sociolinguistics for several reasons. Whole network analysis can require a comparison of several whole networks, which is often unfeasible given the demands of sociolinguistic data collection. Ego network data are also more compatible with stratified sampling of participants, often needed for other reasons in variationist research. At the level of analysis too, ego network metrics can be easier to integrate alongside other social factors in multivariate statistics. Many early studies therefore used ego star information gleaned from individual self-reports, for example Gal's (Reference Gal1978) measure of peasantness of individual networks, Dubois and Horvath's (Reference Dubois and Horvath1998) measure of openness of individual networks, and Bortoni-Ricardo's (Reference Bortoni-Ricardo1985) individual integration and urbanization network indexes, finely tuned to the situation of rural migrants in a Brazilian city.
Ethnicity, the main focus of the present study, is a particularly well-researched ego star quality (e.g., Cheshire, Fox, Kerswill, & Torgersen, Reference Cheshire, Fox, Kerswill and Torgersen2008; Hoffman & Walker, Reference Hoffman and Walker2010; Li Wei, 1994; Matsumoto, Reference Matsumoto2010; Meyerhoff & Schleef, Reference Meyerhoff and Schleef2012; Newman, Reference Newman2010; Sharma & Sankaran, Reference Sharma and Sankaran2011; Stoessel, Reference Stoessel2002; Wassink, Reference Wassink2016; Wong, Reference Wong2010, among others). A common focus in the study of ethnicity is the proportion of a given ethnicity in each person's network, particularly in relation to their own ethnicity (ethnic homophily; see Wassink, Reference Wassink2016). It has also been common to establish values for these indexes by eliciting a fixed number of reported ties (e.g., Bortoni-Ricardo, Reference Bortoni-Ricardo1985; Lanza & Svendsen, Reference Lanza and Svendsen2007; Li Wei, 1994; Matsumoto, Reference Matsumoto2010); in a few cases (e.g., Wassink, Reference Wassink2016; Wong, Reference Wong2010), participants could determine the number of ties they reported.
Some of these common methodological choices—a focus on the ethnic composition of individual networks, eliciting a fixed number of ties, a focus on density—are critically evaluated in the present study through a comparison of theoretically motivated alternatives. The comparison of metrics is organized around the distinction mentioned earlier: network qualities and network structures.
Network qualities: Correlations between the ethnicity of an individual's network and their language use tend to be interpreted as acts of ethnic identification. But we know that people are also sensitive to the speech of their interlocutors. In principle, then, it could be the presence of a particular language or accent type in their network, not simply a certain ethnicity, that is the driving factor in such cases (see Hulsen, de Bot and Weltens [Reference Hulsen, de Bot and Weltens2002] and Stoessel [Reference Stoessel2002] for use of this alternative). In some cases, analysts may even be using ethnicity as a proxy for interlocutor speech. It is therefore useful to disentangle these two components, to establish whether they represent distinct social processes. The present study compares the effect on language of these two network qualities: ethnic composition of an ego star and accent/language composition of an ego star.
Network structures: Another common practice worthy of critical reflection is the elicitation of a fixed number of named ties, for example, five closest friends or 10 active ties. While this helps to normalize data for comparison, it can obscure other structural information. If a person's network is large, important ties or groupings may be left out, and if small, unimportant ties may be included. In the present data, ethnographic observation quickly revealed markedly different sizes of personal networks, with very different subgroupings or social worlds in people's daily lives. The study therefore examines the diversity of ego zone subgroupings as an additional factor. This new structural measure differs from density, multiplexity, and openness measures in ways clarified in the Data and Methods section. The analysis compares the effect of this structural metric to those of the two quality metrics.
The study thus aims not to critique previous approaches but to expand and organize the tools we use for network analysis, encouraging a more comparative and reflexive approach.
DATA AND METHODS
Community and participants
The data for this study were collected in Southall, a suburban district in the West London borough of Ealing and the historic heart of the British Punjabi community. The area has attracted South Asians (the largest ethnic minority in the UK) since shortly after World War II, when postwar labor shortages led to policies encouraging migration from former British colonies. The Asian population in the UK grew substantially until 1971, after which a series of immigration acts began to limit numbers, though migration has continued to the present day. Today the South Asian population of Southall is well over 70% and the overall ethnic minority population exceeds 85%. The South Asian population includes Asia-born first-generation (Gen 1) and British-born second- and third-generation (Gen 2 and Gen 3) residents. Members of the Gen 1 group were born in South Asia and migrated to the UK in adulthood; this group is continually renewed through ongoing migration. Due to their continuous arrival, the Gen 2 group has a very diverse age range. Older Gen 2 people, the first to be born in Britain, are now in their 50s, even 60s. Children of more recent migrants are younger, but also technically Gen 2.
Significant changes in race relations over the last half century have meant very different lived experiences for these older and younger Gen 2 individuals. Between the 1950s and the 1970s, the proportion of South Asians in Southall grew to 30%—still a minority but a large and highly visible one that became the target of severe racial tension (CARF, 1981:43; Oates, Reference Oates2002:107). Racially motivated violence was commonplace in schools and on the streets and was formative for older Gen 2 participants, all of whom repeatedly alluded to them in their interviews. Racial tensions were markedly reduced from the 1990s onward, accompanying a shift in demographics such that the Commonwealth heritage population became the majority group (Meads, Reference Meads1983; Oates, Reference Oates2002:107). Southall schools became very multiracial, with the proportion of minority ethnic origin students in Ealing schools now ranging from 40% to 99% (Ealing JSNA, 2010:18). Younger Gen 2 residents grew up in a climate in which wider British society accepted an increasingly visible, legitimated, even celebrated British Asian culture (Herbert, Reference Herbert2009), and they rarely volunteer narratives of racial tension. These social conditions have led to strikingly different accents and repertoires across generations, examined here in relation to network factors.
Fieldwork was conducted over 9 months by two fieldworkers, the author and another fieldworker who both spoke a similar variety of educated Indian English. Data of three broad types were collected: sociolinguistic interviews, social background questionnaires (on network, language use, and cultural practices), and self-recordings. The first two data types were collected from a stratified sample (including some small family network clusters of 4–5 relatives) of 75 individuals, mostly through two recorded sessions each. The third type, self-recordings, were collected from a subset of 10 participants. Collecting self-recorded speech repertoires is challenging and it would have been entirely unfeasible to collect a large sample. To permit a degree of generalization, the fieldworkers aimed to collect self-recordings from two participants per major demographic group (e.g., older Gen 2 men). Participants were given Zoom H2 recorders with Sony lavalier microphones for 2 weeks and instructed to record themselves for at least 30 minutes in several different speaking contexts, ideally with different types of interlocutors, focusing in particular on such contrasts as home/work contexts and Asian/non-Asian interlocutors. The repertoires provided varied considerably in terms of number and contexts of recording, and so comparison is kept as simple and transparent as possible in what follows, supported where possible with ethnographic field observation.
The present study relies on interview recordings and questionnaire details from 42 of the 75 participants for whom data were fully processed (18 gender-balanced Gen 1 participants; 24 gender-balanced Gen 2 participants), and self-recorded repertoires from nine individuals.Footnote 1 In both generation groups, participants can be further divided into older (age 35–55) and younger (age 18–34). For Gen 2, this division corresponds to whether individuals grew up during the earlier or later historical phase and is included as a generational distinction in the analysis.
Research design
The study looks at the influence of three different dimensions of personal network information on language use. These are ethnicity of friendship network (i.e., South Asianness), nationality of friendship network (i.e., Indianness, which for the present data is a direct index of Indian English accent and bilingual dominance in Indian languages), and network diversity (i.e., groupings of alters in the ego zone). The first two measures contrast two network qualities discussed earlier. Is it the ethnicity of alters that influences an ego, or more narrowly the specifics of those alters’ speech? The third measure is a new structural network metric designed to target a fundamental facet of people's lives, namely how many different social worlds they participate in.
Just as analyzing only one dimension of social networks may miss the larger picture, analyzing just one linguistic form may do the same. So, the analysis considers the impact of social networks on three distinct levels of language variation: use of Asian postalveolar /t/ (micro level), English accent repertoire across contexts (meso level), and active use of Punjabi (macro level).
Finally, these network and language variables are examined across three generational groups in the community. Table 1 summarizes the multiple dimensions of analysis, each described in detail next.
Network measures, language practices, and social groups to be studied

Three measures of network structure
Milroy (Reference Milroy1987:141) acknowledged the methodological challenge of obtaining complete personal network information, noting that “[social network] formulae require a quantitative statement of the size of a total personal network which very few researchers are in a position to provide.” In the present study, an estimate of the size, structure, and selected qualities of individual ego zones were targeted during data collection. Participants were not limited to a specific number of ties, but rather asked to describe the main groups of people they interacted with on a regular basis, providing further details of each alter, including ethnicity, background, accent, frequency of interaction, domains of interaction, shared ties, and a relative closeness ranking.
The first network measure—ethnic Asianness of network—is the proportion of ethnically South Asian close nonkin ties reported by each individual. Family members are excluded, as family often constitutes a large proportion of individuals’ networks in this community and so considerably inflates levels of network Asianness. Kin ties do not reflect voluntary sociality as directly as friendships do and so excluding these permits a focus on ties developed and maintained more out of personal choice (Li, 1994:121).
The second network measure—Indianness of network—is the proportion of nonkin ties who were born and raised in India, including alters who are either adult migrants to the UK from India or who live in India. Both by implication speak an Indian variety of English and, in the present data, speak Punjabi as their first language. This index is a subset of the previous index, as it taps more narrowly into the accent, dominant language, and nationality of Asian alters. Especially for Gen 2 it indirectly reflects the degree to which active transnational ties are cultivated and maintained.Footnote 2
The third network measure is a new metric in sociolinguistics: diversity of network. This measure was briefly introduced in Sharma (Reference Sharma2011) and is evaluated more fully here in comparison to the two other measures.
As noted, fieldwork revealed sometimes dramatic differences in the size and diversity of individuals’ social worlds within and outside the community. An initial analysis used a simple measure of network strength (percentage of weak ties), but this showed no significant effect on any language variables for any subgroups in the community. This appeared to be because the measure only offers an aggregated indication of tie strength, with no indication of how many separate worlds or communities of practice those ties are based in. For example, Anwar, a man who operates across many different social worlds in his daily life, had 56.8% weak ties, whereas another man, Satpal, has a more limited social world composed of a couple of work colleagues and immediate family, but his proportion of weak ties is similar (57.1%).
The Diversity Index allows us to retain more of this detail. Whereas density can offer a global indication of actual ties across nodes in an ego zone, diversity indicates the separate clustering of those ties. Diversity indexes have been used widely in other disciplines to measure how diverse the grouping of individuals in a system is, for example, species diversity in biology (Simpson, Reference Simpson1949) and demographic heterogeneity in sociology (Blau, Reference Blau1977). For example, a given country may have two primary religions with 90% and 10% of adherents, respectively, in the population; this would give rise to a lower diversity index than a country with two primary religions distributed evenly in the population, which in turn would have a lower diversity index than a country with four primary religions distributed evenly in the population.
In the present work, I adapt this so that the overall system in question is the social network of an individual, and the subgroupings (religions or species in the preceding examples) are distinct domains of regular interaction. In their social network questionnaire session, each participant listed all of their primary alters in relation to self-described subgroups, for example, family, old school friends, office colleagues, acquaintances at a volunteer site, college friends. The Diversity Index reflects how diverse the distribution of ties in the network is across different groups—that is, how many different social worlds a person's network is composed of and how balanced they are in terms of relative size.
 $$\hbox{Diversity Index:} \; D = 1 - \sum\limits_{i = 1}^n p_i^2 $$
In formula (1), p i is the probability that, within a single individual's network, any given alter belongs to any given subgroup i (e.g., work colleagues, close family), and n is the total number of subgroups (Blau, Reference Blau1977; Degenne & Forsé, Reference Degenne and Forsé1999:195). The more subgroups in a network, and the more even the distribution of individuals across them, the higher the index value. A higher value (closer to 1) indicates a higher level of diversity, in other words, a lower probability, or predictability, of an alter being in any particular subgroup. By contrast, a lower value (in the direction of 0) indicates lower levels of diversity, deriving from either a limited number of subgroups in that person's network or alters being more heavily bunched in just one or two subgroups, for example a person whose main interactions are with their immediate family. Subgroups were treated as distinct if they had no more than one overlapping member. In this use of the Diversity Index, values below .5 are very unlikely because even individuals with relatively small networks will have at least of two or three separate subgroups.
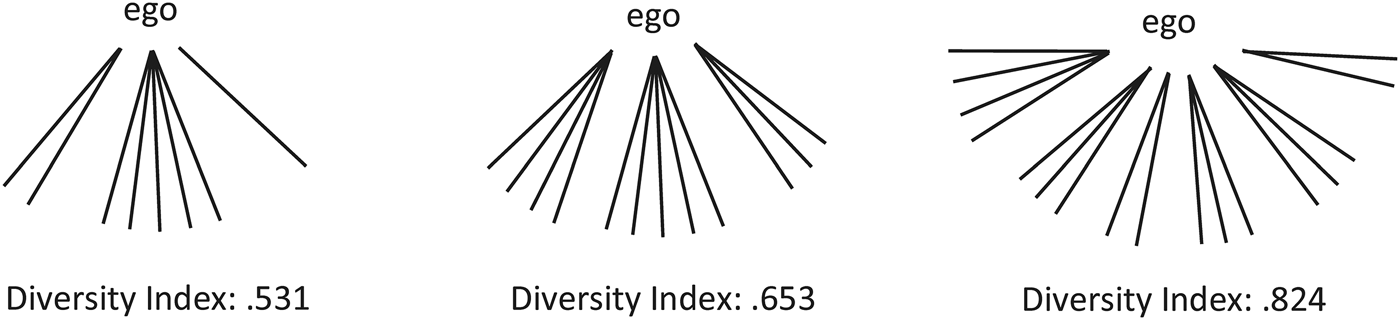
Figure 2 shows three such hypothetical networks to illustrate how differences in individuals’ social worlds may correspond to higher or lower Diversity Indexes. The second sample network in Figure 2 illustrates an individual who might report regular interaction with just three groups: (a) close family, (b) college friends, and (c) a set of work colleagues, with membership sizes of 4, 5, and 3, respectively. According to (1), p is the probability that an individual is in a given group, so p(a) = 4/12, p(b) = 5/12, and p(c) = 3/12. The sum of the squared probabilities is subtracted from 1. The Diversity Index for this person is therefore .653. The two other sample networks show how different distributions account for different Diversity Index values.
Sample Diversity Index measures.

The index thus incorporates some density information, as subgroupings represent alter-alter ties. It also incorporates some multiplexity information as highly overlapping groups count as single subgroups. However, crucially, it keeps track of the number and relative size of subgroups, adding details of the diversity of social worlds in a person's daily life. As with all network measures, it only attends to selective information and so is not a comprehensive measure. A qualitative detail that could be incorporated in future work, for example, is the status of alters or subgroups as in-group or out-group, that is, a dimension of network openness (cf. Dubois & Horvath, Reference Dubois and Horvath1998). Finally, as with many other measures, the new metric relies on complex coding that, however objectively pursued, includes an element of subjective judgment, a critique that Dodsworth and Benton (Reference Dodsworth and Benton2017) have raised for most structural network measures in sociolinguistics.
Three measures of language use
The study examines more than one level of language variation to better understand the reach of different network traits within language use. The three aspects of language use examined are postalveolar /t/, accent repertoire, and Punjabi use, representing phonetic choice, style choice, and language choice. Prior analyses of this community (Sharma, Reference Sharma2011; Sharma & Sankaran, Reference Sharma and Sankaran2011) have examined some aspects of these features individually. In the present study, they are assessed together in relation to the different network factors outlined.
Postalveolar articulation of /t/, a feature that derives from retroflex consonants in Indic languages, is now a widely recognized feature of British Asian English (Alam, Reference Alam2007; Alam & Stuart-Smith, Reference Alam, Stuart-Smith, Hundt and Sharma2014; Heselwood & McChrystal, Reference Heselwood and McChrystal2000; Kirkham, Reference Kirkham, Lee and Zee2011; Lambert, Alam, & Stuart-Smith, Reference Lambert, Alam, Stuart-Smith, Trouvain and Barry2007; Sharma & Sankaran, Reference Sharma and Sankaran2011). A total of 9350 tokens from interview recordings were subjected to auditory analysis and all variants heard with a realization outside the range of standard British alveolar /t/ (i.e., retroflex as well as retracted forms) were coded as postalveolar. Three noncluster positions were coded (syllable-initial, word-medial, and word-final), but they are grouped here.Footnote 3
Accent repertoire, based on the nine sets of self-recordings, is a composite picture of an individual's overall style variation across settings, as seen in their use of four variables— postalveolar /t/, monophthongal /e/, monophthongal /o/, and light coda /l/. The South Asian variants coded for these are [ʈ], [e], [o], [l], in contrast to the British variants [t]/[ʔ], [eɪ], [əʊ], [ł]. These were coded auditorily across as many contexts as were recorded by the individual. At the start of the analysis, repertoires are reduced to a single accent range numerical value to allow an initial comparison to other factors. This is calculated for each individual by first establishing their mean rate of use of each of the four variables per situation, then deriving an overall mean per setting using those four percentage values (due to uneven denominators), and finally subtracting the lowest from the highest derived mean value. Later in the analysis, this extrapolated value is critiqued as somewhat too reductive and accent repertoires are explored in fuller detail.
The third language feature is use of Punjabi in an individual's daily life. Information was collected on bilingual language use from all participants using a 15-category scale of interlocutor type. The scale was determined through general ethnographic identification of locally relevant categories, for example grandparents, potential for distinct language practices with each parent, and interactions with “aunties,” in the Asian sense of relatives as well as acquaintances of the parents’ generation. (Contact in commercial settings such as shops was too dependent on the location, type, and ethnic composition to be reliably reported.) These types of observations led to the 15 categories being based around interlocutor and speech task (Gal, Reference Gal1978) rather than simply domains of interaction (Blom & Gumperz, Reference Blom, Gumperz, Gumperz and Hymes1972). The categories used were: grandparents, grandparents’ generation, aunties, mother, father, siblings, spouse, early life (home language before age 5), friends, children, work, counting, writing, university, grandchildren. For each category, individuals were asked to estimate their proportion of Punjabi use as a percentage, and a continuous index (0%–100%) was derived based on the average of responses of all filled cells. Self-reports risk over- or under-reporting, and this was mitigated through careful clarification with participants, ethnographic observation of participants over 9 months, and verification against 38 self-recordings from participants. Nevertheless, the index is best thought of as a relative index, to compare Punjabi use across individuals, rather than an absolute measure of exact time spent using Punjabi in daily life.
RESULTS
As the analysis comprises a number of subanalyses, this section starts with an overview of the data followed by individual results for each of the three network traits. These are then pulled together for a wider discussion in the section that follows.
General overview
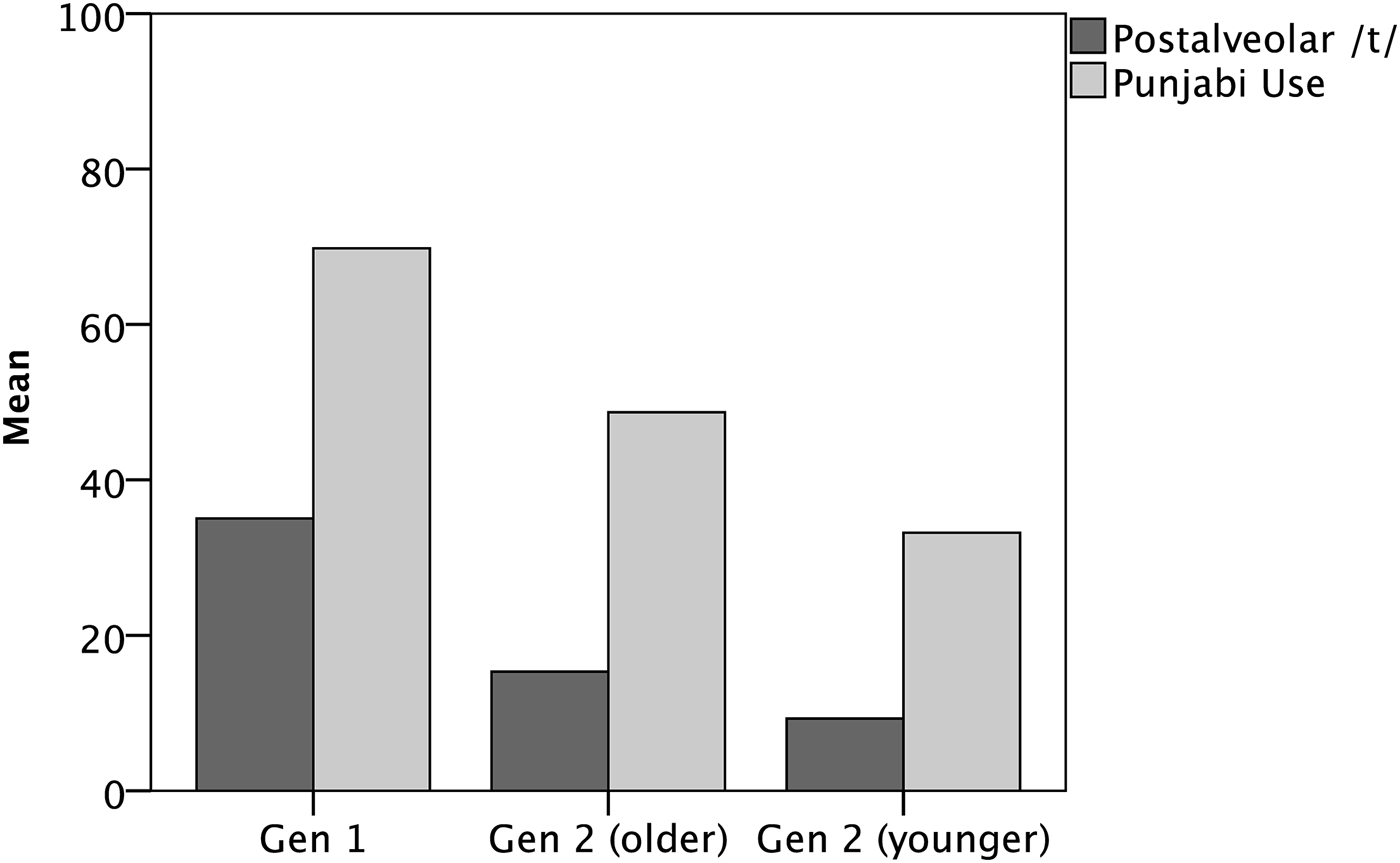
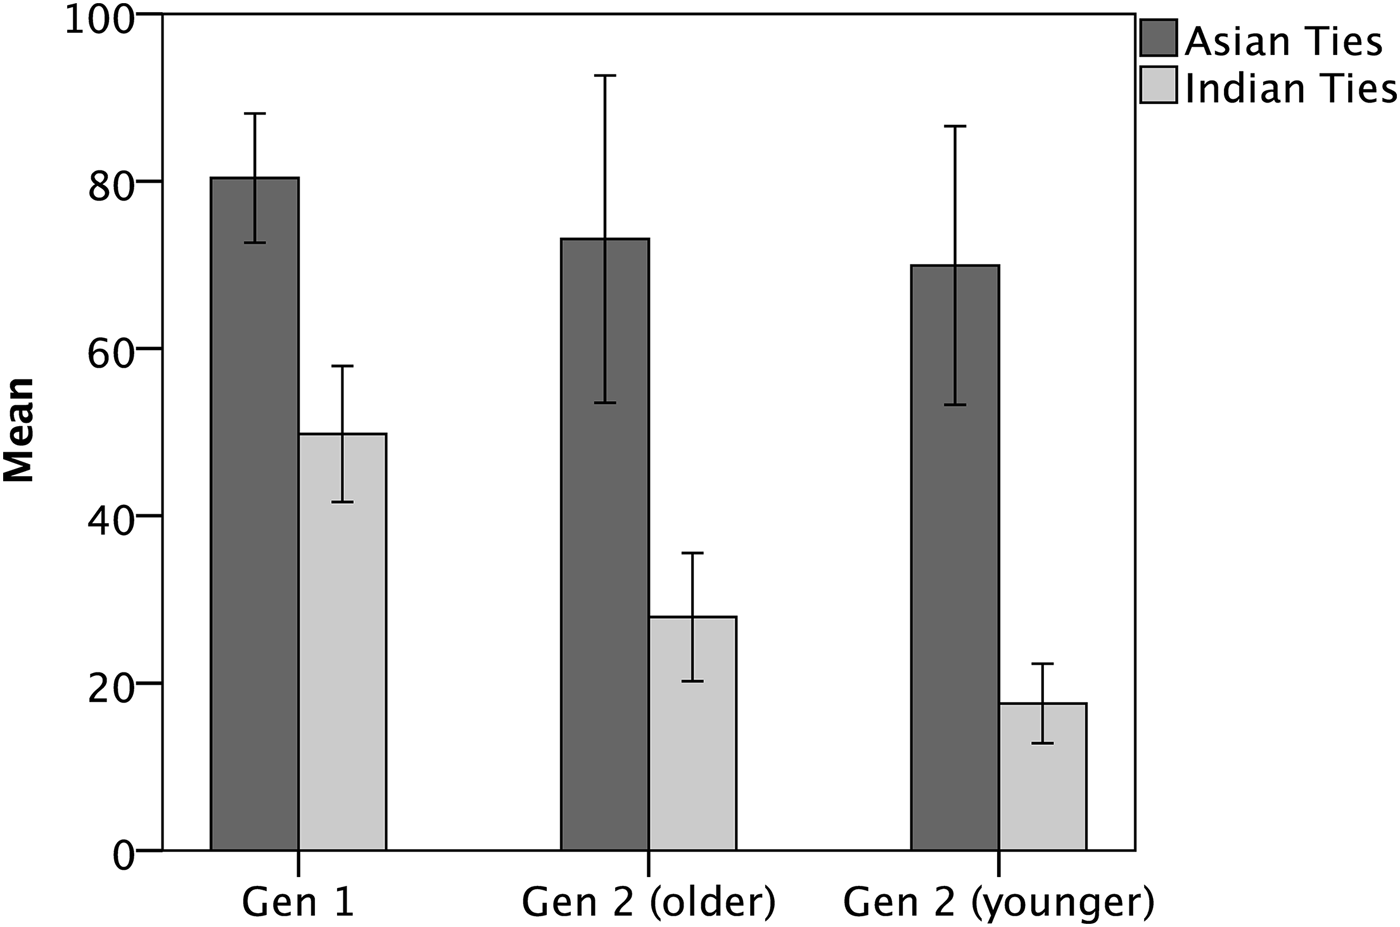
The raw data across all 42 participants provides an initial picture of networks and language practices in this community. Figures 3 and 4 provide descriptive statistics for two language practices and two social network measures, respectively. Accent repertoire and network diversity are examined in most detail in relation to each other, for just the nine individuals for whom repertoires exist, so these two traits are omitted from these initial figures.
Language practices (use of postalveolar /t/; use of Punjabi) across generations.

Network properties (Asianness; Indianness of nonkin ties) across generations.

Figure 3 shows a predictable decline in the use of both postalveolar /t/ and Punjabi in the community, but there is no sharp drop-off in their use between the first and second generations, as is often seen in heritage language communities. The Southall community is well known in London and even in India for its distinctively Asian style of British English and for its maintenance of Punjabi, making it a useful case for testing the interplay of language and network over a longer period of time.
Figure 4 shows a contrast that is also typical of this community, namely a maintenance of ethnically Asian networks over time, but an increasing proportion of British Asians within these ties over time, that is, diminishing transnational ties to India. Again, this makes the Southall community particularly well suited for teasing apart the effect of pure ethnicity as opposed to the nationality or accent of alters.Footnote 4
We can now start to explore relationships between social networks and language practices.
The quantitative analyses presented in this article rely almost entirely on nonparametric correlation coefficients. Aside from an initial parametric analysis of a normally distributed subsample of all the data, the remaining analyses separate the data into social subsets, for example by gender and age, and these smaller samples are characterized by mixed normality, presence of 1 to 2 outliers, and uncertain causal directionality, all of which favor use of Spearman's rank correlation coefficient. Multivariate analysis is unfeasible as two of the language traits only include one measure per individual, and one of these is only reported for nine individuals. The later discussion returns to the challenge of ascribing causality in such data.
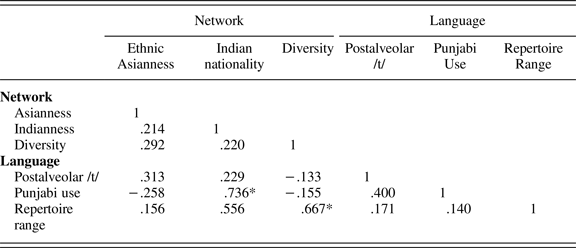
Table 2 reports a simple correlation matrix across all three network and all three language features, to check for initial patterns in the data.Footnote 5 Table 2 only includes the nine individuals for whom accent range information is available, as these are the only individuals for whom all six measures exist. This small subsample indicates a correspondence between network diversity and repertoire range and also between Indianness of network and Punjabi use. It indicates a lack of correlation in other areas.
Pearson correlation matrix across three network and three language variables

Note: *p ≤ .05 level (two-tailed).
In the analysis that follows, the two network qualities, ethnic Asianness and Indian nationality, are examined in relation to the full set of 42 speakers, and the final, structural network trait is examined specifically in relation to the nine individual repertoires. These analyses confirm the two initial correlations in Table 2 and identify further patterns in the data, particularly intersections of network with gender, age, and community (generational) time depth.
Network trait 1: Ethnic Asianness of network
Across all three demographic groups, how Asian (simple ethnic composition) a person's friendship network is showed no significant correlation with their use of Punjabi, so these results are not reported on further.
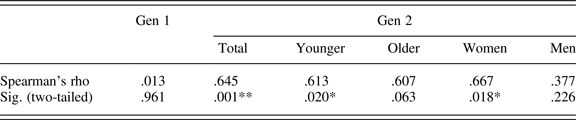
By contrast, Table 3 shows that how Asian a person's network is does correlate with their degree of use of postalveolar /t/ for some groups. The correlation is significant overall for Gen 2, but not for Gen 1. This is likely due to high network Asianness and high postalveolar /t/ use across the board in Gen 1. Within Gen 2, the breakdown by age and by gender in Table 3 reveals this correlation to be located in younger individuals and in women, two separate main effects (interactions were not statistically significant). This does not mean that women use postalveolar /t/ more: in fact, they use it much less than do young men in the community (Sharma, Reference Sharma2011). What Table 3 shows is that women's use of this feature is more sensitive to whether or not they have a very Asian network. By contrast, Gen 2 men have a higher and more consistent use of the form across different age groups, and this usage is not as sensitive to how Asian their network is. Most importantly, this network effect appears late in terms of community history, arising only for women and for the most recent subgroup (younger Gen 2). This finding is discussed later in relation to particular new social indexicalities that have developed in the community.
Spearman's correlation coefficients for Asianness of network and postalveolar /t/ use

Note: *p ≤ .05. **p ≤ .01.
Network trait 2: Indianness of network
Across all three demographic groups, how Indian (born and raised in India) a person's friendship network is showed no significant correlation with their use of postalveolar /t/, so these results are not reported on further.
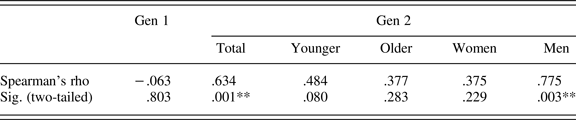
In contrast to the previous network trait, it is Punjabi use that this network measure correlates with. Table 4 shows that this correlation was again significant overall for Gen 2, but not Gen 1. Once again, this is likely due to, in this case, high network Indianness and high Punjabi use across the board in Gen 1. Within Gen 2, the breakdown according to age and gender in Table 4 shows that it is primarily Gen 2 men for whom a correlation between Indianness of network and Punjabi use is significant. Again, this does not mean that men use more Punjabi; there is no statistically significant gender difference in Punjabi use in the data. Table 4 shows that men's use of Punjabi is influenced by how Indian (transnational) their networks are. Unlike the influence of network on postalveolar /t/, here we see little evidence of change over time (age-sensitivity) within this British-born Gen 2 group. I offer an account for this difference in the Discussion section.
Spearman correlation coefficients for Indianness of network and Punjabi use

Note: *p ≤ .05. **p ≤ .01.
Network trait 3: Diversity of network
The initial correlation matrix in Table 2 pointed to a relationship between the third network trait—diversity of network—and the third language feature—accent repertoire. These two are examined together in detail next. The focus here moves from the full set of 42 individuals to the 9 for whom accent repertoire data are available.
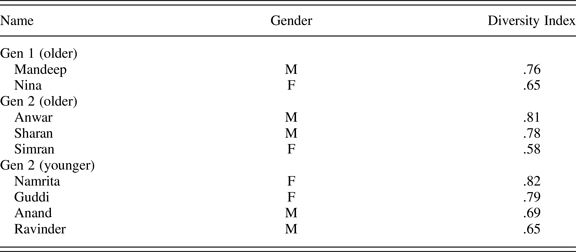
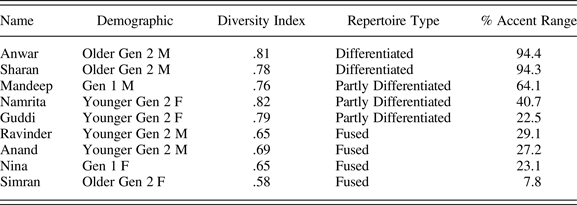
Table 5 first reports the Diversity Index values and biographical details for these nine individuals, grouped by generation and gender. Network diversity ranges from 28 named individuals across eight subgroups (Anwar) to 10 named individuals across four subgroups (Simran). Recall that the nature of human social networks is such that Diversity Index values under .5 are unlikely to be attested. The present analysis focuses on these nine individuals, as these are the nine with accent repertoire data as well, but the trends reported are mirrored across the wider dataset.Footnote 6 Further support for reported patterns comes from ethnographic observation of the community, noted in the analysis.
Diversity Index values and demographics for nine repertoire cases

Table 5 shows that the Gen 1 and older Gen 2 groups conform to one gender pattern, whereas the younger Gen 2 group reverses that pattern. I describe this gender reversal in some detail here, as it is central to understanding how these network diversity measures relate to the accent repertoires presented shortly.
At the top of Table 5, we see that the Gen 1 man's network is more diverse than that of the Gen 1 woman. The social arrangement of gender roles in the India-born group is typical of many traditional communities, such that the women's lives are somewhat more community-internal and family-based than the men's lives are. This is the basis of the indicative Gen 1 gender difference in Table 5.
What is very striking in Table 5 is that this arrangement continues within the older Gen 2 group, the first age group born locally in Britain. Again, independent social observation of the community supports this. Many older Gen 2 men took over their father's businesses, interacting widely with Indian as well as British business contacts and often becoming political activists during a time of political tension around immigration. By contrast, despite being born in Britain and having local jobs, older Gen 2 women still tended to follow more traditional Asian practices of getting married younger than the men did, completing their education early, and remaining more family- and community-bound.
It is only by the younger Gen 2 group that the community sees a shift to typical Western urban lower-middle-class gender roles. Ethnographic observation, questionnaire responses, and comments by participants in interviews (see Sharma, Reference Sharma2011; Sharma & Sankaran, Reference Sharma and Sankaran2011) indicated clearly that in this more recent British-born generation, it is younger women who stay in education longer, find employment outside the community, and interface more widely across communities, while younger men tend to be more neighborhood-bound (cf. similar gendered class patterns in Gal [Reference Gal1978], Milroy [Reference Milroy1987], and Nichols [Reference Nichols, Dubois and Crouch1976]). The Diversity Indexes for all four of the younger Gen 2 individuals indicate this systematic reversal of gender roles.
This slow transformation of gender roles, and corresponding networks, is very systematic in Table 5. Even though, like any network metric, the Diversity Index only attends to a few components (the number and relative size of an ego's social worlds) and omits many other details, these structural components may be one significant source of systematic social difference in some communities.
Chambers (Reference Chambers1995:125–126) predicted a correspondence of such structural network properties to language use: “in societies where gender roles are sharply differentiated such that one gender has wider social contacts and greater geographical range, the speech of the less circumscribed gender will include more variants of the contiguous social groups.”
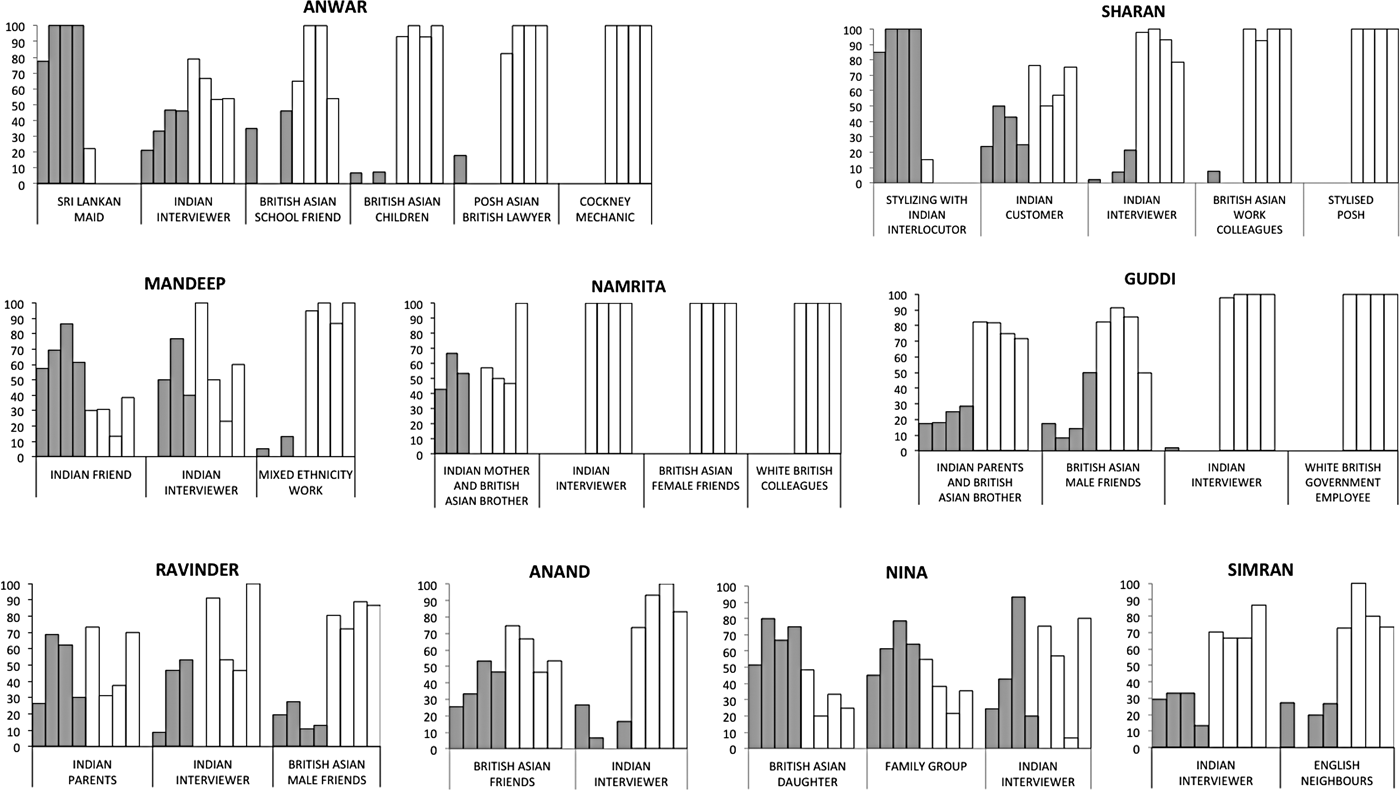
So how closely does network diversity correspond to accent repertoire? The accent repertoires for these nine individuals are presented in a compact format in Figure 5. As noted earlier, the repertoires track alternation in the use of four salient variables: the gray bars indicate percentage use of Asian variants [ʈ], [e], [o], [l], while the white bars indicate percentage use of British variants [t]/[ʔ], [eɪ], [əʊ], [ł].Footnote 7 These types of accent repertoire aim to profile individuals’ variation at a higher level than individual variants in sociolinguistic interviews. As noted, participants were encouraged to record themselves in a range of settings, preferably with contrasts across home/work contexts and Asian/non-Asian interlocutors. Inevitably, data collected varies across individuals and is not straightforwardly comparable or representative. One way that generalizability is addressed in part is the inclusion of two individuals per demographic subgroup where possible.
Accent repertoires for nine individuals. Gray bars, in order: Asian variants [ʈ], [e], [o], [l]. White bars, in order: British variants [t], [eɪ], [əʊ], [ł].

The bar charts in Figure 5 show that, despite considerable variability in individual repertoires, it is possible to identify three broad types: (a) repertoires that involve wholesale alternation between complete or pure lects (top row: Anwar, Sharan), (b) repertoires that involve alternation between one pure lect and hybrid mixing (middle row: particularly Namrita and Guddi), and (c) repertoires that involve much slighter shifts in levels of variants, a mix of which is always present across contexts (bottom row: Ravinder, Anand, Nina, Simran).
These groupings correspond very closely to higher Diversity Index scores (top and middle rows) and lower Diversity Index scores (bottom row), respectively. Table 6 sets out details of this significant correlation. However, it also highlights some limitations of pure quantification at this level.
Diversity Index values and repertoire details

Note: r = .667, p ≤ .05.
The accent range measure that was used earlier for the initial correlation matrix in Table 2 is included in Table 6 as one way of converting the repertoires in Figure 5 to numerical values for quantitative analysis. Recall that this value represents the maximum observable difference in the combined mean rate of use of four Indian variants across contexts. Actively bilectal individuals such as Anwar and Sharan show rates that approach 100% because they alternate between whole dialect systems, listed in Table 6 as differentiated. Conversely, an individual with a very limited style range such as Simran has a very low accent range value, and her repertoire is described in Table 6 as fused, indicating the tendency for phonetic variants to recur to some extent across all contexts. The intermediate group, listed as partly differentiated, are individuals whose repertoire does not exhibit fully bilectal alternation between Indian English and British English, as in the differentiated repertoires, but who do alternate between one such pure lect (e.g., British English) and a mixed style. In other words, their hybrid style is circumscribed to a subset of contexts.
It is this intermediate group that illustrates why boiling a full repertoire down to a single numerical value is problematic. Guddi has a relatively low accent range measure, lower than that of her two male peers, but in fact she, and many young British Asian women like her, are notable for their practice of completely turning off their hybrid Asian lect, as we saw in Figure 5. Younger women's complete elimination of Asian features from their speech in some contexts makes their range much more salient in interaction than that of their younger male peers such as Anand and Ravinder. The latter never “switch off” their Asian style, giving the impression of much less variability despite technically similar ranges. A calculation that attends only to pure ranges, not to qualitative differences in which particular mix of features results, misses this difference in repertoire quality. This qualitative distinction is therefore retained in Table 6 in the column indicating repertoire type.
Despite these challenges to pure quantification, a strong correspondence can be observed: regardless of generation, gender, and age—which are all implicated in a deep social transformation in the community—an individual's accent repertoire appears to be closely linked to their network diversity.
DISCUSSION
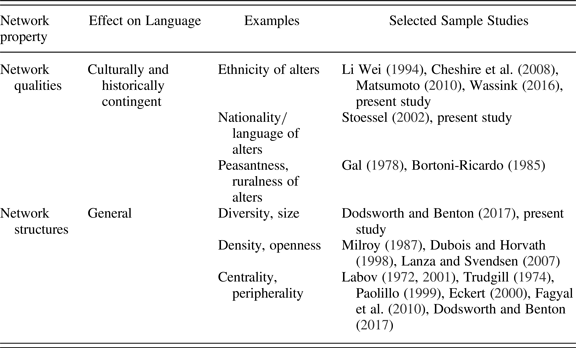
Figure 6 pulls together the three main network dynamics observed. The effects range from more localized in terms of timescale and affected groups to more general. The first effect—a correlation of ethnicity of network ties with English /t/ pronunciation—arose in the youngest Gen 2 group, with the additional detail that women are more subject to this influence than men are. The second effect—a correlation of Indianness of ties and Punjabi use—is slightly more general in the community: it applies across the British-born Gen 2 group, particularly men. The final effect—the correlation between diversity of one's network and accent repertoire—although not easy to subject to statistical analysis given the qualitative complexity of the data, points to a level of generality that transcends other sociodemographic specifics.
Network effects across scales of time, language structure, and network structure.

Networks thus influence language use at different scales, some effects appearing to be more consistent and others more historically contingent. Why do these scalar differences arise? How should they be interpreted, and what generalizations, if any, can be made?
Correlation, causation, and explanation
The analysis has been careful to discuss the findings in terms of correlation, which cannot be assumed to imply causation, particularly in the case of network effects. A few plausible alternatives are worth noting before the results are interpreted.
A broad challenge to simple causation is potential endogeneity (lack of true independence of predictor variables) in the data. Taking the second result in Figure 6 as an example, we might wish to interpret the maintenance of transnational ties as an independent factor that causes rates of Punjabi use among British Asians to vary. However, two possible types of endogeneity in the data could complicate such a claim. First, causality can be bidirectional, leading to a feedback loop such that maintenance of ties supports Punjabi use, and enhanced Punjabi ability fosters such ties further. Second, variation in one or both variables (Punjabi use and transnational networks) may be driven by a separate confounding variable such as cultural attitude or family history.
This second complication—that network traits may be proxies for less directly observed forces—is particularly important for careful interpretation of results in sociolinguistics more generally. We can take the third result in Figure 6 as another example. Network diversity correlates with accent repertoire diversity, but is network diversity itself the explanatory variable? In principle, it is possible that the driving force for diverse repertoires is not simply network diversity, but the presence of at least one significantly non-Asian social world for an individual, that is, a combination of network diversity and network openness. It is indeed the case that speakers with higher diversity index values in Table 6 also have networks that tend to incorporate more non-Asian groups. Disentangling finely covarying network properties remains a methodological challenge for future work.
Bearing these caveats in mind, we can begin to interpret each of the findings in Figure 6. First, a single account may underlie why postalveolar /t/ correlates with ethnicity of network, and why this effect is greater among younger Gen 2 and women. Postalveolar /t/ has undergone phonetic and socioindexical changes over time in this community, developing into one of the main markers of British Asian speech for younger people. The form has gained the status of a stereotype, with participants volunteering it as an example of “Southallian” style. The younger generation distinguish themselves from recent Gen 1 arrivals, sometimes derogatorily termed “freshies,” by using postalveolar /t/ with an altered phonetic profile (Alam & Stuart-Smith, Reference Alam, Stuart-Smith, Hundt and Sharma2014; Kirkham, Reference Kirkham, Lee and Zee2011; Sharma & Sankaran, Reference Sharma and Sankaran2011) and integrated with British vernacular phonetic forms. Embeddedness in the British Asian community (as indicated by network Asianness) is negotiated more critically and actively by younger women in the community: Men expressed more uniformly positive stances toward traditional Punjabi culture, whereas young women talked about negotiating the greater social restrictions placed on girls and showed higher rates of work and socializing outside the community (Sharma, Reference Sharma2011). This may account for the gendered and generational specificity of how network Asianness corresponds to a marker of cultural localness, postalveolar /t/.
The second finding is simpler, namely that across Gen 2, Punjabi use is related to maintenance of transnational ties. This is not surprising given that, in the present data, alters raised in India tend to be Punjabi-dominant. The greater effect for men may be due to the fact that men's transnational activity shows a wide range, depending on whether they go into their father's business, which in this community is often tied to South Asia. It is interesting to note, in passing, a difference to Gal's (Reference Gal1978) findings for Hungarian-German bilinguals in Oberwart. In her study, language choice corresponded to network type for the older generation, but younger women actively moved away from Hungarian, regardless of their network. In the present data, the network effect on Punjabi use does not change over time in Gen 2; indeed, there is no statistically significant gender difference in Punjabi use in general in the data. The fact that we do not see women rejecting the community language could point to a degree of vitality of the heritage language, or to less starkly gendered labor conditions, which were argued to be the underlying basis for change in Oberwart. Subtle difference in network dynamics across studies can thus reveal different drivers of language shift.
Finally, the third finding: why do network diversity and accent repertoire correlate closely across demographic subgroups, as was seen in Table 6? At a simple level, it may simply be that accent repertoire reflects the accretion of short- and long-term accommodation, and a diverse network is bound to be instrumental in this outcome. If so, this is an effect that operates at a more fundamental level than the other two more community-specific processes. The final discussion turns to this question of scales of network influence.
The particular and the general
A multiscale typology of how social networks influence language can facilitate more direct comparison across communities. Why are some network effects very similar across communities and others not? Under what conditions would the more particular or the more general effects found for the present community be expected to arise in other communities?
First, the particular: Indianness of network was argued to be unrelated to postalveolar /t/ because that form has come to signal a local British Asianness, hence the sensitivity among younger British Asians not to transnational ties but to the local British Asian community (community embeddedness). On the one hand, we might say that this was predictable, due to outer limits on how long transnational ties can exert a direct influence. Incremental shifts from parent to peer norms after migration with accompanying focusing of new usage, have been observed in many contexts of migration (Kerswill & Williams, Reference Kerswill and Williams2000; Trudgill, Reference Trudgill2004). So, a shift in influence from transnational network components to locally salient network components (e.g., ethnicity, vernacular culture) is intuitive, particularly in relation to language forms that are known to be becoming markers of the local, such as postalveolar /t/. However, the timescale of such a shift is less predictable. In some communities, the strength of ideology or sustained cultural practices could support lasting translocal influence. Benor (Reference Benor2010) showed that Jewishness of network and frequency of synagogue attendance correlate with Jewish Americans’ use of loanwords from Hebrew and Yiddish; one can easily imagine a stable influence of transnational network ties in such a scenario, not gradually weakening as has happened in the community under consideration here. In a more general confirmation of the idea that qualities such as ethnicity need not exert predictable effects, Wassink (Reference Wassink2016) showed that ethnic homophily does not uniformly predict greater use of ethnolectal forms across five ethnic groups in Washington state. The influence of certain network qualities on language variation at a given time depends on the community's particular historical and cultural trajectory.
Does the influence of network diversity on repertoire represent a more basic dynamic, one that we can more reliably expect to see in any context? The correspondence of network diversity to repertoire did transcend subgroupings in the data, as did other structural components such as density, openness, and strength of ties in earlier studies. So, returning to the original distinction drawn in relation to Figure 1 between qualitative and structural components of networks, we can conclude that, in the present study, the two qualitative ego star measures showed more time- and group-specific effects, whereas the structural ego zone measure showed a more general effect. Why is this the case?
At any given point in its history, a community represents a temporary configuration of social norms, involving heightened cultural salience or influence of specific ways of being, for example, a particular type of ethnic identity, a style of signaling a particular femininity, an oppositional working-class stance, a homeland identity. These qualitative attributes may have particular power over diffusion of certain linguistic forms at that point in time. Which social attributes are involved, how powerful they are, and which linguistic forms do their work, is culturally and historically contingent. This is represented by the examples in the first row in Table 7.
Exploratory typology of network effects on language

By contrast, certain structural properties of networks may be less likely to be subject to culturally or historically specific valuation. It would be unusual for a culture to converge on a culturally specific norm such that dense networks do not have a stabilizing effect, but open networks do. Likewise, it would be surprising for a culture to develop a social norm of associating a diverse network with a narrow repertoire and a limited network with a broad repertoire. Core structural dimensions of networks, unlike qualitative attributes of networks, may be more impervious to cultural norms, predicting more comparable kinds of influences on language across communities. This is indicated by the examples in the second row in Table 7.
Community-specific variation may nevertheless arise here too. For instance, a community that is steeped in a conflict model of class or race relations (see Rickford, Reference Rickford1986) may place heightened value on strong ties and closed networks. Similarly, repertoire sensitivity to network diversity may be higher for speakers of nonprestige varieties. Speakers of a less prestigious new British Asian variety may expand their repertoires to accommodate a range of social worlds, but speakers of a standard variety might do much less to accommodate to others across contexts. The correlation of diversity and repertoire thus may represent a relatively more consistent effect, but the extent of its applicability across communities and classes requires further research.
CONCLUSION
Comparing a small set of network metrics has shown that very different pictures of the same data emerge depending on which network dimension and which linguistic form are selected, with network effects operating at different scales. Qualitative network attributes showed patterns specific to subgroups and accounted for by the historical phase of social change in the community. By contrast, the structural ego zone attribute exerted a more general effect that transcended subgroups and appeared to be more fundamental to social interaction. Both types can give us insight into deeper historical and cultural processes.
Multiscale analysis encourages a more comparative and reflexive methodology, with critical reflection on common measures and practices in the field. The present study has shown the potential for identifying new dimensions of network structure—in this case, diversity of social worlds—that may have special relevance to understanding dynamic language repertoires. In sociology, studies of social networks span micro, meso, and macro scales of analysis. The finding of scalar dynamics here may support a similar sociolinguistic theory of network dynamics, with effects ranging from local and historically contingent to more general and fundamental to interaction.