


Introduction
Aside from geographical coordinates, the most important attributes in a glacier inventory are probably area and altitude. The volume of a glacier can be estimated from its area Reference Chen and Ohmura(Chen and Ohmura, 1990) and this expresses its weighting within the cryosphere, while altitude gives its location within the cryosphere. For a glacier, the most characteristic altitude is the equilibrium-line altitude (ELA), because it divides the glacier into ablation and accumulation areas (Reference Armstrong, Roberts and SwithinbankArmstrong and others, 1973). If the glacier has no accumulation area for an extended period, i.e. because the ELA has risen above the glacier, the glacier is doomed to disappear sooner or later Reference Pelto(Pelto, 2006).
The ELA is best determined as part of a programme of mass-balance measurements on a glacier. The specific mass balance should be measured at many points on the glacier surface so that reasonably reliable isolines of zero mass balance may be drawn, which can be done manually or with the help of a computer (Reference Haeberli and MüllerYoung, 1981; Reference Hock and JensenHock and Jensen, 1999). The concept of ELA is only meaningful if the specific balance is a more or less definite function of altitude so that the isoline of zero balance is roughly parallel to altitude contour lines on the glacier. Mass-balance measurements have been made on relatively few glaciers (e.g. on 300–400 glaciers for at least 1 year). The longest continuing series of ELA and mass-balance measurements is from Storglaciären, northern Sweden, which started in 1945/46 Reference Haeberli(Schytt, 1962) and continues today (Reference Jansson and PetterssonJansson and Pettersson, 2007).
All known ELA series show great variability from year to year, with differences of several hundred metres between maximum and minimum ELA values corresponding to balance years with highly negative or positive mass balances respectively. For the later decades of the 20th century (e.g. 1961–90 when glacier mass balance was measured on scores of glaciers), average mass balances were not highly negative (Reference BraithwaiteBraithwaite, 2009) and corresponding ELAs were only a few tens of metres higher than those needed to maintain glaciers in equilibrium. However, in many (or most?) areas there is now a trend towards much higher ELAs, so we need to qualify more carefully the concept of ELA in our discussions. For example, several authors have stated that accumulation or winter balance at the ELA is approximately equal to the whole-glacier average of the same (Reference AhlmannAhlmann, 1948; Reference Hoinkes and RudolphHoinkes and Rudolph, 1962;Reference LiestølLiestøl, 1967; Reference SchyttTrabant and March, 1999). This statement would still be true for the balanced-budget ELA, i.e. ELA corresponding to zero mass balance for a particular glacier Reference Meier(Meier, 1962), but not necessarily for a particular year when ELA might even be above the glacier.
A glacier inventory is supposed to describe the state of glaciers within a region for a period of time (e.g. several decades), so it would be wrong to include ELA values for only a single year unless that year can be shown to be somehow ‘representative’. As this is generally difficult to do, Reference Braithwaite and MüllerBraithwaite and Müller (1980) suggested that the best parameterization of the ELA for glacier inventory purposes is an estimate of balanced-budget ELA. Reference Braithwaite and MüllerBraithwaite and Müller (1980) explored this idea at the first workshop on World Glacier Inventory (WGI) and we now update the discussion for conditions in the early 21st century with an improved dataset. We discuss (1) estimation of balanced-budget ELA from mass-balance data, (2) estimation of balanced-budget ELA from topographic parameters available in a glacier inventory, and (3) results from (1) and (2). Estimates from (1) are ‘direct’ estimates, based on the definition of balanced-budget ELA in terms of mass-balance field data, while (2) refers to ‘indirect’ estimates. This approach is valuable because we have direct estimates from mass-balance data for only ~102 glaciers, while indirect estimates are potentially available for ~105 glaciers.
Previous Work
The concept of a line on the glacier surface, the firn line, where accumulation of snow is precisely counterbalanced by snowmelt is an old one, and estimation of its altitude was already discussed in the 19th century Reference Haeberli and Hoelzle(Zeller, 1893). The most important methods involved altitude–area measurements using planimeters and topographic maps, which were then state-of-the-art research tools. Although developed on the basis of meagre observational material, some of the methods are still of interest, as the firn line, as then defined, is closely related to the equilibrium line on alpine glaciers Reference Hoinkes(Hoinkes, 1970). The firn line was believed to divide the glacier into distinct accumulation and ablation zones whose areas lie in a definite ratio to each other. These 19th-century works were pioneers of our modern concept of accumulation-area ratio (AAR) (Reference Meier and PostMeier, 1962; Reference AnonymousAnonymous, 1969). Ratios of 8 : 9 (0.89) and 3 : 4 (0.75) were suggested by Reference MüllerRichter (1885) and Reference BrücknerBrückner (1886) respectively. These agree roughly with the ratio 2 : 3 (or 0.67) suggested by Reference Gross, Kerschner and PatzeltGross and others (1977) for Alpine glaciers.
With due allowance for modern terminology, Reference KurowskiKurowski (1891) suggested that the firn-line altitude (≈ELA) is approximately equal to the arithmetic mean altitude of the glacier when (1) the glacier is in balance and (2) mass balance is a linear function of altitude. Reference LiestølLiestøl (1967) and Reference SchyttSissons (1974) independently develop approaches that are very similar to Reference KurowskiKurowski (1891). Some authors misquote Kurowski’s definition of mean altitude (Reference KotlyakovKotlyakov, 1980; Reference Kotlyakov and KrenkeKotlyakov and Krenke, 1982; Reference MeierdingMeierding, 1982; Reference Cogley and McIntyreCogley and McIntyre, 2003; Reference Carrivick and BrewerCarrivick and Brewer, 2004). However, for a glacier with a symmetrical area–altitude distribution, mean altitude (correctly defined) is approximately equal to median altitude, i.e. the altitude dividing the glacier area (map area) into two equal areas, and a number of authors (e.g. Reference MeierMeier and Post, 1962) have suggested a balanced-budget AAR = 0.5. This may be why UNESCO/IASH (1970) and Reference Müller, Caflisch and MüllerMüller and others (1977) recommended inclusion of median glacier altitude in the WGI although, to add to the fun, they incorrectly referred to it as ‘mean’ altitude (Reference Braithwaite and MüllerBraithwaite and Müller, 1980). Whatever their former usage, our use of mean altitude as the area-weighted mean altitude, and median altitude as the altitude dividing the glacier area into equal halves, should be preferred because they agree with standard statistical definitions of mean and median Reference Everitt(Everitt, 2006) if we recognize the analogy between the altitude–area distribution of a glacier and the probability distribution function of any random variable.
The second condition of Reference KurowskiKurowski (1891), referring to a constant balance gradient with altitude, is seldom true, and lower balance gradients in the accumulation area will probably increase the balanced-budget AAR Reference Liestøl(Liestøl, 1967), and Reference Gross, Kerschner and PatzeltGross and others (1977) do suggest a larger AAR for Alpine glaciers. Reference Braithwaite and MüllerBraithwaite and Müller (1980) analysed ELA data that were then available for 33 glaciers and suggested that AAR = 0.67 best describes balanced-budget ELA on Arctic glaciers (3 cases), on Alpine glaciers (8 glaciers) and on glaciers in central Asia (2 cases), while AAR = 0.5 describes balanced-budget ELA in western North America (9 cases) and Scandinavia (10 cases). On the other hand, in areas of extremely high relief like the Andes or Himalaya, the balanced-budget AAR might actually be <0.5 due to avalanche-accumulation or topographic ‘concentration’ of precipitation (Reference MüllerMüller, 1980). A recent study of balanced-budget AAR data from 86 glaciers Reference Dyurgerov, Meier and Bahr(Dyurgerov and others, 2009) gave values between 0.4 and 0.8, and an average of 0.58.
Since 1991, summary data for mass balance have been published in the 2 yearly Glacier Mass Balance Bulletin series available on the internet (http://www.wgms.ch/gmbb.html). These summary data routinely include estimates of balanced-budget ELA and AAR, based on correlating ELA with mass balance, and values are now available for many glaciers. Although no reference to the literature is given in the Glacier Mass Balance Bulletin, we like to think that these routine compilations of balanced-budget ELA and AAR were inspired by Reference Braithwaite and MüllerBraithwaite and Müller (1980) who did it for 33 glaciers.
The ELA concept is not applicable to all glaciers. For example, on glaciers with a small altitude range, local variations in specific balance may mask the altitudinal variations so there is no simple line separating the ablation area from the accumulation area. In an extreme case, where the specific balance values are more or less randomly distributed over the glacier surface, the ELA concept is meaningless and the balanced-budget AAR will be about 0.5.
Data Sources
In the present paper, we update the above concepts using an improved dataset. The bulk of the mass-balance data were published in the series Fluctuations of glaciers (Reference KasserKasser, 1967; PSFG, 1973, 1977, 1985; WGMS, 1988, 1993, 1998, 2005). The data consist of annual values of various mass-balance elements, including annual ELA, as well as topographic metadata for the studied glaciers (e.g. median, maximum and minimum altitudes). Aside from these data, Reference DyurgerovDyurgerov (2002) and Reference Dyurgerov and MeierDyurgerov and Meier (2005) have been particularly diligent in hunting down extra mass-balance data from obscure publications that are not included in the WGMS dataset, and in correcting previously published values. We now have at least 1 year of mass-balance data for 351 glaciers for the period 1946–2006. This number is volatile, as new data are coming in all the time and we regularly update our database. Results presented here are based on data available to us on 31 August 2008.
Balanced-Budget Ela and Mean Specific Balance
Several workers (Reference LiestølLiestøl, 1967; Hoinkes, 1970; Reference ØstremØstrem, 1975; Reference Braithwaite and MüllerBraithwaite and Müller, 1980; Reference Raper and BraithwaiteSchytt, 1981) have established linear regression equations linking ELA t in the
year t, to the mean specific balance bt :

where β is an empirical factor for the glacier in question and ELA0 is the balanced-budget ELA, i.e. the value of ELA t that makes the mean specific balance equal to zero. The β parameter must be negative because bt will be negative when ELA t is above ELA0.
A simple conceptual model linking ELA to mass balance can be derived by assuming a linear relation between specific balance bit and altitude hi , where i refers to the altitude:

where k is the balance gradient near the ELA, i.e. energy of glaciation as first proposed in 1947 by Reference RichterShumsky (1997) or activity index of Reference Meier and PostMeier (1962). Equation (2) need only be valid for the range of ELA variations during the observation period.
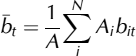
The glacier of total area A is divided up into N altitude bands of area Ai . Multiplying both sides of Equation (2) with Ai and area-averaging over all N altitude bands, of total area A gives the mean specific balance b:
and

where h is the area-weighted mean altitude of the glacier. If the conceptual model (Equation (2)) is true, β = –k and ELA0 = h. The equality of balanced-budget ELA and mean altitude was first stated by Reference KurowskiKurowski (1891) if we allow for changes in terminology.
The parameters β and ELA0 are assumed to be constant for the period of record from the glacier in question and are defined by Equation (1). However, the true balance gradient k will probably fluctuate somewhat from year to year, and from place to place on the glacier, while the balanced-budget ELA0 will vary with advance or retreat of the glacier.
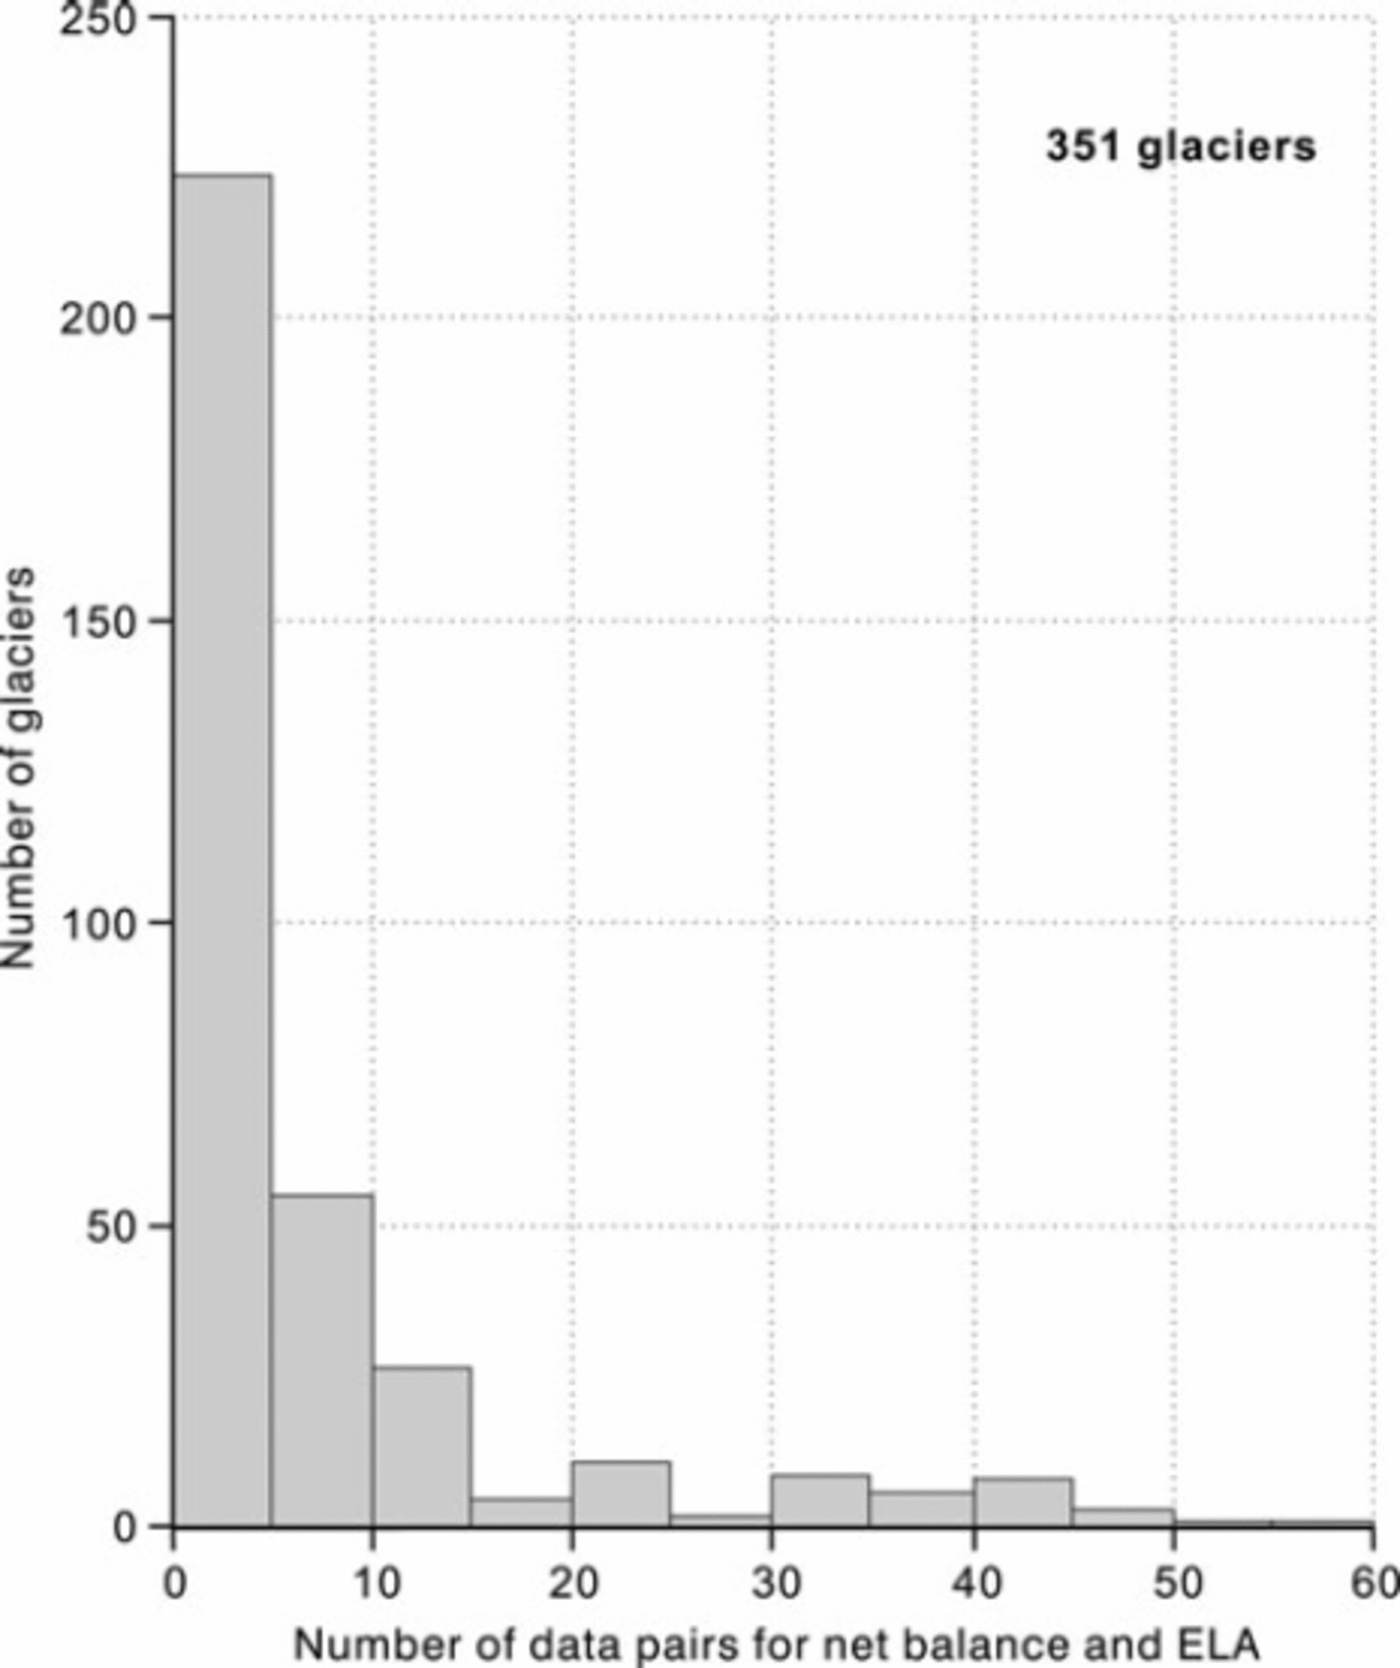
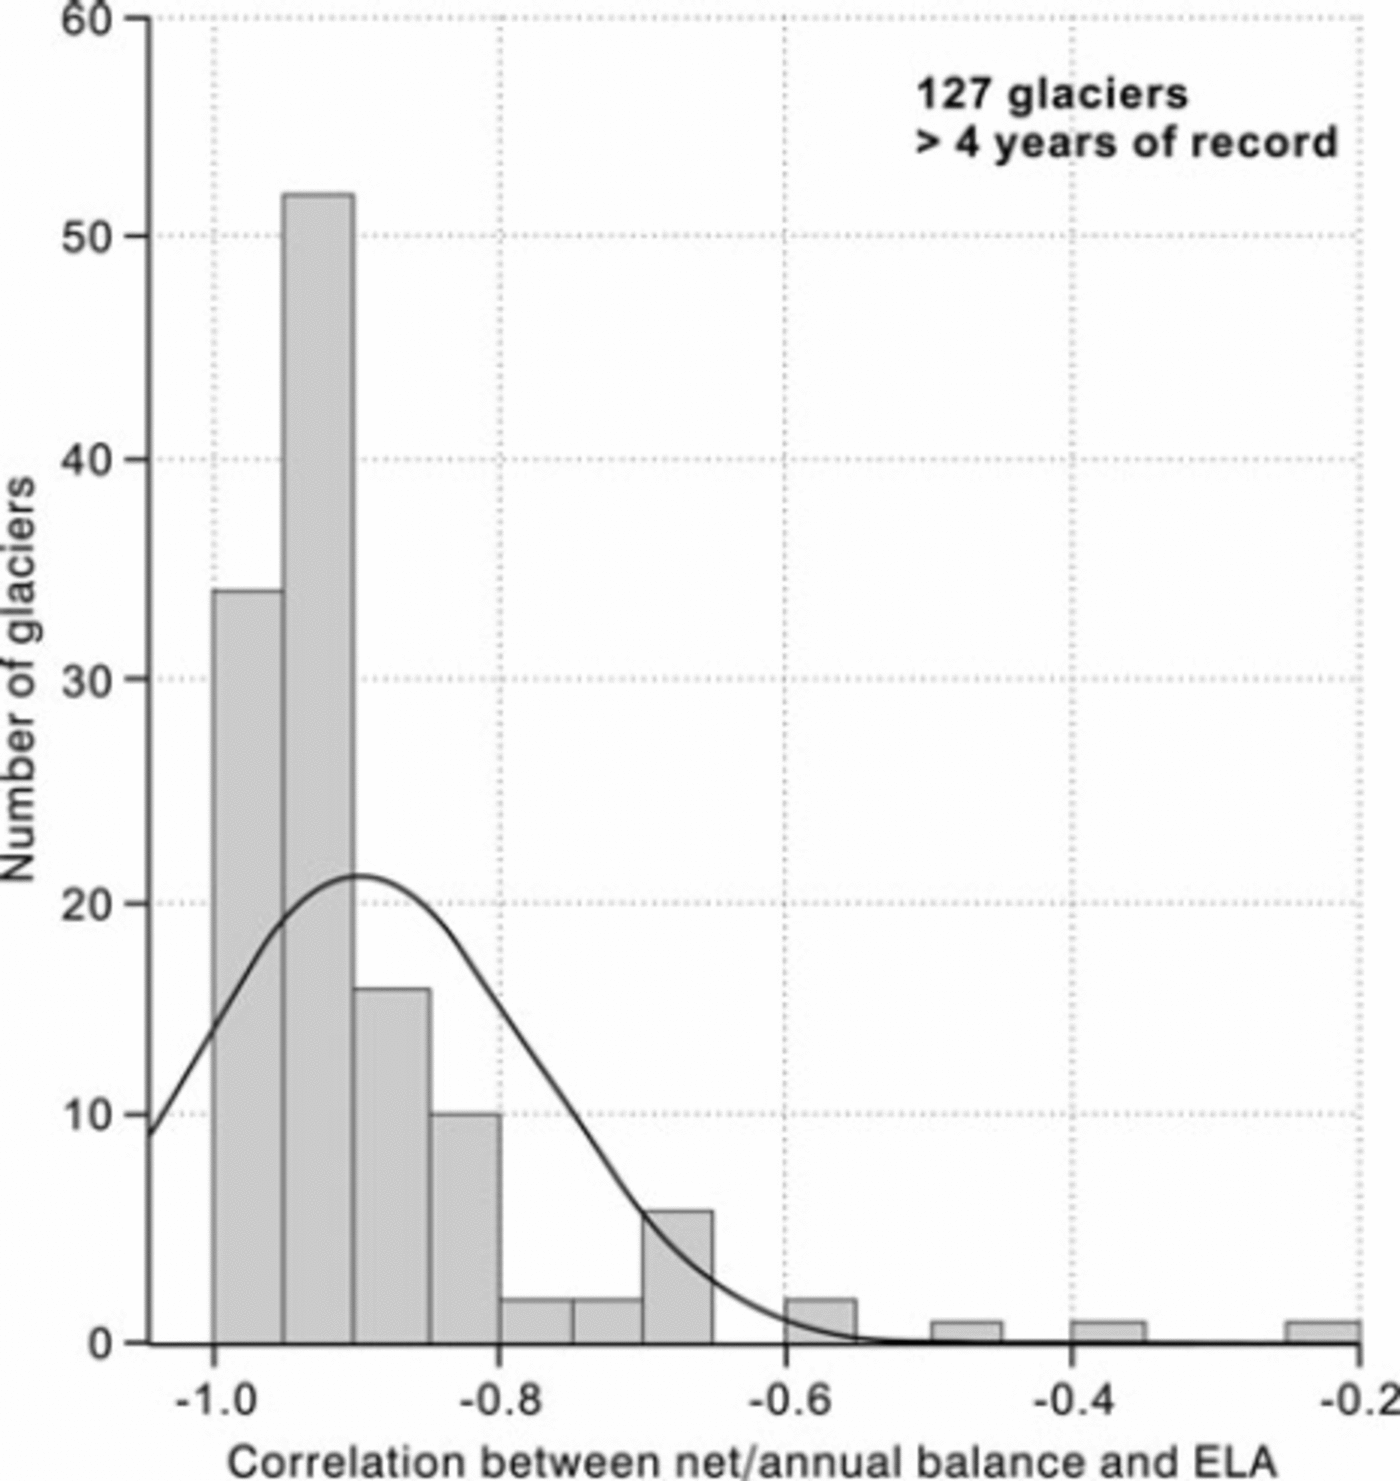
We take 5 years of record as the bare minimum acceptable to calculate correlations between mass balance and ELA. Most of the 351 glaciers in our database actually have fewer data than this (Fig. 1). This mainly reflects the effects of short measurement series, but there are also, surprisingly, some longer series where ELA data have not been reported. There are only 127 glaciers with at least 5 years of record for both mean specific balance and ELA. Many of the series are shorter than 10 years but some are several decades in length. Correlation coefficients were calculated between mean specific balance and ELA for each of these 127 glaciers. There are high negative correlations in most cases but also some surprisingly low negative correlations, indicating little or no relation between the two variables for some glaciers. The many high negative correlations are encouraging, but the low negative correlations are worrying. For glaciers with poor correlations, the raw data in our dataset were carefully rechecked against the original source, if available, or with tabulations in Reference DyurgerovDyurgerov (2002) and Reference Dyurgerov and MeierDyurgerov and Meier (2005). Some obvious data errors were detected and corrected, but there are still 11 glaciers with correlations less negative than –0.71 (Fig. 2), suggesting that mass balance explains <50% of the ELA variance in these cases. These low correlations could be caused by errors of measurement or transcription that we have not yet detected, or by some unknown physical process. For example, large year-to-year variation of β in Equation (2) would degrade the correlation between mass balance and ELA.
Availability of data for mean specific balance and ELA for 351 glaciers. Based on data available to the authors on 31 August 2008.
Correlation coefficients for mean specific balance versus ELA for 127 glaciers. The curve is for a hypothetical normal distribution with the same mean and standard deviation as the data. Based on data available to the authors on 31 August 2008.
The slopes of the regression lines for mass balance versus ELA can be interpreted in terms of balance gradients. We will discuss these in detail in another paper and we now concentrate on the balanced-budget ELA which we calculate from the slope and intercept of the regression line for mass balance versus ELA, i.e. as –(intercept/slope).
Balanced-Budget Ela and Glacier Topography
There are potentially many ways of describing glacier topography, but the WGI (Reference Müller, Caflisch and MüllerMüller and others, 1977) already contains several altitude parameters for many thousands of glaciers: the median, maximum and minimum altitudes. We therefore compare balanced-budget ELA with median glacier altitude (Fig. 3), where the latter data are only available for 94 out of the 116 glaciers with significant correlation between mass balance and ELA. There is an extremely high correlation (correlation coefficient = 0.998, significant at p = 0.01 with sample size 94) between the two altitudes over an altitude range of nearly 6000 m, expressing the wide geographical diversity of our dataset.
Relation between balanced-budget ELA and median glacier altitude for 94 glaciers. Based on data available on 31 August 2008.
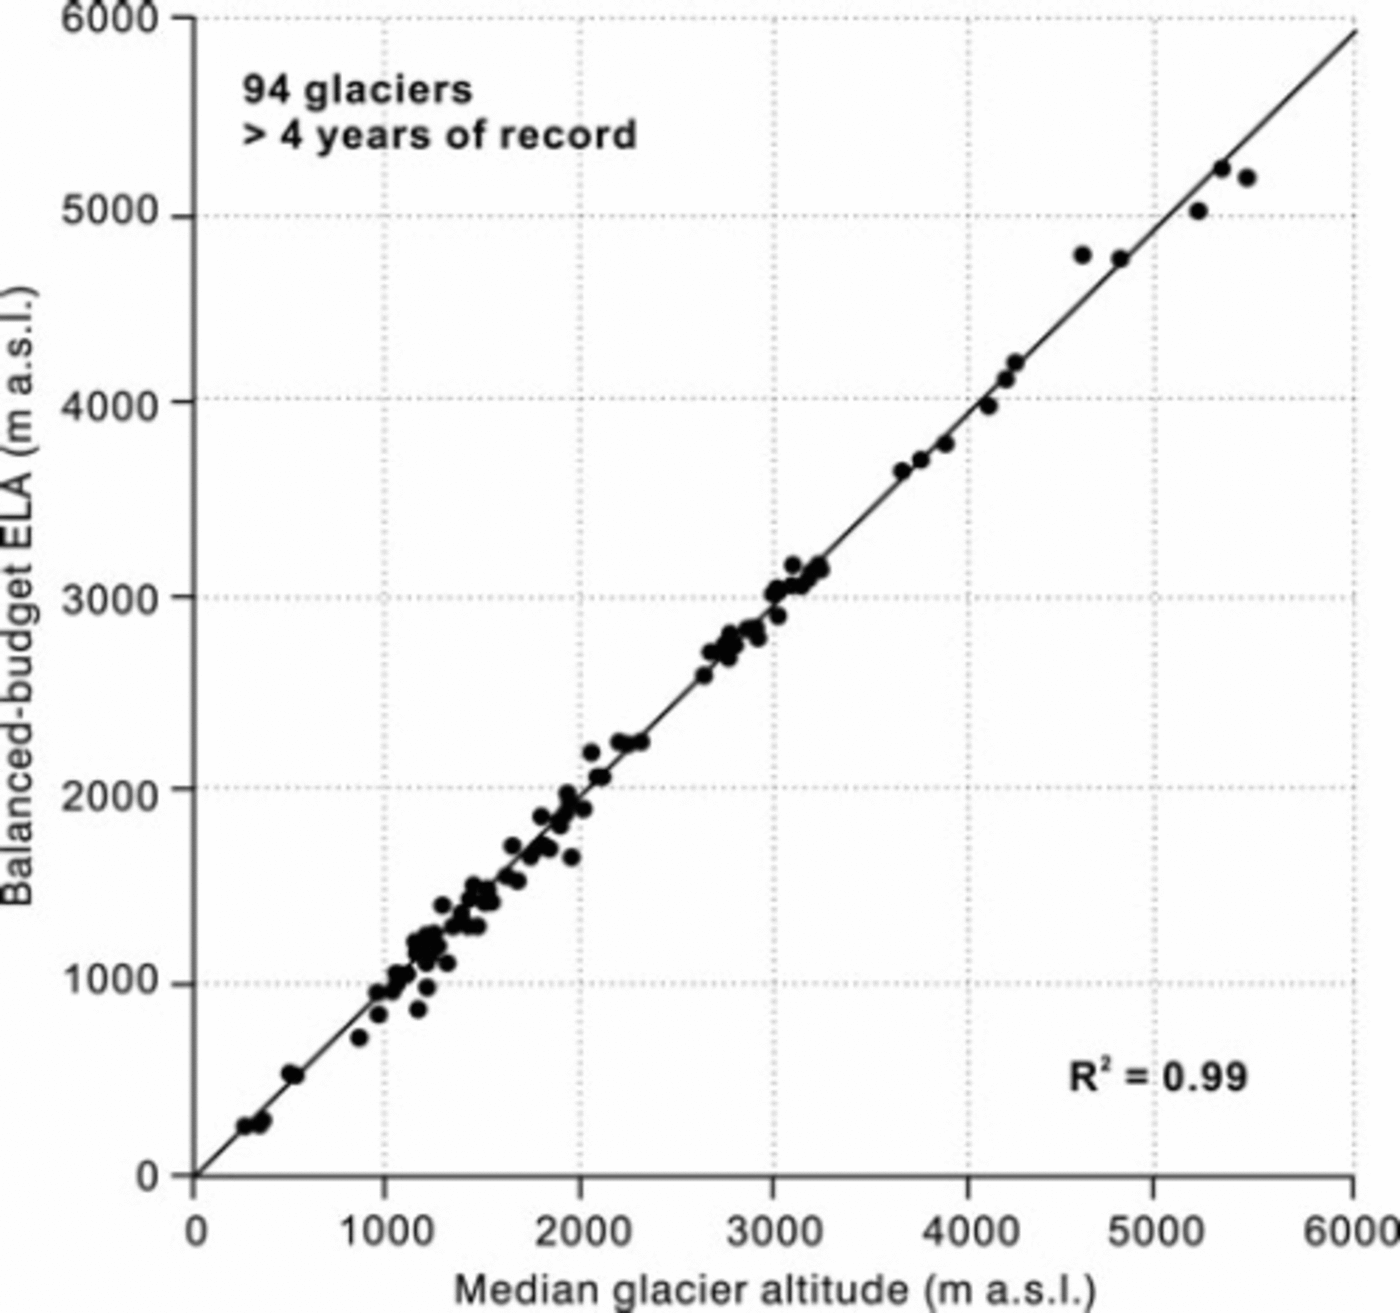
For cases where median altitude is not available, a midrange altitude Reference Evans and Cox(Evans and Cox, 2005) can be calculated as the average of maximum and minimum glacier altitudes. These mid-range altitudes are also very well correlated with balanced-budget ELA (correlation coefficient = 0.99, significant at p = 0.01 with sample size 94). The absolute errors in estimating balanced-budget ELA from median altitudes have mean and standard deviations of –38 and ±82m for the 94 glaciers. The corresponding values using mid-range altitudes are –27 and ±125 m.
The above results are based on series with at least 5 years of joint record for mean specific balance and ELA. As this choice is somewhat arbitrary, we repeated calculations with at least 10 years of record which, all things equal, should give more accurate estimates of balanced-budget ELA. Increasing the acceptable sample size to 10 years reduces the number of glaciers in the study to only 61 but hardly affects the differences between balanced-budget ELA and median and mid-range altitudes, i.e. with means and standard deviations of –47±72 and –30±115ma.s.l.
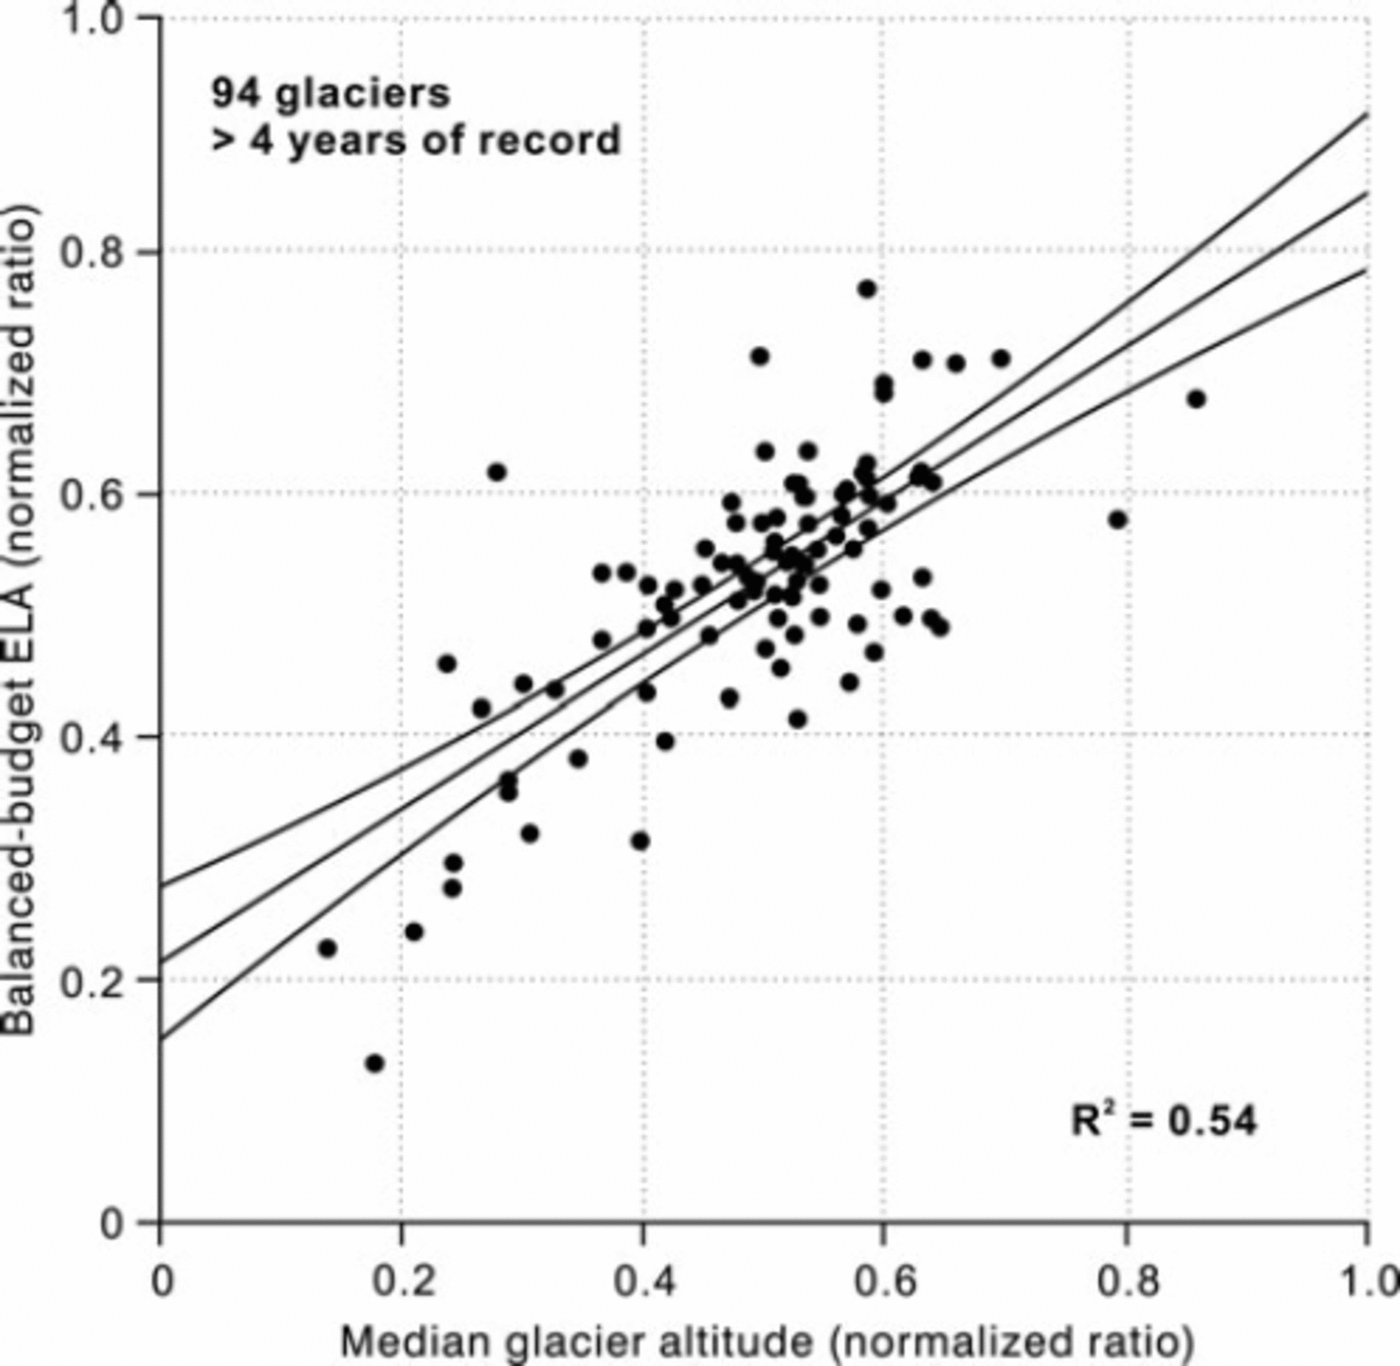
The high correlations with balanced-budget ELA are to some extent ‘forced’ by the large geographical variations in the dataset. For example, a randomly chosen altitude on each glacier would still have a relatively high correlation with balanced-budget ELA. This effect can be illustrated by expressing balanced-budget and median altitudes as deviations from maximum glacier altitude H max and dividing by the altitude range of the glacier (H max–H min), i.e. the normalized ratio for balanced-budget or median altitude x is given by (H max–x)/(H max–H min). Maximum glacier altitude is a better choice for such normalization than minimum altitude because it is likely to be less variable over time when the glacier advances or retreats (Reference KasserRaper and Braithwaite, 2006). The correlation between balanced-budget ELA and median elevation after this normalization (Fig. 4) is somewhat lower than found with non-normalized data (Fig. 3) but still reasonably large (correlation coefficient = 0.73, significant at p = 0.01 with sample size 94).
We note that the mid-range altitude (average of maximum and minimum altitudes) of a glacier has a normalized ratio of 0.5. The scatter in Figure 4 shows that normalized ratios of 0.4–0.6 are common both for balanced-budget ELA and for median glacier altitude, showing that both these indirect ELA estimates are generally close to the mid-range altitude. The moderately high correlation between the two variables shows that both variables have similar deviations from the mid-range altitude.
Relation between balanced-budget ELA and median glacier altitude for 94 glaciers after normalization with respect to maximum and minimum glacier altitude. Based on data available to the authors on 31 August 2008.
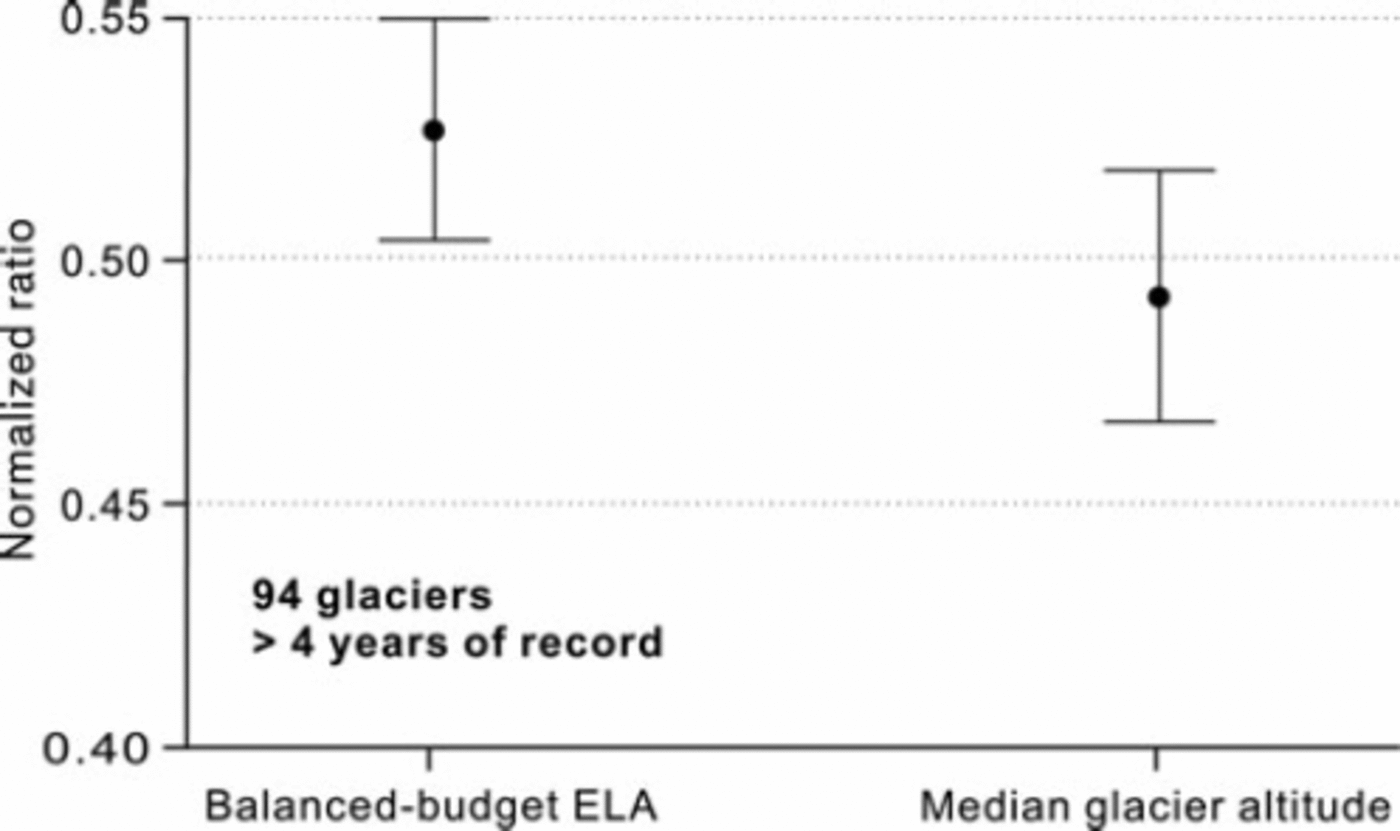
An alternative way of depicting the present results is given in Figure 5 which shows the mean and 95% confidence intervals of balanced-budget ELA and median altitude. If it is recalled that both data are expressed as normalized deviations below the maximum altitude, increase in normalized ratio involves decrease in altitude in ma.s.l. The balanced-budget ELA is therefore on average below the median altitude, but the 95% confidence intervals overlap so the difference may not be statistically significant. The mid-range altitude has a normalized ratio of 0.5, and balanced-budget ELA is significantly below mid-range altitude (at 95% level), while mean glacier altitude is not significantly different from mid-range altitude (at 95% level). The close agreement of mid-range and median altitudes may explain why the two concepts are often conflated.
Mean and 95% confidence interval for balanced-budget and median glacier altitude for 94 glaciers. The data are expressed as normalized deviations below the maximum altitude of glaciers.
The generally strong association between balanced-budget ELA and median and mid-range altitudes reflects the tendency of many glaciers to be ‘fat in the middle’. This is consistent with the necessity for maximum ice discharge being through the vertical cross-section associated with the balanced-budget ELA.
Implications for the Future
Some authors have applied glacier–climate models to global glacier cover to calculate sea-level rise from melting glaciers (Reference Oerlemans and FortuinOerlemans and Fortuin, 1992; Reference ShumskyVan de Wal and Wild, 2001; Reference Braithwaite and RaperBraithwaite and Raper, 2002; Reference KasserRaper and Braithwaite, 2006). With the exception of the last, these assessments make no use of data from the WGI. We certainly hope that the coverage of the WGI can be increased to such a degree that it is used for future global assessments.
Glacier–climate models need calibration with field data to evaluate disposable parameters. For example, Reference Oerlemans and FortuinOerlemans and Fortuin (1992) and Reference Braithwaite, Zhang and RaperBraithwaite and others (2003) vary precipitation over glaciers to fit their models to observed curves of specific mass balance versus altitude. However, such data are only available for ~102 glaciers, and earlier workers (Reference Oerlemans and FortuinOerlemans and Fortuin, 1992; Reference ShumskyVan de Wal and Wild, 2001; Reference Braithwaite and RaperBraithwaite and Raper, 2002) extend their results from the modelled glaciers to global glacier cover by simple correlations using climatological characteristics of different glacier regions (e.g. annual precipitation).Reference KasserRaper and Braithwaite (2006) use a similar approach but apply their model to the estimated ELA where accumulation is assumed equal to the ablation calculated by the model rather than fitting their model to the full altitude–area curve. We could therefore apply glacier–climate models to any glacier, or glacier region, where we can estimate balanced-budget ELA. From the regression line in Figure 3, we can calculate the balanced-budget ELA from median glacier altitude with an error of about ±82 m. Using the analogous regression in terms of mid-range glacier altitude, we obtain a somewhat greater error of ±125 m. If air-temperature data are extrapolated to the estimated ELA with a vertical lapse rate of 0.006 Km–1, the corresponding error in mean temperature at the ELA is about ±0.5–0.7 K.
The current WGI (http://nsidc.org/data/g01130.html) contains data for 106 364 glaciers covering a total area of 236 294km2. This coverage is very much biased to Eurasia, as much of the Western Hemisphere is still not covered. Data for median and mid-range altitudes are available for many glaciers in the WGI. However, median glacier altitude is sometimes given as identical to the mid-range altitude. We accept this for individual glaciers, but if it occurs over a whole region (e.g. for some parts of the former Soviet Union), we assume that the compilers applied the wrong definition of median elevation and we then mark median altitude as missing for these areas.
The inventoried glaciers can be aggregated into a total of 1973 half-degree grid squares. Out of this total, averages for median glacier elevation are only available for 1164 grid squares (59% of the total). Rather more data are available for mid-range elevation than for median altitude, with 1722 grid squares (87% of the total).
The WGI must be expanded to cover the remaining areas of global glacier cover, especially in the Western Hemisphere. The present study demonstrates that median glacier altitude is a useful parameter for estimating balanced-budget ELA0 and it should certainly be included in new datasets. With new methods of automated data extraction from satellite images, it should be possible to calculate median glacier altitude with near-geodetic precision. However, corresponding estimates of regional ELA may not be more accurate than today because the limiting factor is the accuracy of the relation between ELA and median glacier altitude.
Conclusions
There is often a reasonably high correlation between mean specific balance and ELA for individual glaciers, and balanced-budget ELA can be estimated from the regression equation linking the two. Balanced-budget ELA is approximately equal to median glacier altitude, although generally somewhat lower. Data for median glacier altitude are compiled as part of the WGI, and ELA can therefore be estimated (with an error of ±82 m) for those regions covered by the inventory. If data are not available for median glacier altitude, the mid-range altitude can be used as a less accurate proxy for ELA (with an error of ±125 m).
Acknowledgements
R.J.B.’s main contribution to this joint paper was made during a period of research leave from the University of Manchester (February–August 2008) and he thanks colleagues for covering his teaching and administration duties. We are grateful to the many glaciologists who freely distribute their hard-won data, especially via the World Glacier Monitoring Service in Zürich, for synthesis and study by others.



