Although scholars often collect data that are continuous in nature within set bounds, statistical models are not easily designed to handle this design. For example, in the social, medical, and behavioral sciences, there has been increasing usage of slider and visual analog scales as a way to capture nuanced information from human respondents (Cooper and Kagel Reference Cooper and Kagel2016; Roster, Lucianetti, and Albaum Reference Roster, Lucianetti and Albaum2015).
However, despite the increasing popularity of these types of data, the approaches in the statistical literature have significant limitations. While practitioners often fall back on ordinary least squares regression (OLS) as a convenient and easily interpretable way to analyze the data, the unimodal, unbounded Normal distribution cannot capture important characteristics of the sample. More recently, scholars have turned to the Beta regression model (Ferrari and Cribari-Neto Reference Ferrari and Cribari-Neto2004) as a more flexible continuous distribution. Although the Beta distribution is defined over the (0,1) interval, it can be used on any continuous distribution within fixed bounds because it is straightforward to normalize any distribution to the (0,1) interval.
While this clever parameterization permits powerful inference on these bounded, potentially bimodal distributions, the Beta regression’s main flaw is that it cannot model observations that are degenerate, that is, equal to the lower bound of 0 or the upper bound of 1. Various solutions have been proposed, such as transforming the outcome so that all observations are strictly between 0 and 1 (Smithson and Verkuilen Reference Smithson and Verkuilen2006), and more recently, modeling 0s and 1s through separate processes via zero-or-one-inflated Beta regression (Ospina and Ferrari Reference Ospina and Ferrari2012) or the zero-and-one Beta regression model (Liu and Kong Reference Liu and Kong2015; Swearingen, Melguizo, and Bursac Reference Swearingen, Melguizo and Bursac2012), which is also known as the ZOIB. However, as I show in this paper, transforming the outcome can inadvertently have important consequences for model results, while the ZOIB has issues with overfitting the data by fitting multiple sets of parameters to degenerate (bounded) and continuous responses separately.
A new approach is given in this paper that seeks to capture the best points of the existing approaches while permitting straightforward and efficient inference. To do so, I employ ordered cut points, similar in spirit to an ordered logit model, to estimate the joint probability of 0s (the lower bound), continuous proportions, and 1s (the upper bound) in bounded continuous data. As only one predictive model is used for all of the outcomes, the effect of covariates is identified across degenerate and continuous observations without resulting in overfitting. The use of cut points permits the model to fit distributions with mostly degenerate observations or no degenerate observations at all, which makes it a general solution to this problem.
To compare this new model, I estimate a Monte Carlo simulation to examine how existing approaches compare along an array of criteria. The results show that ordered Beta regression estimates marginal effects much more precisely than competitors, resulting in higher power, while performing admirably on measures of overall fit. Furthermore, the simulation shows that the alternative of transforming values to avoid boundaries in Beta regression can have difficult-to-predict implications and should be avoided.
To apply the model, I replicate the Aidt and Jensen (Reference Aidt and Jensen2014) influential study on the spread of suffrage in Europe as a function of revolutions in neighboring countries. While the proposed estimator supports the main findings of the study, there are wide discrepancies in terms of the efficiency of estimators and for some covariates, both sign and significance. I show in this section how the ZOIB can overfit the data by allowing for too much heterogeneity between degenerate and continuous responses, resulting in marginal effects which are substantively difficult to interpret.
1 Background
Bounded continuous data with observations at the bounds are common across scientific fields. While there are too many possible applications to list here, bounded scales have been employed prominently in medical pain research via visual analog scales (VAS) (Myles et al. Reference Myles, Myles, Wendy Galagher, Boyd, MacDonald and Dennis2017; Roster et al. Reference Roster, Lucianetti and Albaum2015), and slider scales more generally in psychological research (Lee, Hicks, and Nino-Murcia Reference Lee, Hicks and Nino-Murcia1991; Monk Reference Monk1989), and political science and economics (Cooper and Kagel Reference Cooper and Kagel2016; Liu and Wang Reference Liu and Wang2015; Nelson Reference Nelson2008). Dose–response relationships often have lower and upper bounds (Prentice Reference Prentice1976), and the analysis of chemical concentrations likewise involves bounds with continuous values (Fisher, Ricardo, and Fox Reference Fisher, Ricardo and Fox2020; Ritz et al. Reference Ritz, Baty, Streibig and Gerhard2015). As such, it is an important empirical domain for applied statistical analysis, and one that remains an active subject of research.
The default approach for modeling this type of variable is OLS regression as the variable is at least in part continuous. OLS, as the maximum entropy estimator for any continuous distribution with finite variance (Jaynes Reference Jaynes2003), is likely to capture at least some of the relevant features of the distribution. The more “Normal” the distribution, the more likely this approximation will give interpretable answers. However, Smithson and Verkuilen (Reference Smithson and Verkuilen2006) raise important questions about this application of OLS to upper- and lower-bounded dependent variables. They argue that OLS’s failure to capture higher-order moments of the distribution represents a serious shortcoming because these moments, such as skewness and variance, may well affect what can be learned from the model and even the theoretical questions one can ask. One variation is to use a “quasi-likelihood” estimator called fractional logit (Papke and Wooldridge Reference Papke and Wooldridge1996) in which the trial parameter in the Bernoulli distribution is modeled as a continuous response with the logit link function. The primary drawback of fractional logit is that it is not itself a statistical distribution, and so the estimates’ uncertainty can be difficult to define. As I show later, the estimator also appears to be heavily affected by the ratio of continuous to degenerate (i.e., at the bounds) responses in the outcome.
More recently, Beta regression (Ferrari and Cribari-Neto Reference Ferrari and Cribari-Neto2004) has become an increasingly popular technique because it is a model explicitly designed for bounded continuous data. The main drawback of Beta regression, as mentioned earlier, is that it cannot handle observations at the bounds given that it is a distribution of probabilities. There are two straightforward ways to handle degenerate values within the Beta regression framework. The first is to simply drop these responses and model the remaining data. If the count of 0s and 1s in the data is small, this strategy would seem reasonable. A more sophisticated strategy is to normalize the outcome within a set of bounds that are close to, but never equal to, one. The formula from Smithson and Verkuilen (Reference Smithson and Verkuilen2006) that has received considerable attention from researchers is as follows. For a given outcome
 $y_i \in [0,1]$
,
 $i \in \{1,2, \dots , N\}$
, define a normalized outcome
 $y_j$
:
 $$\begin{align*}y_j = \frac{y_i(N-1) + 0.5}{N}. \end{align*}$$
The distribution of
 $y_i$
is nudged so that the values can never reach 0 or 1, and the amount of the nudge is determined by N. A larger sample will result in extreme values that are closer to the boundaries. This transformation permits Beta regression modeling without any need for further modeling choices. As such, it is a computationally simple and straightforward solution. However, it is not immediately clear what ramifications this transformation has on inferences as the transformation is nonlinear and varies with sample size.
Finally, the most recent development in this vein is the ZOIB model, an approach that this paper builds upon. While Ospina and Ferrari (Reference Ospina and Ferrari2012) proposed a ZOIB regression, where a degenerate process could be used to model either category separately, Liu and Kong (Reference Liu and Kong2015) show how to model both 0s and 1s in a ZOIB regression model with two distinct processes for degenerate responses. In this paper, I focus on the Liu and Kong (Reference Liu and Kong2015) parameterization because it is possible to estimate effects of independent variables on the full scale of the dependent variable (DV), that is, lower bounds, continuous values, and upper bounds. I return to the Ospina and Ferrari (Reference Ospina and Ferrari2012) model in the discussion.
I first detail the Liu and Kong (Reference Liu and Kong2015) parameterization as a useful starting place. It is important to note that this model and the model I present later both assume that there are qualitative differences between degenerate (i.e., responses at the bounds) and continuous values of the DV. By contrast, OLS is a model that does not differentiate between the bounds and the continuous values, unless such a distinction happens via post hoc processing (Horrace and Oaxaca Reference Horrace and Oaxaca2006). However, the way in which the two Beta-based models interpret this distinction varies and has an important implication for estimation and inference.
Given a bounded continuous response
 $y_i$
with observations at the bounds of the scale, the ZOIB estimates three separate probabilities, which I label as
 $\alpha $
for
 $Pr(y_i=0)$
,
 $\gamma $
for
 $Pr(y_i=1)$
, and
 $\delta $
for
 $Pr(y_i>0 \cap y_i<1)$
. Given these probabilities, we can define a conditional distribution over
 $y_i$
that depends on the realization of
 $y_i$
in these three mutually exclusive outcomes, along with parameters
 $\mu $
and
 $\phi $
to model the continuous outcomes via the Beta distribution (defined below):
 $$ \begin{align} f(y_i|\alpha,\gamma,\delta,\mu,\phi) = \left\{\begin{array}{lr} \alpha & \text{if } y_i=0\\[3pt] (1-\alpha)\gamma & \text{if } y_i=1\\[3pt] (1-\alpha)(1-\gamma)\text{Beta}(\mu,\phi) & \text{if } y_i \in (0,1)\\[3pt] \end{array}\right\}, \end{align} $$
where the Beta distribution is defined as follows:
 $$ \begin{align} f(y_i, \omega,\tau) = \frac{\Gamma(\omega + \tau)}{\Gamma(\omega)\Gamma(\tau)}y_i^{\omega-1}(1-y_i)^{\tau-1}. \end{align} $$
To directly estimate the mean of the Beta distribution, we can substitute the parameters
 $\mu $
and
 $\phi $
(precision) for the shape parameters
 $\omega $
and
 $\tau $
:
 $$ \begin{align} \mu = \frac{\omega}{\omega+\tau}, \end{align} $$
 $$ \begin{align} \phi = \omega + \tau. \end{align} $$
Returning to the ZOIB model in (1), we can see that the Beta distribution is being deflated by the probabilities
 $\alpha $
and
 $\gamma $
such that the contribution of the Beta distribution cannot exceed
 $(1-\alpha )(1-\gamma )$
, that is,
 $\delta $
. To parameterize the model, we can include regressors
 $\alpha = g(X'\beta _\alpha )$
,
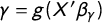 $\gamma = g(X'\beta _\gamma )$
, and
 $\mu =g(X'\beta _\delta )$
for a given matrix of covariates X. These linear models are rescaled with the inverse logit function
 $g(\cdot )$
to map on to
 $(0,1)$
. While the covariates X for each of the submodels could be different or shared, the parameters
 $\beta _\alpha $
,
 $\beta _\gamma $
, and
 $\beta _\delta $
need to be distinct for each submodel as the three processes are functionally independent. To make the estimates comparable to OLS and ordered beta regression, I only consider a version of the model with identical covariates in all three submodels.
It is important to note that the ZOIB submodels are not ordered, that is, they are exchangeable. While this point is rather subtle, it is very important for the modeling exercise that follows. It is possible in this model for
 $Pr(y_i=0)$
and
 $Pr(y_i=1)$
to both increase independently of
 $Pr(y_i>0 \cap y_i<1)$
. This independence can isolate heterogeneity in either end of the slider scale such that the decisions to choose a 1 or a 0 are distinct choices with no necessary connection to each other, which is similar in principle to a selection model like a hurdle (Zorn Reference Zorn1998).
This exchangeability, however, comes at a cost of overfitting the distribution if the underlying processes are in fact generated by the same process. As the number of covariates X increases, the number of parameters necessarily triples (assuming that all covariates are used to predict all parts of the model). The independence between submodels means that X could positively predict
 $Pr(y_i=0)$
and negatively predict
 $Pr(y_i=1)$
in the same model without contradiction. If the degenerate outcomes represent a fundamental different process versus the continuous outcomes, than modeling this heterogeneity is necessary, but otherwise it introduces a substantial additional level of complexity.
2 Model
To resolve the problem of overparameterization in the ZOIB, I present ordered Beta regression. The main difference between this approach and the ZOIB model is to induce dependence between the three probabilities
 $\alpha $
,
 $\gamma $
, and
 $\delta $
. To do so, I borrow ideas from the literature on the ordered (cumulative) logit model (McCullagh Reference McCullagh1980).
To give the intuition behind the model, I first define it in terms of measuring individual preferences. Suppose that data are being collected on the preferences of individual i over an outcome that is continuous in
 $\mathbb {R}^1$
. We can denote these latent preferences as
 $y_i^*$
. We collected a set of measurements
 $y_i$
for each individual in our sample concerning their preferences. However, because we cannot represent
 $\mathbb {R}^1$
in a limited space, we can only collect data using a bounded scale, resulting in a biased estimate of true preferences
 $y_i^*$
for those with preferences above or below the bounds of the scale.
While we cannot directly observe
 $y_i^*$
, we can obtain estimates of our uncertainty using a bounded scale as a stand-in for true preferences. We can think of the distribution of our measurements
 $y_i$
as being a realization of a latent cumulative distribution function
 $F(y_i^*)$
defined by a set of ordered cut points
 $\{k1,k2: k1<k2\}$
. Each cut point represents the point at which the bounds of the observed scale become more likely than the continuous values. The farther past the cut point an individual’s preferences are, the more likely that individual will provide a measured value of
 $y_i$
at the bound. Providing estimated locations for these cut points in
 $F(y_i^*)$
will permit us to also estimate the approximate intensity of preferences that are lost in the data measurement process, and consequently correct for bias in the reported data.
Importantly, because we are interested in a single latent scale of preferences
 $y_i^*$
, we can also have a single set of regressors
 $X'\beta $
that predict this latent variable,
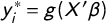 $y^*_i = g(X'\beta )$
. At very low values of
 $y_i^*$
below
 $k_1$
, we observe a degenerate outcome
 $y_i=0$
, and at very high values of
 $y_i^*$
above
 $k_2$
, we observe a degenerate outcome
 $y=1$
. For intermediate values of
 $y_i^*$
, we observe the Beta-distributed outcome
 $y_i \in (0,1)$
, which we can assume is unbiased over its range (i.e., strictly within the bounds).
Using
 $y_i^*$
and cut points
 $k_1$
and
 $k_2$
, we can now redefine the probabilities
 $\alpha $
,
 $\gamma $
, and
 $\delta $
where
 $$ \begin{align} \left\{\begin{array}{lr} \alpha = 1 - g(X'\beta - k_1)\\[6pt] \delta = \left[g(X'\beta - k_1) - g(X'\beta - k_2) \right ] \text{Beta}(g(X'\beta),\phi)\\[6pt] \gamma = g(X'\beta - k_2)\\[3pt] \end{array}\right\}. \end{align} $$
We can see that we can still obtain the necessary probabilities
 $\alpha $
(
 $Pr(y_i=0)$
),
 $\gamma $
(
 $Pr(y_i=1)$
), and
 $\delta $
(
 $Pr(y_i>0 \cap y_i<1)$
) to combine the 0s, 1s, and proportions into a single distribution. However, unlike in (1), the probabilities are no longer exchangeable, but rather ordered due to the cut points. The position of the cut points
 $k_1$
and
 $k_2$
will affect each outcome by either decreasing or increasing the probability of that outcome occurring. As
 $k_1$
increases,
 $Pr(y_i=0)$
must increase and
 $Pr(y_i>0 \cap y_i<1)$
must decrease. Similarly, an increase in
 $k_2$
will necessarily make
 $Pr(y_i=1)$
decrease and increase
 $Pr(y_i>0 \cap y_i<1)$
.
In terms of latent utility, the position of the cut points defines the potential loss of information about an individual. If the cut points increase, then there would seem to be more bunching around the end of the observed scale, and consequently, only higher levels of
 $y_i^*$
are associated with observations at the bounds. As the cut points decrease toward zero, there is no clear break in the distribution around the bounds and consequently little reason to expect significant bias. As can be seen in (5), if both
 $k_1=0$
and
 $k_2=0$
, then the probability of
 $\delta $
, or a continuous observation, is simply equal to
 $\text {Beta}(g(X'\beta ),\phi )$
, that is, there is no need to adjust the observed data and the probability of a degenerate outcome increases in tandem with the continuous outcomes.
This is another important distinction between the ordered beta regression and the ZOIB model—both treat responses at the bounds as qualitatively different than the continuous responses in some sense, but the ordered beta regression allows the extent of difference to be a smooth function of the data. As I describe in Section 6, the ZOIB can be more helpfully thought of as a type of selection model in which cases can select into and out of continuous responses. In this framework, a degenerate response of 0 is equally distinct from all continuous responses regardless of their proximity to 0. By contrast, the ordered beta model is more appropriate when the outcome is a single, possibly latent, scale, and the bounds of the scale are qualitatively different from continuous responses mainly in terms of strength or intensity, not type.
The implication of using ordered cut points means that only two parameters, the cut points themselves, are required in addition to the auxiliary parameter
 $\phi $
. Thus, only two parameters more than OLS are required to fit this model, improving considerably efficiency and information retrieval relative to the ZOIB, as shown in Section 4. It is possible to expand the model by permitting thresholds to vary by groups, as in the graded response model (Samejima Reference Samejima, van der Linden and Hambleton1997), although I do not consider those extensions here. This type of heterogeneity could improve model fit, but sample-average cut points are appropriate when subgroup-level differences are not the primary aim of the analysis.
To consider the model from a Bayesian perspective, I assign weakly informative priors to the parameters. I define these as
 $$ \begin{align} \beta &\sim N(0,5), \end{align} $$
 $$ \begin{align} \phi &\sim E(.1), \end{align} $$
 $$ \begin{align} s(\mathbf{K},0) &\sim D(\mathbf{1}). \end{align} $$
I use what is known as an induced Dirichlet prior over the set of cut points K in which the cut points are converted to a vector of probabilities via a sigmoid function
 $s(\cdot )$
(Betancourt Reference Betancourt2019). A vector of 1s is passed to the Dirichlet distribution to assume that the probability of each submodel, 0, 1, and the Beta model, is equal a priori. Similarly, the prior on
 $\beta $
is weakly informative on the logit scale. The prior on
 $\phi $
is an exponential distribution with a rate parameter of .1. This prior would need to be adjusted if
 $\phi $
took on very large values, which could occur if the distribution became highly centered on a single point.
More informative priors for the cut points could be useful in a repeated sampling situation in which observations at the bounds may or may not be present in a given sample. An informative cut point prior could stabilize inferences across samples by informing model estimates that observations at the bounds are likely to occur even if they are not in the sample at hand.
It is possible to further parameterize
 $\phi $
to model higher moments in the distribution. A lower value of
 $\phi $
for a given value of
 $\mu $
is associated with a more dispersed distribution, either 0, 1, or both depending on the value of
 $\mu $
. This kind of information can be useful to analyze in a context where understanding which subjects tend to choose middle versus extreme values is a research question of interest. To do so, we simply replace
 $\phi $
with a set of regressors
 $\beta _\phi $
and a covariate matrix X (the covariates could be shared or different from those used to predict the mean of the distribution). The ability to model
 $\phi $
is an important advantage of employing the Beta distribution as it permits inferences on the nature of multimodal distributions in ways that OLS and other alternatives cannot.
In the Supplementary Material, I write out the full log-likelihood and joint posterior of the model.
3 Estimation
Estimation of the model is done using Hamiltonian Markov Chain Monte Carlo (MCMC) with the software Stan (Carpenter et al. Reference Carpenter2017). The model converges fairly rapidly with less than 1,000 iterations on simulated data. In addition to sampling the model above, I also draw from the posterior-predictive distribution of
 $y_i$
, denoted
 $\int _\Theta p(\tilde {y_i}|\theta )p(\theta |y_i)\text {d}\theta $
, conditional on the posterior estimate of the model parameters (denoted
 $\theta $
) for a given number of MCMC draws S. To do so, I first sample a categorical outcome
 $y_{repO} \in \{1,2,3\}$
based on an ordered categorical tuple of the probabilities
 $\alpha $
,
 $\gamma $
, and
 $\delta $
:
 $$ \begin{align} y_{repO}^s \sim \text{Cat}(\{1,2,3\},\{\alpha^s,\delta^s,\gamma^s\}). \end{align} $$
If
 $y_{repO}^s$
is equal to 1 or 3, then assign 0 and 1, respectively, to
 $y_{rep}^s$
:
 $$ \begin{align} y_{rep}^s = 0& \text{ if } y_{repO} = 1, \end{align} $$
 $$ \begin{align} y_{rep}^s = 1& \text{ if } y_{repO} = 3. \end{align} $$
I then draw from the Beta distribution if
 $y_{repO}=2$
.
 $$ \begin{align} y_{rep}^s \sim \text{Beta}(\mu_s,\phi_s). \end{align} $$
In addition to this predictive distribution, I also examine measures of model fit. I use an estimate of leave-one-out (LOO) predictive density in which the posterior predictive distribution is evaluated by dropping a data point
 $y_i$
, estimating the model, and predicting the held out
 $y_i$
. Given that this measure is computationally challenging with Bayesian inference, I employ an approximation from Vehtari, Gelman, and Gabry (Reference Vehtari, Gelman and Gabry2016), the Pareto-stabilized important sampling (PSIS)-LOO predictive density:
 $$ \begin{align} \hat{elpd}_{psis_loo} = \sum_{i=1}^N \text{log } \left( \frac{\sum_{s=1}^S \omega_i^s p(y_i|\theta^s)}{\sum_{s=1}^S \omega_i^s} \right). \end{align} $$
The
 $\omega _i$
are weights derived from importance sampling of the joint posterior for each data point
 $y_i$
and smoothed by the Pareto distribution to account for outliers. The resulting quantity, the expected log pointwise predictive density (elpd), can be interpreted as the log density of a future dataset
 $\tilde {y}_i$
from the “true” data-generating process. Higher values of the metric indicate a better fit to the DV. Importantly, this quantity can be evaluated on any of the models discussed so long as the same data are used to fit the model. In addition, this calculation yields an estimate of the effective number of parameters in each model, which is an indicator of relative model complexity.
Finally, I also estimate sample average marginal effects for each parameter c in
 $\beta $
on the expected value of
 $y_i$
. I use sample average marginal effects because it is a relatively model-neutral way of understanding the effect of coefficients on the response. For example, the ZOIB produces three sets of coefficients for each predictor, but only one sample average marginal effect per predictor. I evaluate these marginal effects through numerical differentiation of
 $\frac {\partial E(y_i|\beta _{-c},K)}{\partial \beta _c}$
, iterating over all elements c in
 $\beta $
(Leeper Reference Leeper2021). I suppress
 $\phi $
in the notation because it does not by definition factor into the calculation of the expected value.
I can then evaluate inferential properties of the different models in terms of the true marginal effect versus the estimated marginal effects. I calculate M-errors for the magnitude of bias and S-errors for the proportion of draws where the model estimates the wrong sign of the marginal effect (Gelman and Carlin Reference Gelman and Carlin2014). I calculate coverage rates as the proportion of simulations in which the model’s 5%–95% posterior interval includes the true marginal effect.
4 Simulations
To compare the models, I simulate data in a manner consistent with the distribution by using the formula described above. Because the results of simulations can be sensitive to the particular values of parameters, I draw from a broad range of possible values to simulate the ordered Beta regression model. For a given number of covariates q, level of correlation between covariates
 $\rho _q$
, vector of covariate effects
 $\mathbf {\beta _q}$
, scalar precision parameter
 $\phi $
, and cut points
 $k \in \{1,2\}$
, these ranges are defined as
 $$ \begin{align} \phi &\sim U(0.5,30), \end{align} $$
 $$ \begin{align} q &\sim U(1,15), \end{align} $$
 $$ \begin{align} \rho_q &\sim U(0,0.9), \end{align} $$
 $$ \begin{align} \mathbf{\beta_q} &\sim U(-5,5), \end{align} $$
 $$ \begin{align} k_1 &\sim U(-10,-1), \end{align} $$
 $$ \begin{align} k_2 &\sim k_1 + U(0.5,10). \end{align} $$
The total number of observations N is also sampled from a uniform distribution between 100 and 4,000. For this simulation, 10,000 independent variates were drawn from the distributions above. Because the broad bounds on the parameters permit relatively sparse distributions, such as no zeros or ones (or no continuous values), any set of parameter values that could not produce at least five observations from the zeroes, ones, and continuous parts of the distribution was discarded as the ZOIB is difficult to estimate with that level of sparsity. I also report a simulation in the Supplementary Material in which the values of these parameters are fixed and I vary sample size N to permit more precise inference at specific values.
In addition to the ordered Beta regression model specified above, four other models were fit to the data. Two kinds of Beta regression models were fit, one using the transformation specified in Smithson and Verkuilen (Reference Smithson and Verkuilen2006) and the second only using the continuous values of the distribution (discarding degenerate outcomes). I also included the ZOIB model specified above and a Bayesian version of OLS. Finally, I added a Bayesian version of the fractional logit model using the Papke and Wooldridge (Reference Papke and Wooldridge1996) parameterization.
All of the estimated values came from Hamiltonian Markov Chain Monte Carlo chains using Stan (Carpenter et al. Reference Carpenter2017) to permit comparability. All models are run with two chains of 1,000 iterations each with 500 samples discarded as warmup in each chain. The use of the same sampler ensures that the results are comparable across models. The Beta regression models and the OLS regression were fit with brms (Bürkner Reference Bürkner2017).
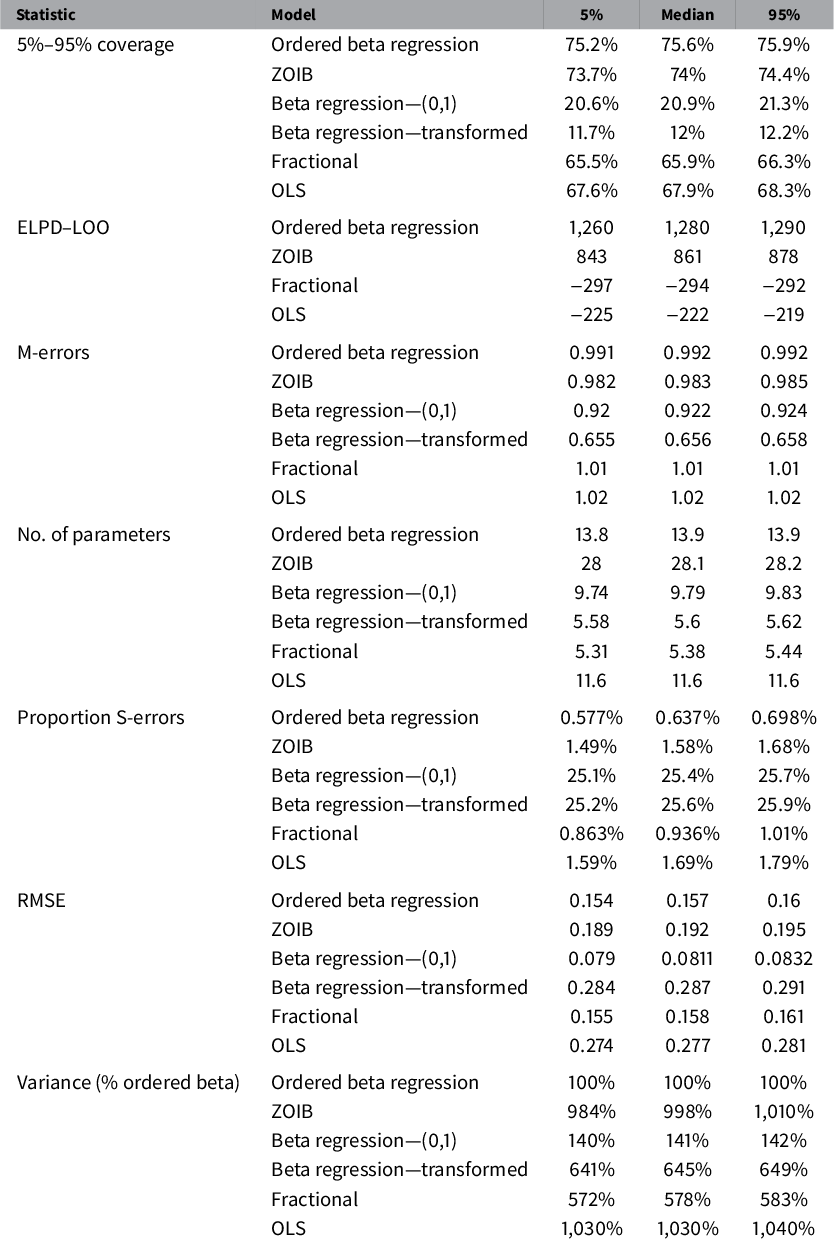
The simulation results are reported in Table 1 by model and summary statistic calculated from the Monte Carlo draws. As can be seen, the ordered Beta regression has the highest coverage, as would be expected. The ZOIB model has a marginally lower coverage rate, whereas OLS and fractional logit are both approximately 10% lower. The two types of Beta regressions have quite low coverage rates, below 50% of the simulation draws.
Comparison of simulation diagnostics.

The reported M-errors (Gelman and Carlin Reference Gelman and Carlin2014) in Table 1 are defined as the ratio of the estimated marginal effect to the true marginal effect. This statistic can capture bias across the distributions, as a completely unbiased estimator would equal exactly 1. As can be seen, in finite samples, this is not so, although the ordered Beta regression model approaches 1. While the ZOIB, OLS, and fractional logit all have noticeable bias, bias is much worse for the Beta regression models. Similarly, S-errors, which are defined as the probability of estimating the wrong sign relative to the true marginal effect, are 3–4 times more common in other models relative to ordered beta regression.
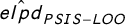
In terms of model complexity, the effective number of parameters of ordered beta regression is quite similar to OLS, but half that of the ZOIB. Interestingly, fractional logit and the beta regressions have fewer effective parameters than ordered beta regression, implying these models are actually underspecified. Higher
 $\hat {elpd}_{PSIS-LOO}$
values likewise correctly select ordered beta regression as the “true” model and the ZOIB as a second competitor, which would be expected given the similar nature of these models.
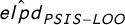
However, the closeness in
 $\hat {elpd}_{PSIS-LOO}$
values only measures similar fit to the response variable rather than inference. The ZOIB and ordered beta regression differ significantly in the amount of uncertainty in estimating the marginal effect. Table 1 shows that the average variance of the posterior density for ordered beta regression sample average marginal effects is far less than the ZOIB and other alternatives.
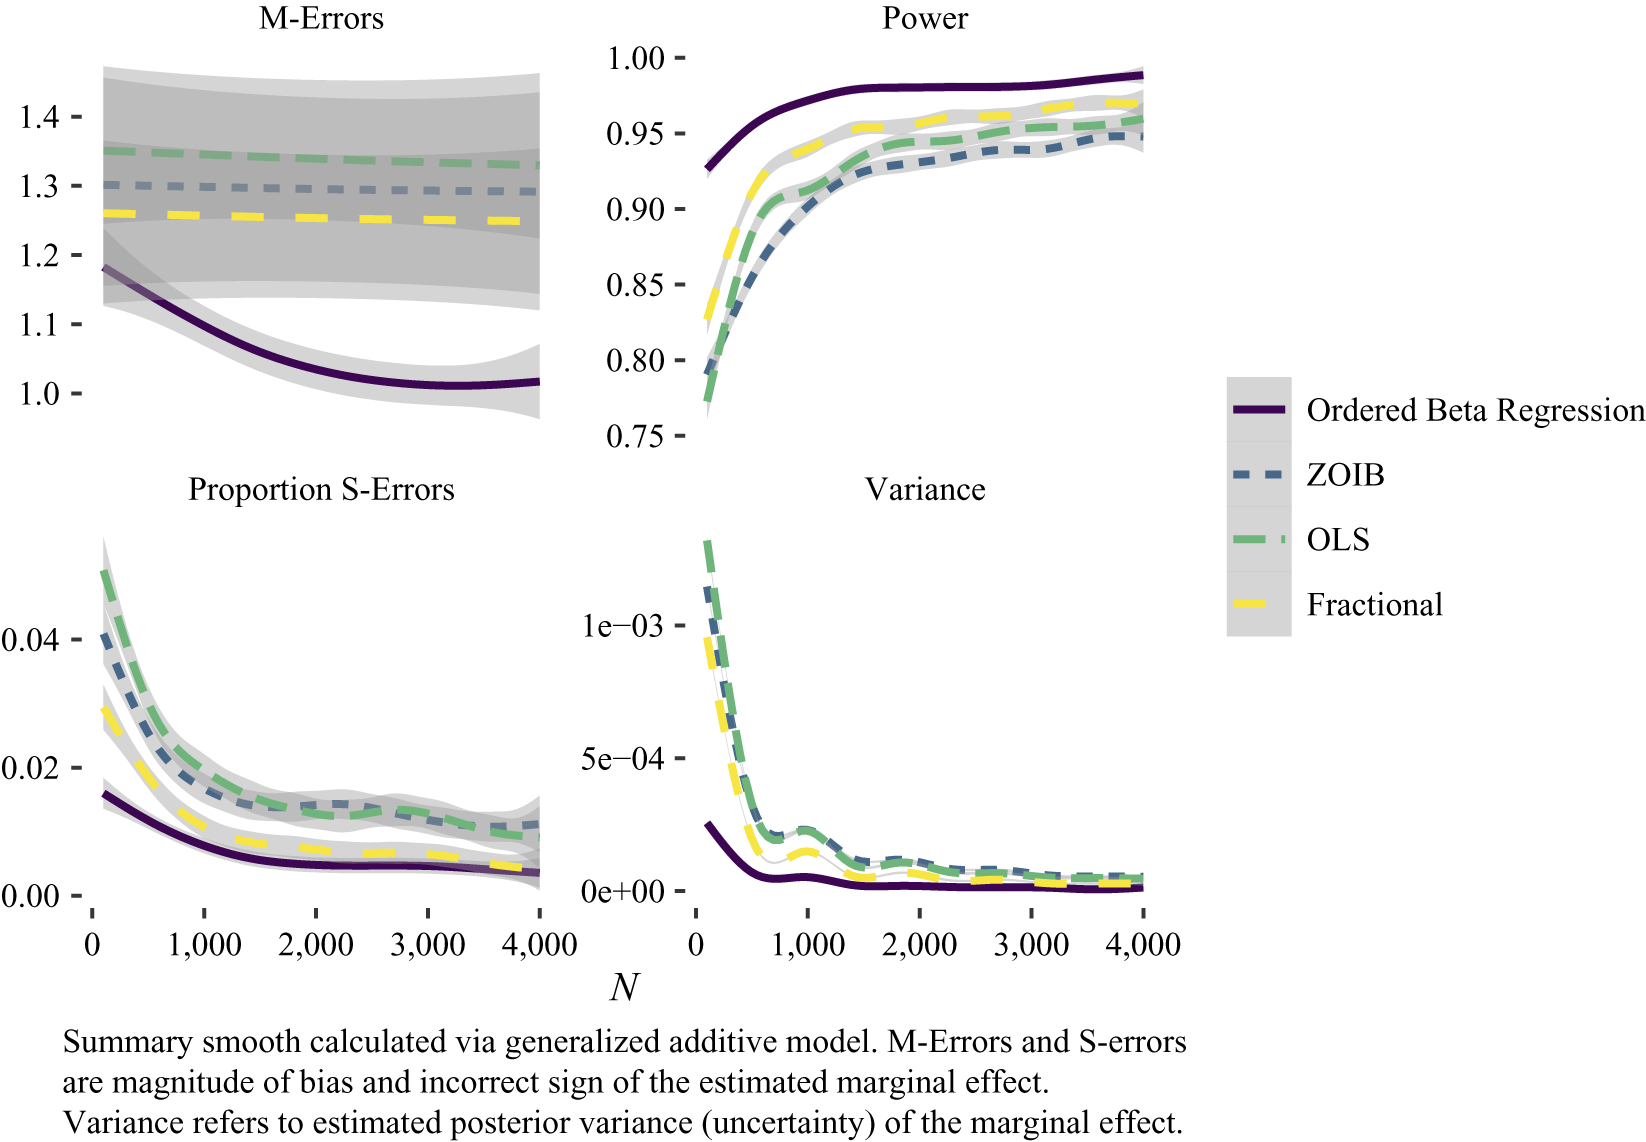
I further explore differences between models by examining these statistics as a function of sample size N in Figure 1. I also include power as a separate calculation, that is, the probability of detecting an effect different from zero (defined as a posterior interval with the same sign as the marginal effect). As can be seen, ordered beta regression outperforms on these key inferential metrics, and the difference is more pronounced when sample sizes are less than 1,000. Above 1,000, differences are smaller, although they still persist. Interestingly, the simulation does not show that M-errors decrease noticeably with larger samples.
Bias in estimates as a function of sample size.

The fixed simulation results, which are available in the Supplementary Material, show that for certain values of parameters, it is possible for the ZOIB to have lower variance in estimated sample average marginal effects than ordered beta regression. However, the decrease in variance is small, whereas the increase in bias via M-errors is quite large: in the fixed simulation, the ZOIB estimates coefficients with less than half the magnitude of the true marginal effect.
As a result, even without looking at empirical examples, it is difficult to recommend OLS, fractional logit, or transformed continuous outcomes as a general approach for analyzing these types of data. Fractional logit and OLS perform reasonably well at recovering marginal effects, but they have noticeably lower coverage rates. Transformation of the outcome to the
 $[0,1]$
interval is also clearly not a harmless strategy as it dramatically changes the estimated marginal effects. Discarding degenerate outcomes can likewise affect parameter estimates even though the continuous outcomes are predicted by the same linear model as the degenerate outcomes. All of the alternatives estimate marginal effects with substantially more uncertainty than the ordered beta model.
It is clear that even though ordered beta regression can be understood as a special case of the ZOIB, the simplified parameterization has real consequences for inference. As is seen in the statistics in Figure 1, the ZOIB can recover marginal effects and has high
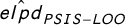 $\hat {elpd}_{PSIS-LOO}$
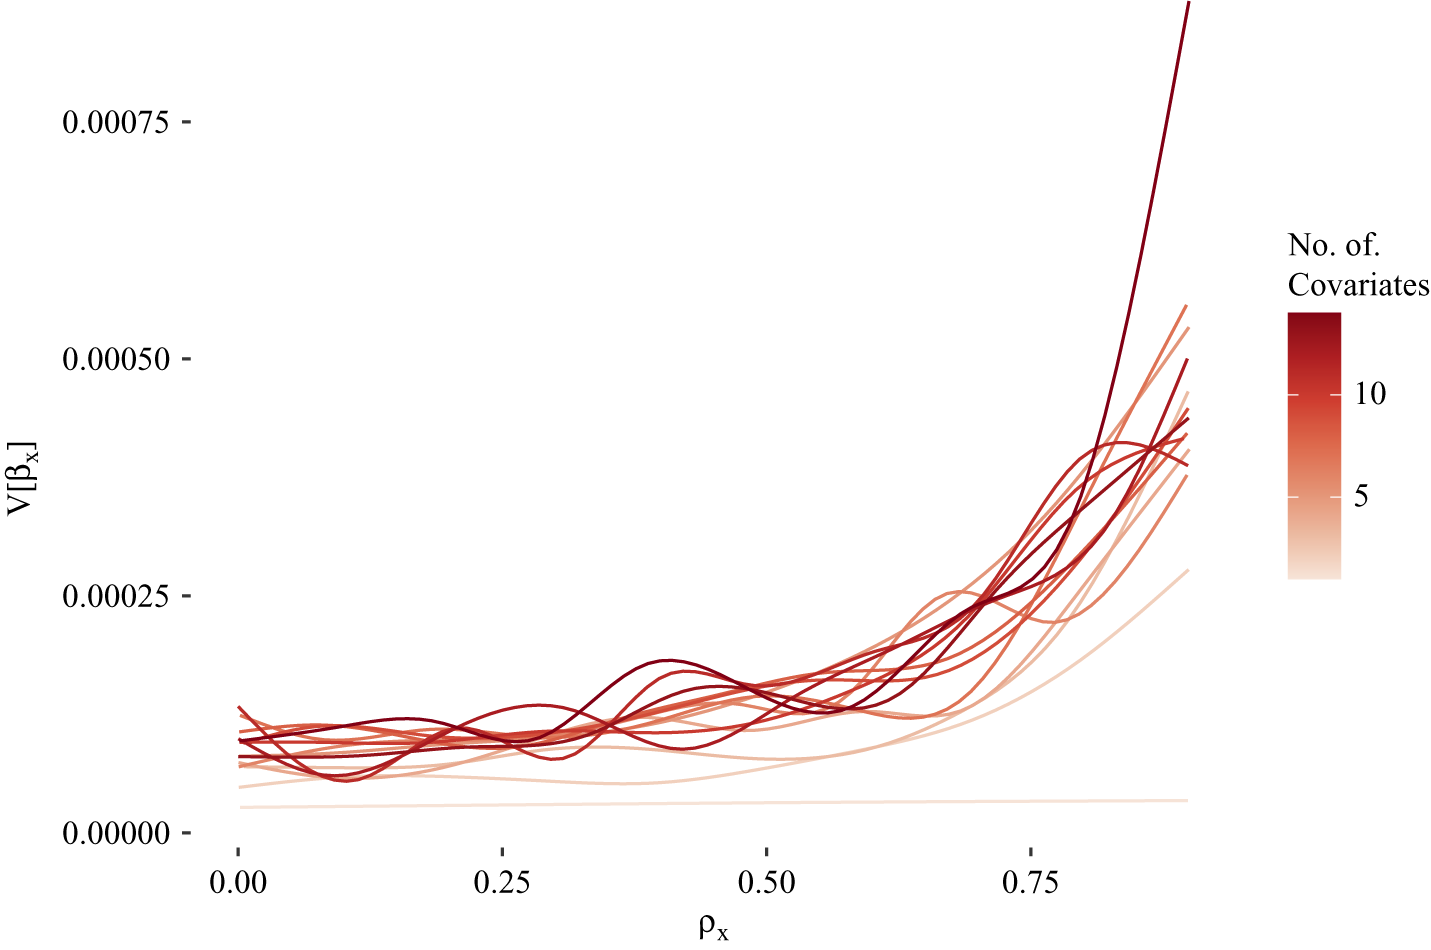
scores, but its model complexity is far higher and its marginal effects are substantially more uncertain. To make the distinction clearer, I show variance estimates of marginal effects from the ZOIB conditional on the correlation (
 $\rho _x$
) and number of covariates in Figure 2. As can be seen, variance increases considerably when the number of covariates and the correlation between covariates is high.
Bias in ZOIB estimates as a function of number and correlation of covariates.Notes: Summary smooth calculated via generalized additive model. Variance of
 $\beta _x$
refers to estimated posterior variance (uncertainty) of the marginal effect. Variance calculated conditional on simulated covariate correlation
 $\rho _x$
.

To distinguish the models in an applied setting, I next turn to an empirical example.
5 Empirical Examples
To apply the model, I examine data from the Aidt and Jensen (Reference Aidt and Jensen2014) study of the extension of suffrage in Europe as a function of the geographical spread of democratic revolutions in neighboring countries. Their measure of suffrage is a 0–100 index, and they employ OLS as a primary model with fractional logit as a robustness check. I re-estimate one of their main panel data (country-year) specifications (model 5 of Table 2 in Aidt and Jensen (Reference Aidt and Jensen2014)) with ordered beta regression, transformed Beta regression, and the ZOIB.
Because of the inclusion of a lagged dependent variable with limited overtime variation, I used the QR matrix decomposition to avoid poor sampling due to high posterior correlation (Stan Development Team 2016). I also do not employ the paper’s standard error corrections as these do not have clear analogues in Bayesian inference, although the estimates for OLS are still quite similar to those in the original paper.
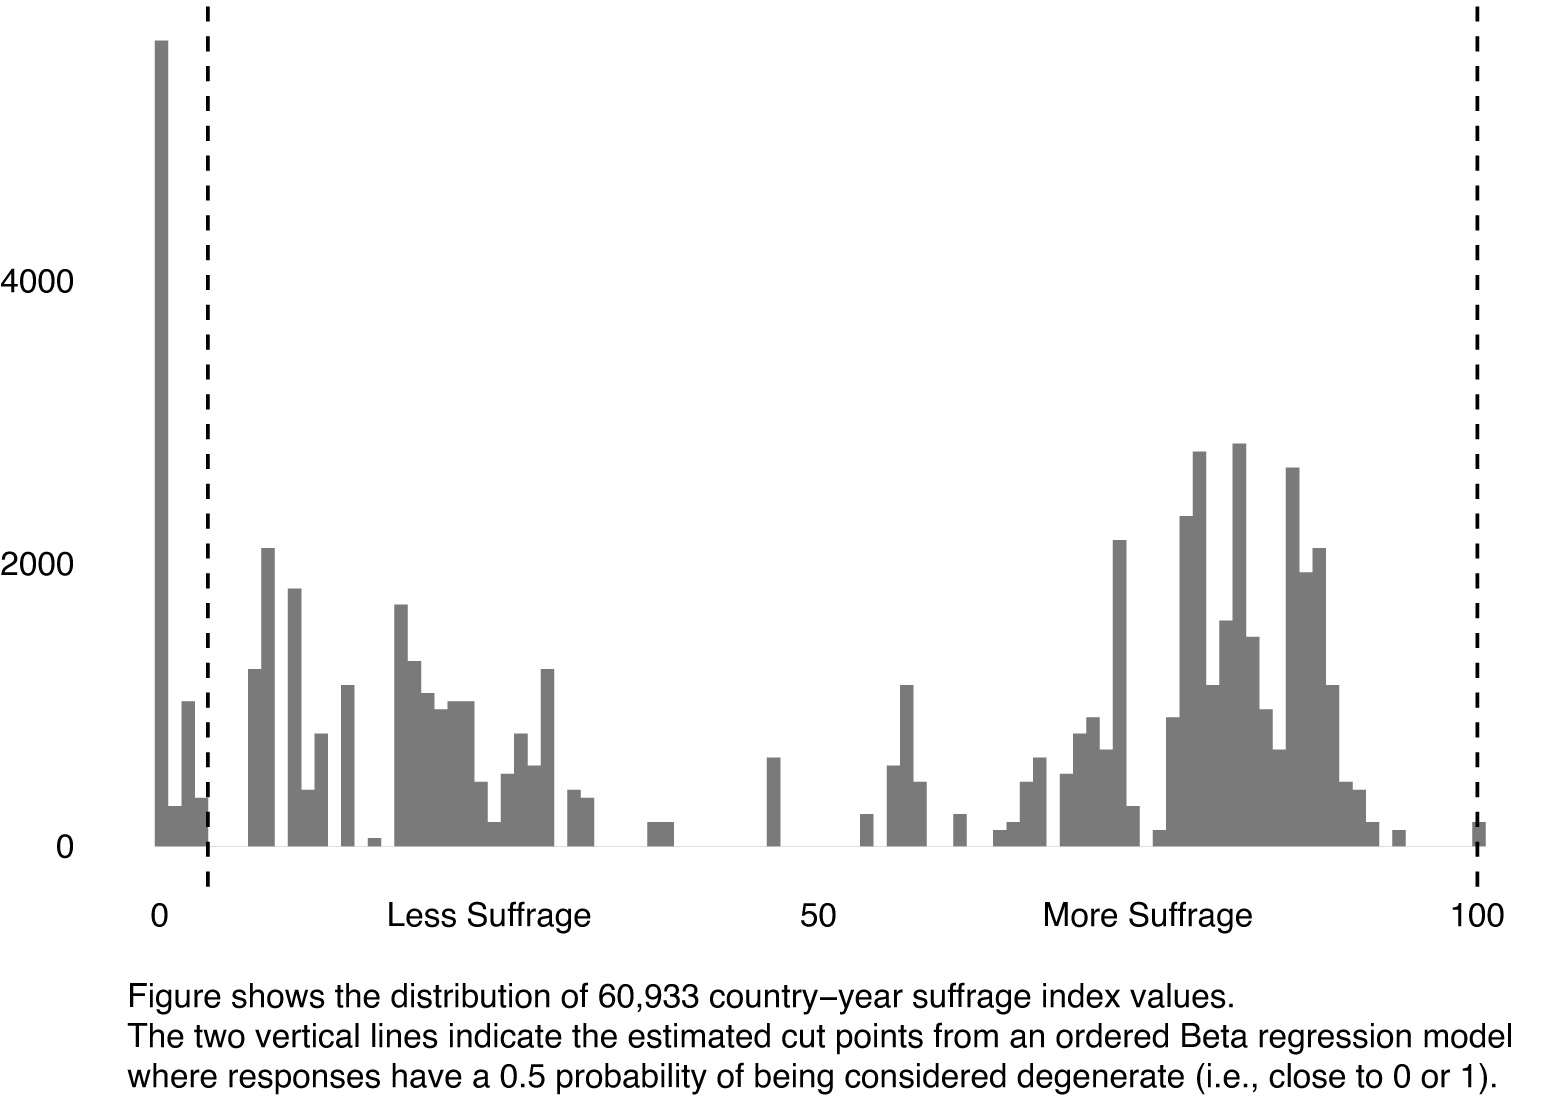
A histogram of the dependent variable (normalized to
 $[0,1]$
) is shown in Figure 3. The figure reveals significant bunching around the lower end of the scale, and more modest bunching at the upper end of the scale. I plot the estimated location of the cut points from an ordered Beta regression fit as vertical dashed lines over the histogram, showing that there is substantial reason to believe that the end points are qualitatively different from the continuous responses. As such, it is potentially a useful empirical application for the ordered beta regression model, as underlying the scale is a single-dimensional latent concept—inclusion in the electoral system—but also reason to believe that moving from a suffrage value of 0 to 0.1 (at least some inclusion) entails larger changes in the latent variable than a transition from 0.1 to 0.2 or from 0.5 to 0.6.
Suffrage index from Aidt and Jensen (Reference Aidt and Jensen2014) with estimated cut point locations.

I fit each of the models in the simulation to the empirical data. Unfortunately, as I do not know the “true” sample average marginal effects, I cannot calculate M-error or S-error rates, nor can I directly compare the variance of the estimates to each other. However, I do calculate RMSE,
 $\hat {elpd}_{psis_loo}$
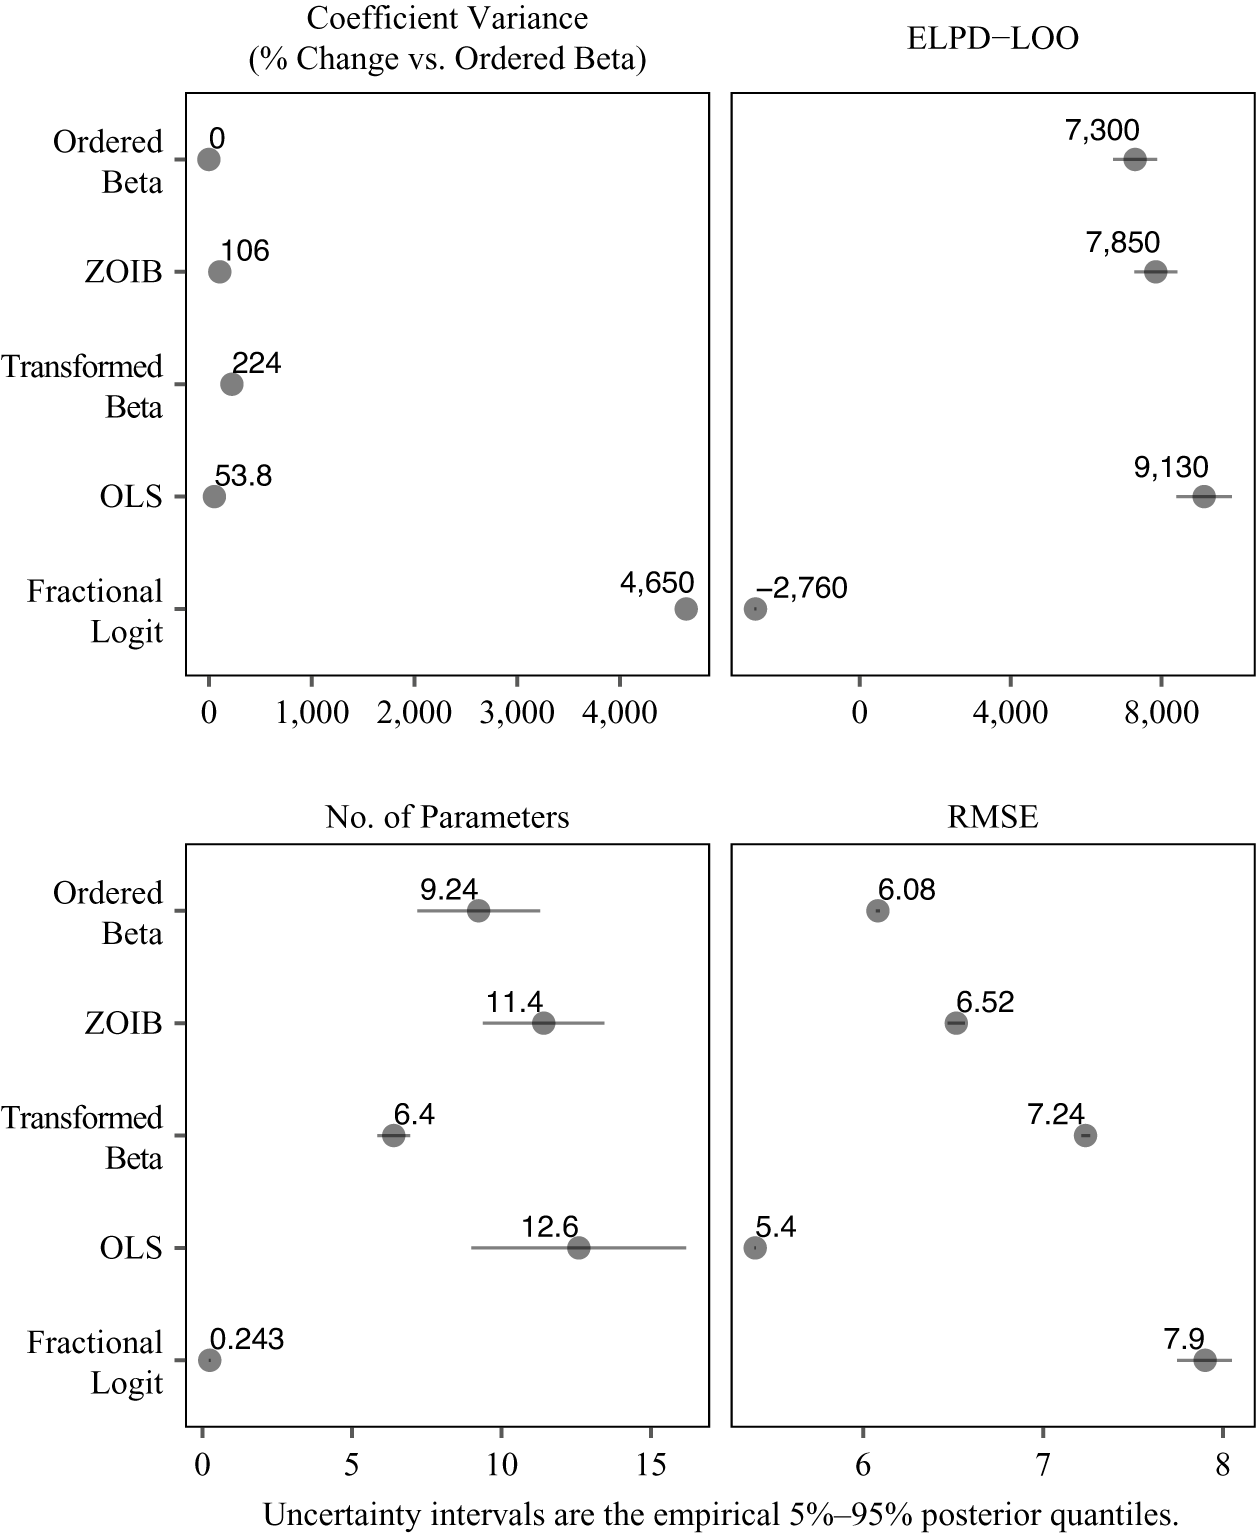
, total marginal effect variance, and the effective number of parameters, which is shown in Figure 4. It should be noted that the QR decomposition affected the number of parameters calculation, deflating the total number, especially for the ZOIB. Nonetheless, the ordered beta regression model is still noticeably less complex, and estimates marginal effects with remarkably higher precision. Only the Beta regression model on transformed values has higher precision, and as I explain later, this is most likely a sign of model misfit rather than an actual increase in information.
Comparison of model diagnostics for replication of Aidt and Jensen (Reference Aidt and Jensen2014).

Interestingly, OLS has superior performance over other models in terms of
 $\hat {elpd}_{psis_loo}$
, and RMSE, which is likely due to the prevalence of continuous values (in the (0,1) interval) in the outcome. As the proportion of degenerate responses increases, OLS will perform less well on these metrics. The fact that OLS can perform well while still being the “wrong” model shows the limitation in solely focusing on predictive validity.
On the other hand, we see that ordered Beta regression does quite well in RMSE and
 $\hat {elpd}_{psis_loo}$
, even if not, as well as OLS, while also having noticeably lower effective number of parameters and coefficient (marginal effect) variance. Furthermore, we know from the simulation that this superior performance will hold across very different distributions with more or less degenerate versus continuous responses.
It should be noted here and later that the fractional logit underperformed. This is most likely due to the prevalence of continuous responses; fractional logit is derived from the binomial distribution and so it will usually perform better when the responses are at the extremes rather than in the middle of the distribution. The peculiarly low effective number of parameters for fractional logit and the transformed Beta regression, combined with the models’ higher variance and poor predictive performance, suggests that these ad hoc approaches do not compare with Beta regression variants that directly model the unique features of bounded distributions.
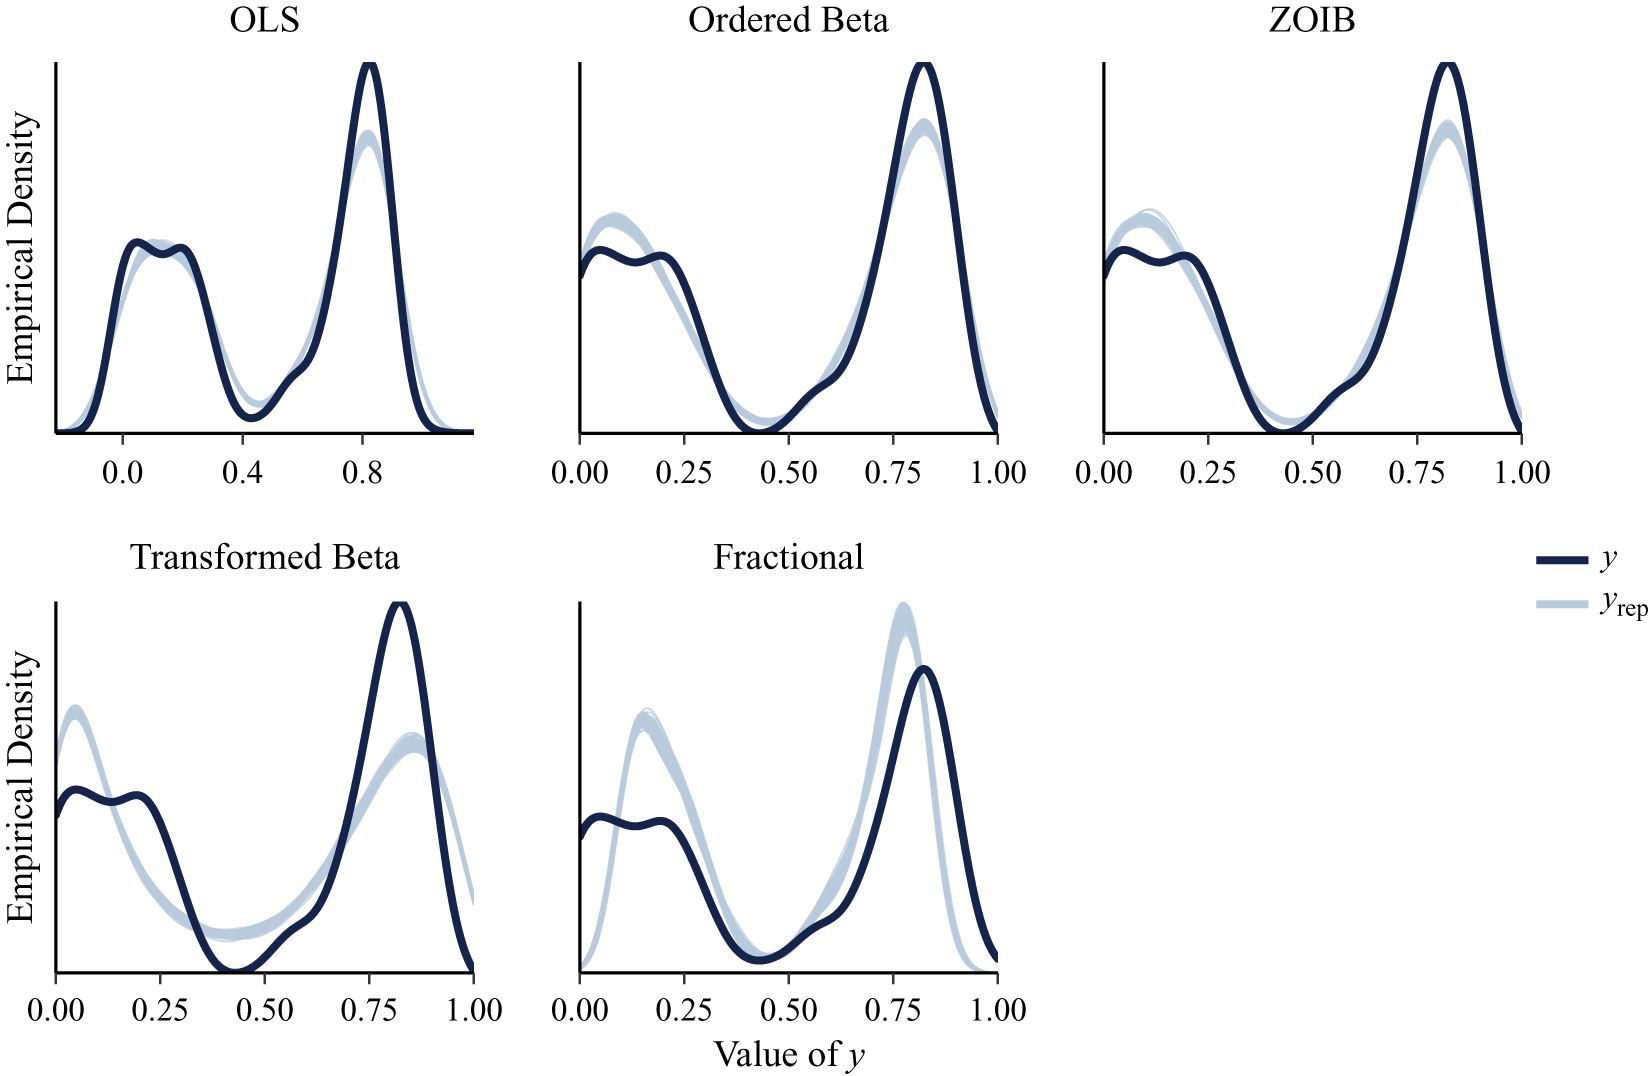
Figure 5 shows draws of the posterior predictive distribution in gray with the empirical (true) distribution in blue. OLS is the only one of the models considered that predicts outside of [0,1]. In general, it would seem that OLS, ZOIB, and ordered beta regression have the best overall fit to the distribution (so long as OLS’s out-of-sample predictions are ignored). OLS fits the lower continuous mode better, whereas ZOIB and ordered beta fit the higher mode more closely. The fractional logit tends to overemphasize the degenerate responses and underemphasize the continuous responses, whereas the transformed Beta plot reveals that the transformation does induce serious model misfit.
Comparison of sample to posterior empirical cumulative distribution for models.

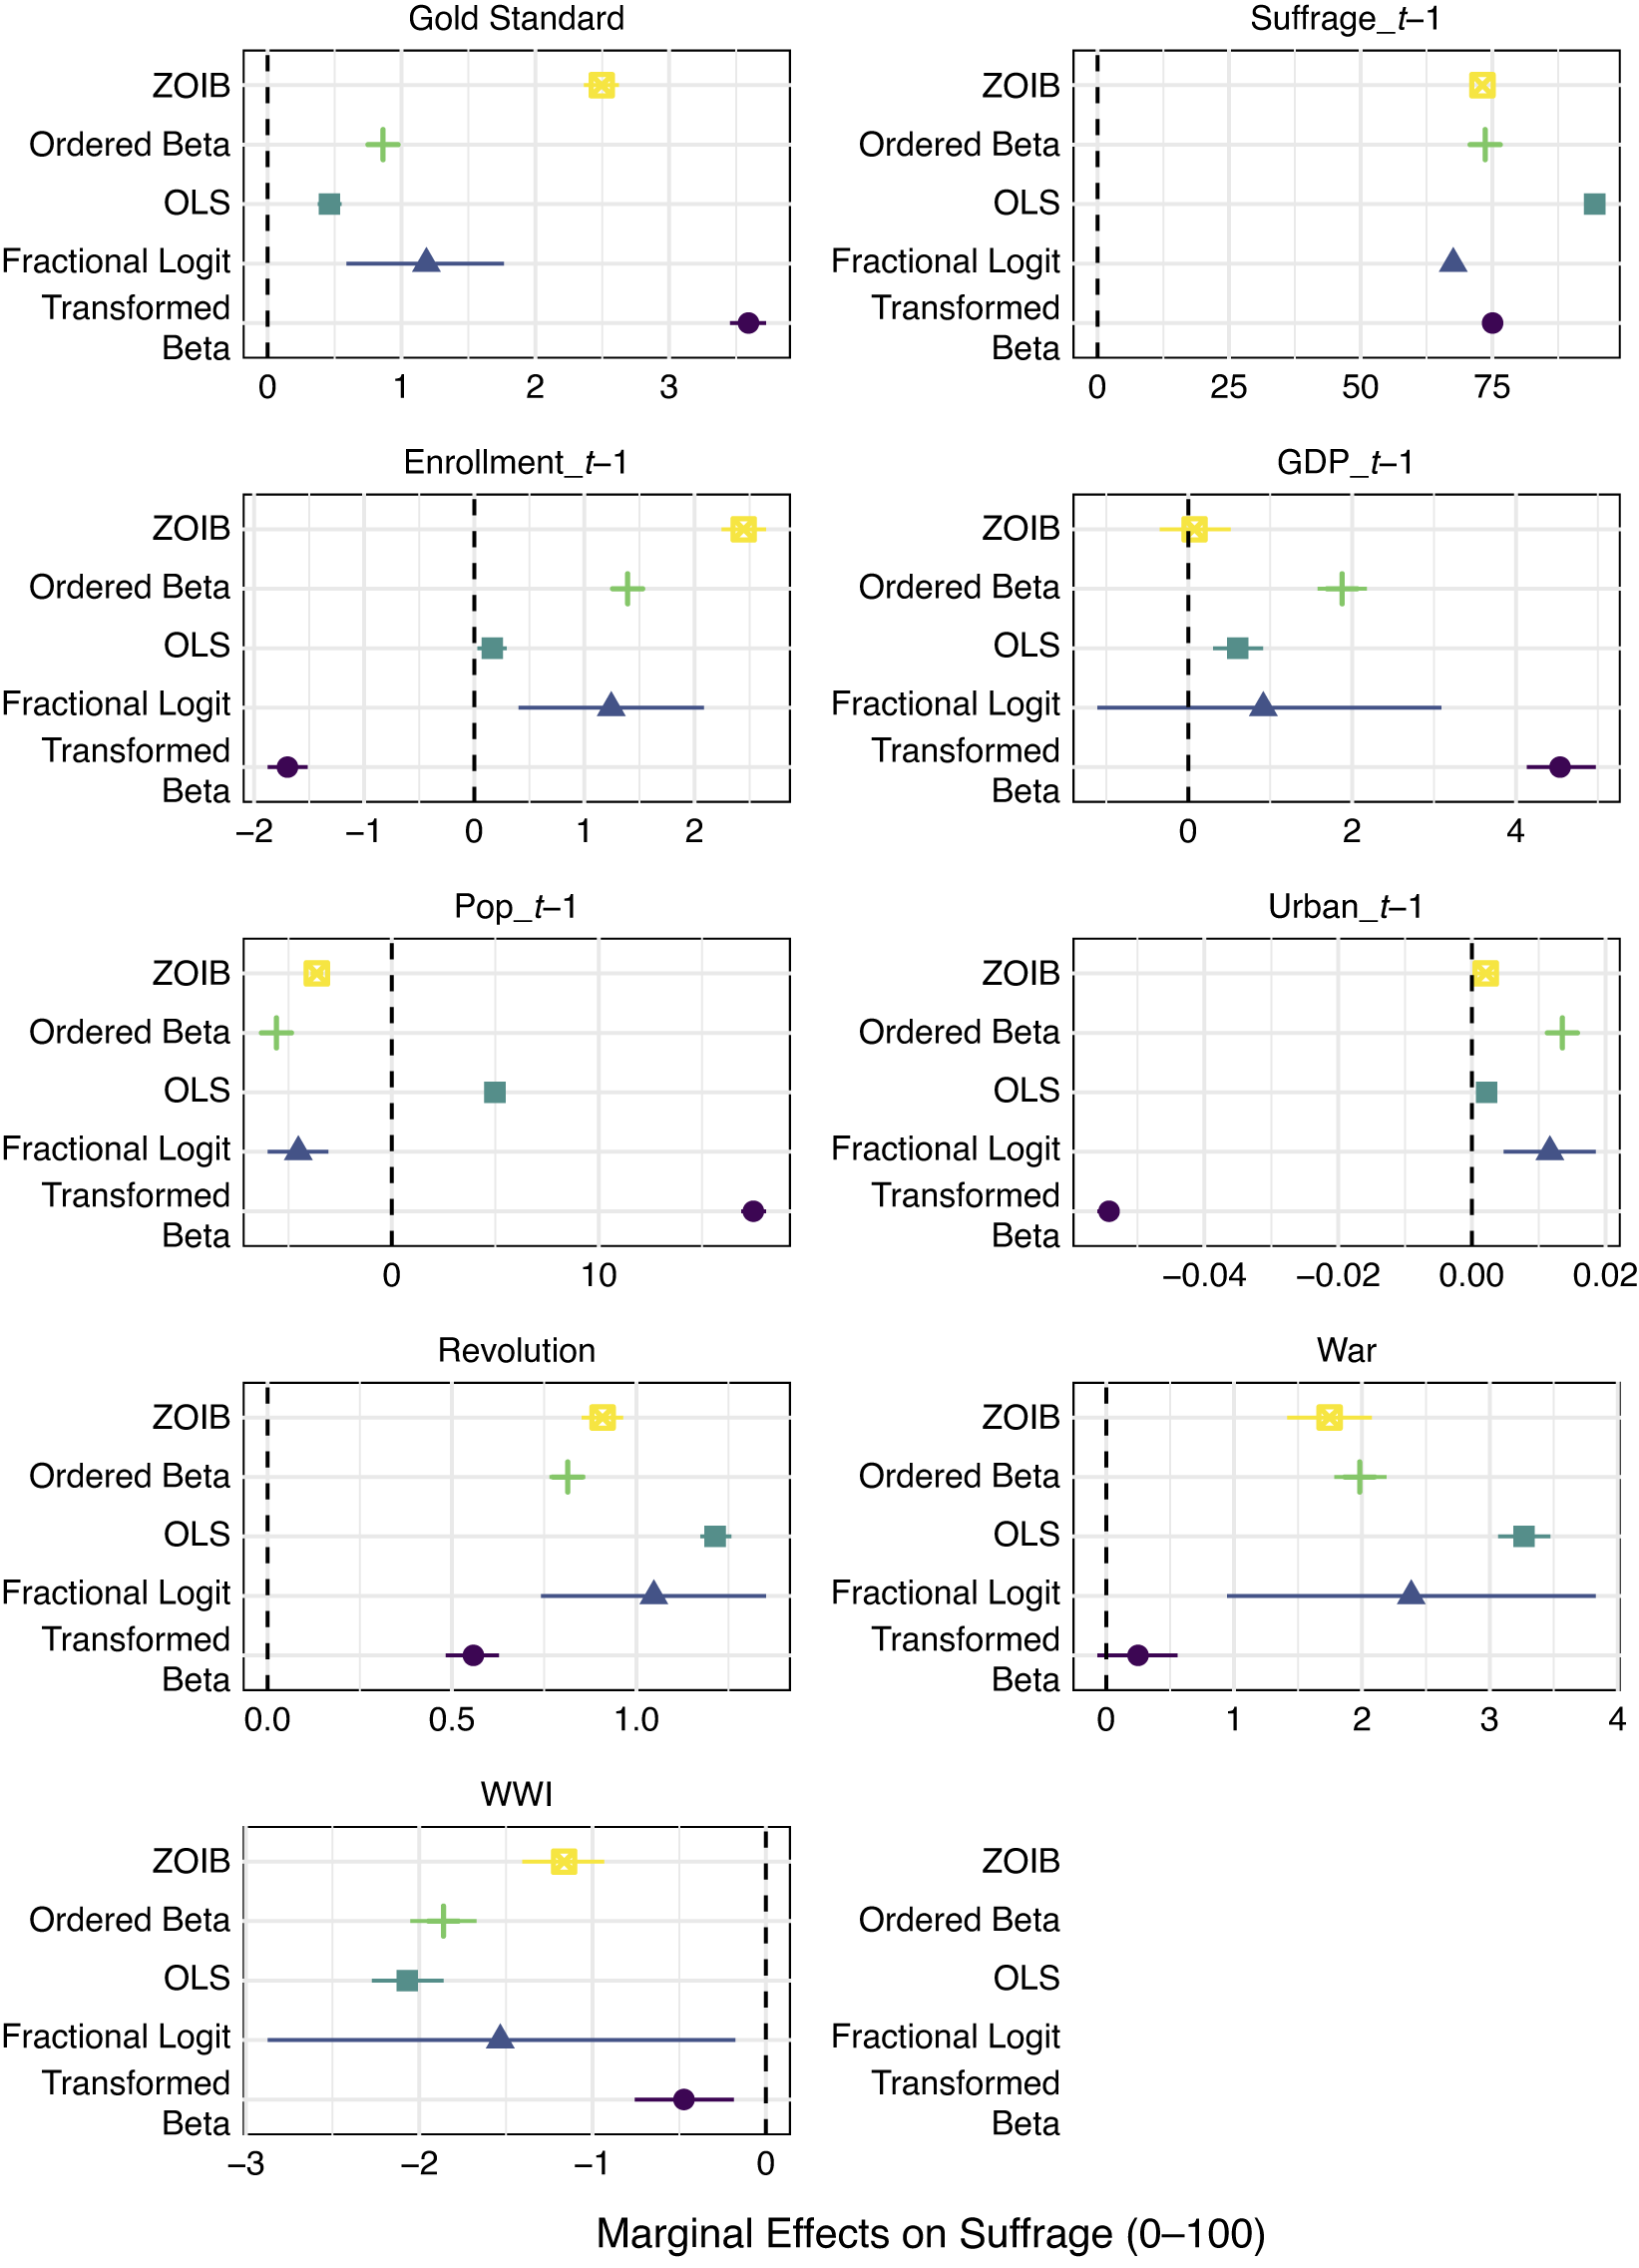
I next compare estimated sample average marginal effects from each model in Figure 6. For some covariates, such as Revolution (whether a neighboring country experienced a democratic revolution), the estimates are of the same sign, though not necessarily the same magnitude. In other cases, such as
 $\text {Population}_{t-1}$
, OLS and the ZOIB/ordered beta regression estimates have opposite signs, and for gross domestic product (GDP),
 $\text {GDP}_{t-1}$
, ordered beta regression shows a strongly positive effect, whereas the ZOIB shows an estimated effect of zero. However, generally speaking, the two models have coefficients that are of the same sign, although the magnitude can vary significantly.
Estimated marginal effects of Aidt and Jensen (Reference Aidt and Jensen2014) covariates on suffrage index (0–100).

The heterogeneity in the transformed Beta regression estimates is another worrying sign that nudging the degenerate responses has a very strong implication for inference. The marginal effects for this model vary quite significantly from ordered Beta regression and the ZOIB even though these latter two specifications also incorporate the Beta distribution. Because the data transformation depends on N, the minimum allowed value for the outcome in this case is 0.0000082, whereas the maximum value is 0.9999918. As such, this seemingly minute transformation will have strong consequences on the estimation of the Beta regression as it takes into account these very unlikely observations. The fact that the variance is less than half that of ordered beta regression is another concerning sign that the data transformation may also lead to an inflation of certainty in the results.
While it can be difficult to identify differences in uncertainty intervals visually, Figure 4 shows that the total variance in estimated marginal effects is much lower for ordered beta regression than for the ZOIB and OLS. While in this particular estimation the amount of uncertainty did not impede inference across models due to the size of the data, the ability of ordered beta regression to capture both the peculiar features of the distribution and precise marginal effects over the entire distribution is a clear advantage. As was shown in Figure 1, ordered beta regression is likely to require a smaller sample size to detect an effect relative to alternatives.
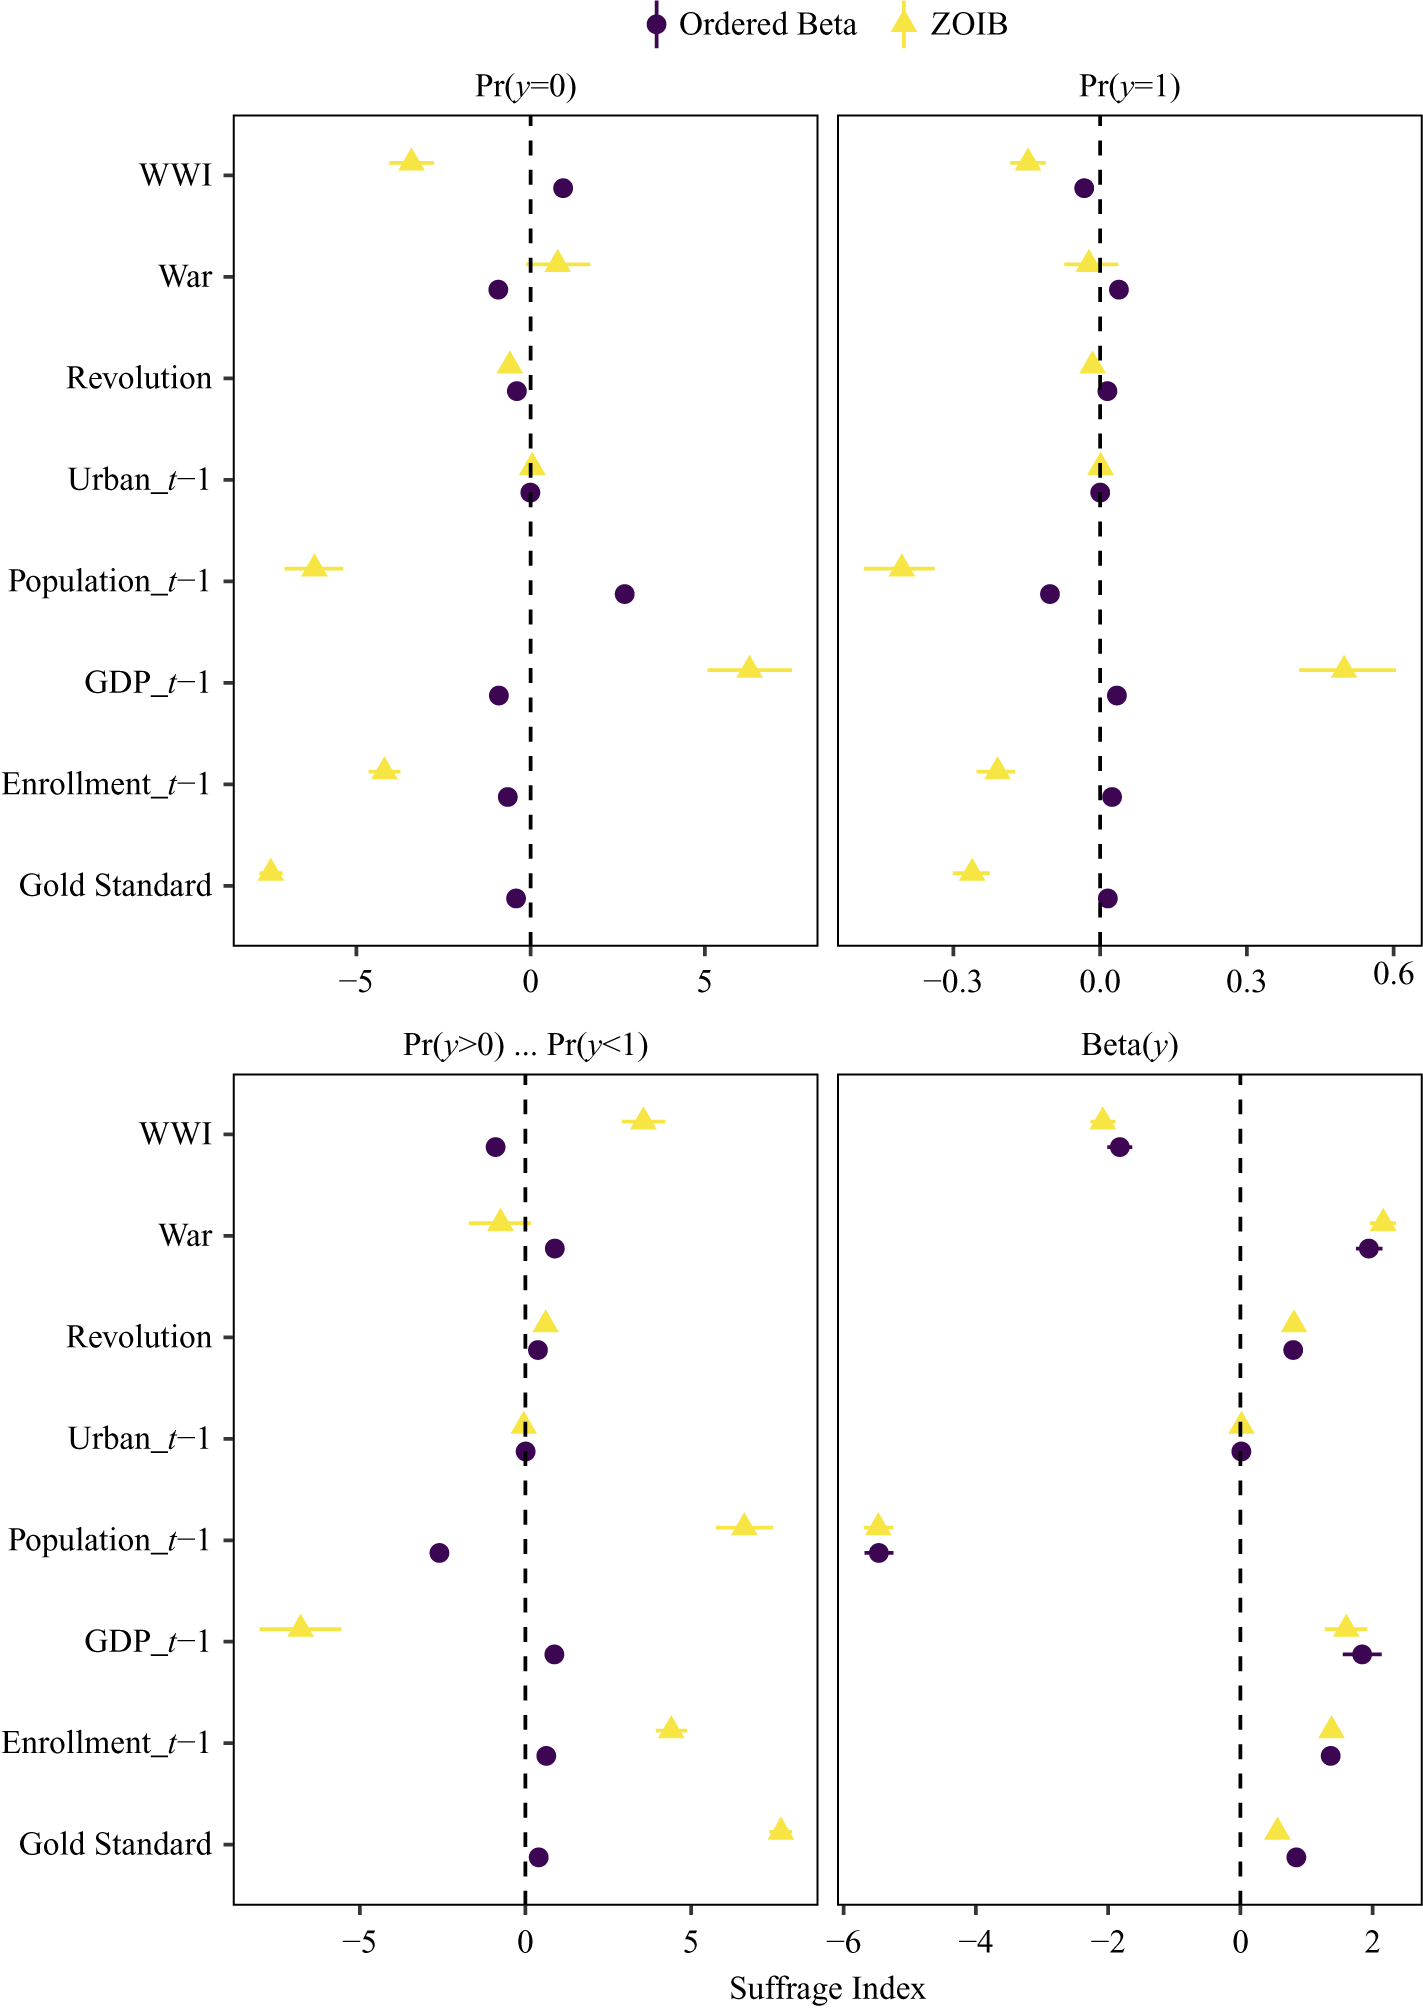
Finally, Figure 7 disaggregates the estimated effects for ordered beta and the ZOIB to make it clear why the models in some cases diverge. To do so, I calculate the marginal effect of covariates on the probability of the three possible outcome types separately (i.e.,
 $Pr(y=1)$
,
 $Pr(y=0),$
and
 $Pr(y>0) \cap Pr(y<1)$
). I also include the marginal effect of the covariate on the Beta density of y.
Comparison of intermediate probabilities for ordered beta regression and ZOIB.

First, it should be noted that the disparities do not arise from the underlying Beta regression. In all cases, the estimated marginal effects from the Beta regression are similar for both the ZOIB and ordered beta. Rather, the dissimilarities arise from the effect of the covariates on the probability of degenerate versus continuous responses. If a covariate has a positive effect in the ordered beta regression model, then by necessity,
 $Pr(y=0)$
will decrease, and
 $Pr(y=1)$
and
 ${Pr(y>0) \cap Pr(y<1)}$
will increase, though not necessarily in equal proportions. This pattern can be seen for the ordered beta regression results: although the marginal effects for
 $Pr(y=1)$
are smaller due to its rarity as an outcome, they are always the opposite sign of the
 $Pr(y=0)$
effects.
By contrast, for the ZOIB, marginal effects can have independent influences on these three probabilities. This pattern can be seen for the
 $\text {GDP}_{t-1}$
covariate. The ZOIB estimates that rising GDP will increase the probability of zero suffrage (
 $Pr(y=0)$
), and increase the probability of full suffrage (
 $Pr(y=1)$
), while simultaneously reducing the probability of intermediate suffrage (
 $Pr(y>0) \cap Pr(y<1)$
) and increasing the value of intermediate suffrage conditional on intermediate suffrage being reached (
 $\text {Beta}(y)$
). The ordered beta regression model, by contrast, estimates that rising GDP is associated with a lower chance of zero suffrage, rising probability of intermediate and high suffrage, as well as a higher value of intermediate suffrage. This latter set of associations seems to follow more logically from the definition of the outcome as a single scale of democratic inclusion.
It is of course possible that the ZOIB and ordered beta regression produce the same interpretation. The Revolution covariate, which has a similar aggregate effect in Figure 6, likewise has similar disaggregated effects across outcome types in Figure 7, revealing that the two models can overlap if the ZOIB meets the ordered Beta model’s assumptions. In summary, both the ZOIB and the ordered beta model treat the degenerate responses as qualitatively different, but the ZOIB goes as far as allowing them to be completely independent processes, which can have confusing implications for inference when the scale is a single construct. By allowing for limited heterogeneity in the bounded outcome, ordered beta regression can estimate a single marginal effect across the entire distribution, which corresponds more closely to the desired interpretation in this study and many others with a single measured construct.
6 Discussion
Given these discrepancies between the ZOIB and the ordered beta regression, I consider in this section when the ZOIB should be employed. To do so, I return to the zero-or-one model addressed earlier (Ospina and Ferrari Reference Ospina and Ferrari2012). While I did not consider this model because it does not produce a defined marginal effect over the full distribution, it may also be more widely applicable than the ZOIB. In the empirical example presented, a zero-or-one model could be used if the value of zero suffrage was treated as a different regime type (i.e., dictatorship) rather than a continuation of the latent measure. This parameterization would follow from the idea of a selection model in which cases must first select into continuous responses.
The ZOIB could then be understood as an even more specific case of the zero-or-one model in which selection could occur at both ends of the response. That is, units could begin in one category (0), proceed through a continuous process (0,1), and then end in a separate category (1). While this type of situation can certainly occur, it is a more specific process than selection at only one end of the scale as the zero-or-one model proposes.
As such, while the ZOIB and ordered beta regression can fit a [0,1] distribution accurately, and can even return similar marginal effects, they make quite different statements about how degenerate responses are produced. The ordered beta model considers all of the response to be generated by a single latent process, which permits more precise estimation and also a clear interpretation about what the underlying components of the parameters mean. If a scholar is looking to model a single bounded continuous scale, ordered beta regression should provide a reasonable fit to the data and meaningful covariate estimates.
7 Conclusion
This paper presented a new model for bounded continuous distributions with considerable observations on the bounds. This paper builds on prior models in the literature incorporating the Beta distribution, which has admirable properties for evaluating the unique features of bounded data. The extension of Beta regression to cover degenerate responses at the bounds is made possible by employing cut points that permit the 0 and 1 values to be jointly estimated with the Beta distribution. Compared to existing approaches, particularly ZOIB and OLS, ordered Beta regression is able to capture a more precise and interpretable marginal effect of a given covariate on the outcome over the full response range.
Acknowledgment
I thank Adam Slez, Stijn Masschelein, Jonas Kristoffer Lindeløv, Matti Vuorre, and anonymous reviewers for helpful comments.
Data Availability Statement
Replication code for this article is available in Kubinec (Reference Kubinec2022) at https://doi.org/10.7910/DVN/5XYO7O. For a reproducible version of this paper, please see the GitHub repository at https://github.com/saudiwin/ordbetareg. The R package ordbetareg, available on CRAN, includes a full range of model specifications for ordered beta regression, including multilevel/hierarchical models.
Supplementary Material
For supplementary material accompanying this paper, please visit 10.1017/pan.2022.20.