

Introduction
Worldwide, fruit flies of the dipteran family Tephritidae are key pests of several fruit crops, including mango. The majority of tropical tephritid pest species are polyphagous, and their feeding results in substantial yield and quality losses (Ekesi et al., Reference Ekesi, Nderitu and Rwomushana2006). In much of Africa, potential income from the production, processing and export of fruit is not realised because of the production losses caused by fruit fly infestation. Additionally, fruit flies are quarantine pests, and thus constrain the contribution of the horticulture subsector to regional and international trade volumes (Ekesi et al., Reference Ekesi, Nderitu and Rwomushana2006). Mango is a key horticultural crop that is consumed either directly or processed into juices, fruit concentrates and other value-added products. Global value in export is estimated at US$1.03 billion, with the Economic Community of West African States (ECOWAS) contributing a 4.1% share of the total world exports, while Egypt contributed 3.2% and Kenya 1.5% (ITC, 2011). About two million tonnes of mango are produced annually in Africa; however, between 30 and 50% are lost to fruit flies (Ekesi et al., Reference Ekesi, Nderitu and Rwomushana2006; Goergen et al., Reference Goergen, Vayssières, Gnanvossou and Tindo2011). It is, therefore, imperative that fruit fly management strategies are implemented to realise the potential of incomes from trade in horticultural produce/products.
A key requirement in the sustainable management of insect pests is correct identification of the pestiferous species, their distribution and seasonality (Jang et al., Reference Jang, McInnis, Vargas and Mau2003). Such information guides the selection and implementation of appropriate pest control strategies. To support the development of a robust fruit fly management programme in Uganda, and to complement efforts in other countries of East Africa, it is prudent that the fruit fly fauna in Uganda is described. In East Africa, specifically Kenya and Tanzania, the fruit fly fauna has been well described (Ekesi et al., Reference Ekesi, Nderitu and Rwomushana2006; Mwatawala et al., Reference Mwatawala, De Meyer, Makundi and Maerere2006a, Reference Mwatawala, De Meyer, Makundi and Maerereb; Rwomushana et al., Reference Rwomushana, Ekesi, Ogol and Gordon2008; Mwatawala et al., Reference Mwatawala, De Meyer, Makundi and Maerere2009; Geurts et al., Reference Geurts, Mwatawala and De Meyer2012), but less so for Uganda, where two studies have described the fruit fly fauna in the country (Nakasinga, Reference Nakasinga2002) but were very limited in geographical scope. The Ugandan studies recorded Ceratitis species as the most pestiferous fruit flies.
The genus Ceratitis MacLeay is endemic to Africa, and Bactrocera spp. are known to occur, having invaded Uganda following their introduction into East Africa from Asia during the 1990s (Drew et al., Reference Drew, Tsuruta and White2005). There is no knowledge of the existence of other species in Uganda. This study was, thus, set out to (1) identify some of the fruit fly species present in selected mango orchards in Uganda and (2) investigate whether community structure of the fruit fly populations is similar across the three agroecological zones (AEZs) that are key mango production areas, but are also ecologically disparate with respect to rainfall patterns and farming system attributes.
Materials and methods
Study area
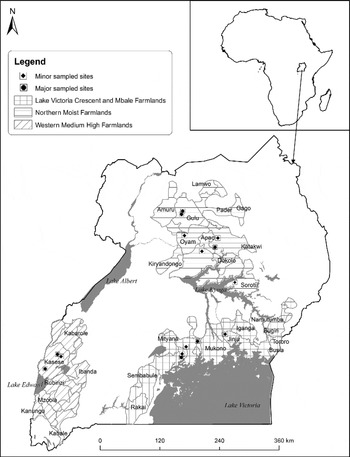
The study was conducted in the three AEZs: the Western Medium High Farmlands (WMHF), the Lake Victoria Crescent and Mbale Farmlands (LVC) and the Northern Moist Farmlands (NMF) (Wortmann and Eledu, Reference Wortmann and Eledu1999). These three zones represent the major mango fruit-growing regions in Uganda (Fig. 1).
Location of the three agroecological zones and the sites sampled for fruit flies in Uganda.

Description of the AEZs
LVC
This zone encompasses areas along Lake Victoria that range in altitude from 1100 to 1400 m above sea level (masl). Temperatures are relatively stable and range between 18–28°C. Rainfall is bimodal (rainy seasons in March–May and October–December), is evenly distributed and ranges between 700 and 2100 mm annually. Banana and coffee are the main crops that are often intercropped with root crops (sweet potato, cassava), vegetables and fruits. Crops are commonly grown as polycultures on plots less than 1 ha.
NMF
This area in northern Uganda ranges in altitude between 1000 and 1524 masl, with a temperature range of 15–32.5°C. Rainfall is largely unimodal (rainy season in April–September) and ranges between 700 and 1700 mm annually. The area is dominated by annual crops, mainly cotton, cereals and cassava, that are usually grown as monocultures. Fruit growing in this region tends to be concentrated in particular areas and is not dispersed as in the other two AEZs.
WMHF
This area, located in western Uganda along the Congo border, has an average altitude of 1235 masl with a range of 600–4500 masl. Rainfall is bimodal (rainy seasons in March–May and August–November), with some parts of the area – especially in the mountain areas – receiving more than 2250 mm of rain annually while the lowlands receive about 1200 mm as mean annual rainfall. Temperature ranges between 17 and 29°C. Crops are commonly grown as polycultures, and include bananas, coffee, cotton, beans, maize and a variety of vegetables, fruit and root crops. Cash crops (cotton, banana, coffee and mango), however, are often grown as monocultures on plots of one or more hectares.
Fruit fly sampling
Fruit flies were trapped using Lynfield traps baited with species-specific lures, and DDVP (2,2-dichlorovinyl dimethyl phosphate) insecticidal strips to immobilize trapped flies. Trapping focused on fruit-infesting species, mainly Ceratitidinae fruit flies (such as Ceratitis and Trirhithrum) and the Dacinae fauna (such as Bactrocera spp.). Since specific fruit fly species are attracted to different lures (White, Reference White2006), a variety of lures were used at all sampling sites to obtain a more comprehensive indication of the fruit fly diversity in the three AEZs. Trimedlure was used to attract members of the genus Ceratitis sub-genera Ceratitis and Pterandus; methyl eugenol was used to attract B. invadens and members of the genus Ceratitis subgenus Pardalaspis; cuelure was used to attract members of Dacus and Bactrocera cucurbitae; torula yeast protein bait, which is less specific than the other lures, was also used to attract other fruit flies.
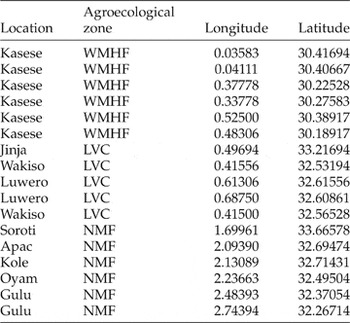
Trapping was conducted over a period of 24 months (September 2010 to September 2012) across the three AEZs. In each AEZ, three orchards or areas with substantial mango growing and other potential hosts were selected as sampling sites (GPS coordinates of these sites are presented in Table 1).
Districts sampled for fruit flies in the three agroecological zones: Western Medium High Farmlands (WMHF), Northern Moist Farmlands (NMF) and Lake Victoria Crescent and Mbale Farmlands (LVC)

The three orchards in the WMHF and the NMF were all commercial stands of mangoes, mainly Tommy Atkins, Kent, Apple mango, Zillate, Dodo, Biire and Keitt. On an average, the trees were about 8 years old. The orchards were not surrounded by many alternative fruit hosts or other crops. The mango orchards in the LVC were dominated by Tommy Atkins, Boribo, Kent, Kate, Apple mango, Florigon, Zillate, Red dodo, Glenn, Biire and Kagogwa. The orchards in the LVC were intercropped with several other crops including passion fruit, avocado, banana, pawpaw, guava and coffee.
In each orchard, three mature fruiting mango trees were randomly selected. On each tree, four parapheromone traps, each fitted with one lure type, and a fifth trap with the protein bait were hung at a height of approximately 2 m. The traps were emptied every 2 weeks and the lures and strips replaced every 8 weeks. The protein bait was replaced once a week. The traps were rotated weekly using the same trees to compensate for possible errors due to specific trap location. The set-up of the experiment followed a randomized complete block design with trap catches as the response variable, the AEZs as blocks and the lures as treatments (Mayamba et al., Reference Mayamba, Nankinga, Isabirye and Akol2014).
Trapped fruit flies from each trap were placed into separate vials containing 90% alcohol for preservation, labelled and transported to the National Agricultural Research Laboratories (NARL), Kawanda, Uganda, for identification and counting. Identification was done using recent systematic keys (De Meyer, Reference De Meyer1998; De Meyer, Reference De Meyer2000; White and De Meyer, Reference White and De Meyer2000; White, et al., Reference White, Copeland and Hancock2003; White, Reference White2006), and confirmation of the identification was done at the Royal Museum for Central Africa, Tervuren, Belgium. Voucher specimens were kept in collections at NARL, Makerere University Zoology Museum, Uganda, and the Royal Museum for Central Africa-Tervuren, Belgium. The number of flies trapped per fortnight per orchard was recorded.
Data analysis
Data from the four lure traps and the protein bait were pooled to obtain total fruit fly diversity per AEZ per month. For each AEZ, species richness and abundance were calculated. Biodiversity R (Kindt and Coe, Reference Kindt and Coe2005) and PAST (Hammer et al., Reference Hammer, Harper and Ryan2001) were used to calculate diversity indices: species richness, evenness and dominance. Species accumulation curves, which plot the cumulative number of species (S) as a function of sampling effort (Magurran, Reference Magurran2004), were obtained for each zone. The Bray–Curtis similarity index (Hammer et al., Reference Hammer, Harper and Ryan2001) was used to compare the similarities among zones and to construct a dendrogram of species composition similarity for the three zones. Beta diversity (between-habitats diversity) between the AEZs was estimated using Whittaker, Cody and Wilson–Shmida β-diversity estimators. Renyi's equitability curves were drawn to depict and compare faunal equitability levels.
Trap catches, point diversity and equitability indices were tested for normality using Shapiro–Wilk test, and the strongly skewed variables were transformed prior to analyses (if necessary) to meet the assumption of normality and homogeneity of variances. Variables presented as percentages were arcsine square root (+0.5) transformed, while the number of species or counts of individuals were log (log(x+1)) transformed. Where transformation was not sufficient to improve data shape, an appropriate non-parametric test was applied. The differences in fruit fly individuals and species, evenness and diversity among the three zones were tested using general linear model (GLM) analysis of variance (ANOVA) in R (R Development Core Team, 2008). Where the GLM test indicated significant differences, post-hoc Tukey's honest significant difference (HSD) test was used.
Discriminant analysis using ade4 software (Dray and Dufour, Reference Dray and Dufour2007) was used to determine whether zones differed significantly in species patterns and to visualize the zones on a two-dimensional map (Thioulouse et al., Reference Thioulouse, Chessel, Dolédec and Olivier1997). Subsequently, community structure was assessed using analysis of similarities (ANOSIMs) for test of significant difference between the three zones. Pair-wise post-hoc ANOSIMs between all pairs of zones and overall multi-group were computed using Bray–Curtis Similarity Percentage (SIMPER) (Hammer et al., Reference Hammer, Harper and Ryan2001). To assess species displacement levels, the abundance (log10) was plotted against species ranks and tested for conformity to the theoretical distribution curves using the χ2 test.
Results
Fruit fly community composition across the AEZs
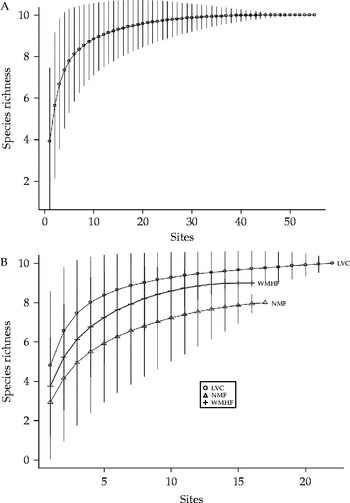
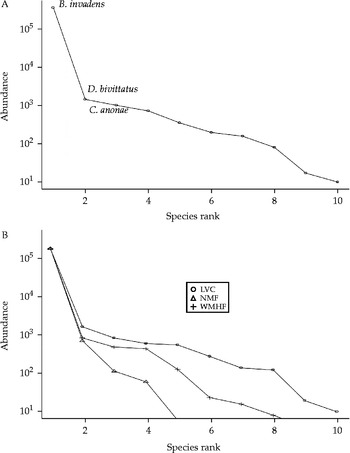
The flat species accumulation curves (Fig. 2A and B) show that sampling effort in the three zones was adequate to recover most fruit fly species. Over the 24 months of sampling period, 368,332 individuals were collected. The individuals belonged to 10 species in four genera: Bactrocera, Ceratitis, Trirhithrum and Dacus. Bactrocera invadens accounted for 98.9% of the collection, while the second and third most common species (Dacus bivittatus and Ceratitis anonae) represented 0.4 and 0.3%, respectively. The remaining fruit fly species constituted less than 0.4% of the total catch. The rank abundance curve indicated a situation where other fruit fly species were being displaced by B. invadens (Fig. 3A and B). Beta diversity between zones was relatively high: 1.5463, 80.5 and 20.498, respectively. However, within a given zone, there was low β-diversity as fruit fly diversity was less differentiated among orchards or places of sampling.
Fruit fly species accumulation curves for all samples (A) and for the three agroecological zones (B). The bars on the accumulation curves indicate +2 and − 2 standard deviations. LVC: Lake Victoria Crescent and Mbale Farmlands; NMF: Northern Moist Farmland; WMHF: Western Medium High Farmlands. Sites on the x-axis refer to sampling effort.

The rank abundance (loglinear scale) curves for fruit fly species across zones (A) and in each zone (B): the Lake Victoria Crescent and Mbale Farmlands (LVC), the Northern Moist Farmlands (NMF) and the Western Medium High Farmlands (WMHF).

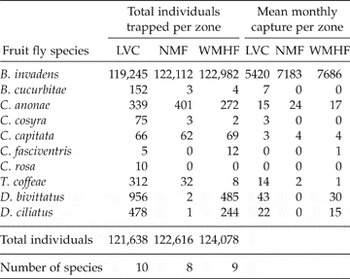
The LVC was the most species-rich area (10 species) while the NMF was the least species-rich area (8 species) (Table 2). The maximum species richness estimated by Chao, Jackknife and bootstrap richness estimators for the whole study area was 11 species. The bootstrap estimation of richness per zone was 9–10 species for the NMF and the WMHF zones and 10 for the LVC zone (Fig. 3A). Bactrocera invadens was the most dominant species in each one of the three zones while the second and third most dominant species were variable among the zones (Table 2). The second and third most abundant species were D. bivittatus and D. ciliatus in the LVC, C. anonae and C. capitata in the NMF and D. bivittatus and C. anonae in the WMHF, respectively. Species richness for the LVC was significantly different (P< 0.01) from the other two zones whose difference in richness was not statistically significant (P>0.05).
Number of fruit fly species collected at different sites in the three different agroecological zones in Uganda

LVC, Lake Victoria Crescent and Mbale Farmlands; NMF, Northern Moist Farmlands; WMHF, Western Medium High Farmlands.
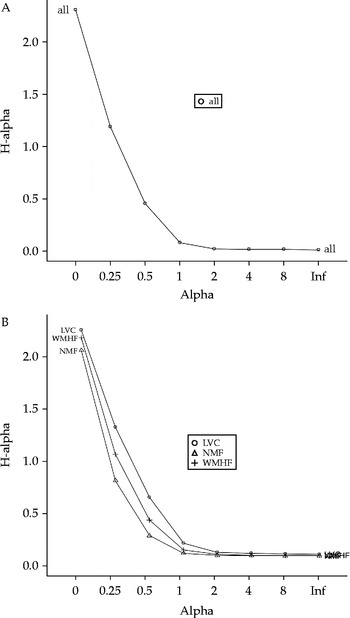
Fruit fly catches per month varied significantly across the three zones (P= 0.000), with the highest being in the WMHF (7755 individuals per month), and the least recorded in the LVC (5529 individuals per month) (Table 2). The Lake Victoria Crescent zone had the most diverse fruit fly population (H′ = 0.129), followed by the WMHF (H′ = 0.062), and the least was in the NMF (H′ = 0.030) ( $$X _{3}^{2} = 0.828, $$P>0.05). The NMF had the highest evenness of fruit flies (12.9%), followed by the WMHF (11.8%) and then the LVC (11.4%), although the difference was not significant (P>0.05). Equitability was low (Fig. 4) across the zones because of the dominance of B. invadens in all of them.
Species Renyi's equitability curves for all (A) and individual zones (B): the Lake Victoria Crescent and Mbale Farmlands (LVC), the Northern Moist Farmlands (NMF) and the Western Mid Altitude High Farmlands (WMHF) zones.

Community structure across the AEZs
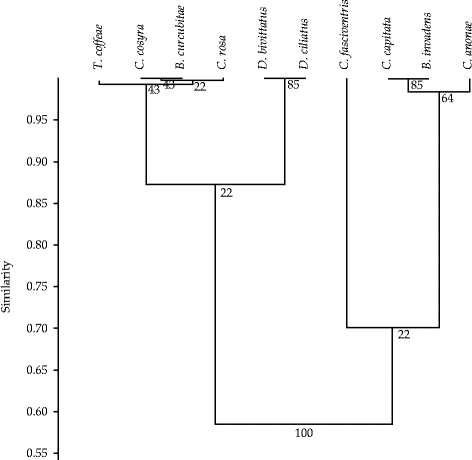
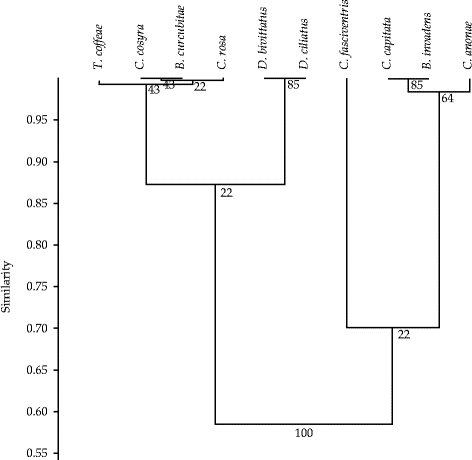
The AEZs were generally similar in composition. The Bray–Curtis similarity index generated two clusters: the first cluster comprised the LVC and the second cluster comprised the NMF and WMHF, with an overall cophenetic correlation or cluster accuracy of 99.99%. The clustering, based on relative abundance and similarity in monthly incidence, consisted of group 1: T. coffeae, C. cosyra, B. cucurbitae, C. rosa, D. bivittatus and D. ciliatus, and group 2: C. capitata, B. invadens, C. anonae and C. fasciventris, with the latter in an individual cluster (Fig. 5).
Bray–Curtis similarities in fruit fly composition among the three agroecological zones in Uganda.
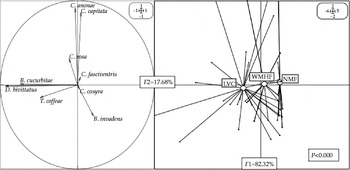
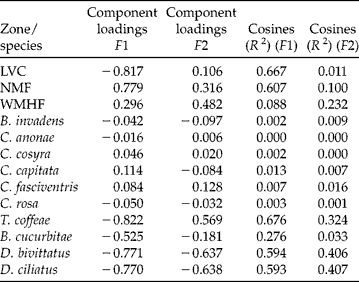
On the basis of their relative dominance and catches (composition) among the three zones, fruit flies yielded significant discrimination of the three AEZs, with significant association (P< 0.000) between particular fruit fly species and zones (Fig. 6). The overall fruit fly AEZ composition discrimination sensitivity and specificity was 69.09% and was significant (P< 0.000). The factor loadings and average means of associations between the AEZs and the various fruit fly species are presented in Table 3.
Discriminant analysis (DA) ordination graphs for the agroecological zones and fruit fly diversity. The zones are as follows: the Lake Victoria Crescent and Mbale Farmlands (LVC), the Northern Moist Farmlands (NMF) and the Western Mid-Altitude High Farmlands (WMHF) based on fruit fly abundance.

Discriminant component loadings showing the barycenter (weighted average) of the three zones, fruit fly distribution (weighted averages of site scores) and squared cosines of the zones and site scores in the two most important components
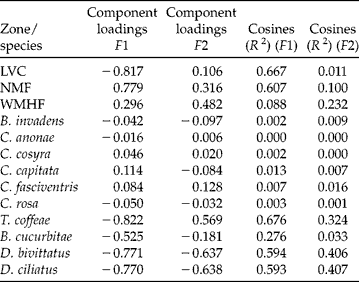
LVC, Lake Victoria Crescent and Mbale Farmlands; NMF, Northern Moist Farmlands; WMHF, Western Medium High Farmlands.
Dacus ciliatus, T. coffeae, D. bivittatus and B. cucurbitae were more associated with the LVC than with the other two zones. The WMHF and the NMF zones were not particularly affiliated with any of the rest of the species. Bactrocera invadens was not particularly affiliated with any AEZ or any of the other fruit fly species. Although the WMHF recorded relatively more Ceratitis FAR complex species (C. fasciventris, C. anonae and C. rosa) and C. capitata, there was no significant association of these species with a particular zone. The squared cosines score showed that Factor 1 was significantly loaded with LVC and NMF with coefficients of determination of 66.7 and 60.7%, respectively. Similarly Factor 1 differentiated the LVC and NMF mainly on the basis of T. coffeae (67.6%), B. cucurbitae (27.6%), D. bivittatus (59.4%) and D. ciliatus (59.3%). On the contrary, Factor 2 was significantly loaded with the WMHF with a coefficient of determination of 23.2%. Although relatively less, the component was also associated with D. bivittatus (40.6%) and D. ciliatus (40.7%), confirming that these two are generalist species like B. invadens. Ceratitis anonae and C. capitata always occurred in similar proportions in a zone, but appeared to be less in sites with higher B. invadens composition.
Multivariate analysis of community structure among the three zones showed significant zonal differences (ANOSIM, R= 0.095, P= 0.01). Pair-wise post hoc comparisons between all pairs of zones showed that LVC was significantly different from the NMF (P= 0.003), but not with the WMHF (P>0.05). An overall multi-group Bray–Curtis SIMPER assessment of the species primarily responsible for the observed difference among zones showed a 54.7% average dissimilarity among zones. Ceratitis rosa contributed the highest difference in zonal structure, followed by C. fasciventris and C. cosyra (Table 3).
Displacement of native fruit fly species by B. invadens
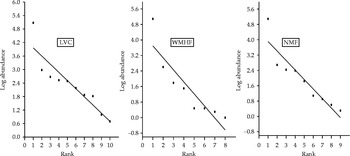
The rank abundance curves in Fig. 7 show conformity of the curves to a geometric series distribution of the fruit fly species in the three zones. The overwhelming dominance (98.1%) of B. invadens over the rest of the fruit fly fauna was indicative of displacement of other fruit fly species by B. invadens.
The rank-log abundance graphs showing the conformity to the geometric series distribution of fruit flies in the three zones: the Lake Victoria Crescent and Mbale Farmlands (LVC), the Northern Moist Farmlands (NMF) and the Western Mid Altitude High Farmlands (WMHF).

Discussion
Fruit fly species in Uganda
The fruit fly fauna from the four genera (Bactrocera, Ceratitis, Trirhithrum and Dacus) found in the selected mango-growing regions in Uganda is similar to that reported under similar ecosystems in Kenya and Tanzania. Except for B. invadens and B. cucurbitae, all the other species encountered in this study are believed to be native to the country. Previous studies by Nakasinga (Reference Nakasinga2002) have indicated Ceratitis spp. as the most prevalent fruit flies in mango; however, it is evident that B. invadens is now the most prevalent species. The study has also revealed that all regions have very high tephritid infestation levels. If B. invadens is excluded from the counts, then the NMF zone has lower infestation levels than the other two zones. These differences may be linked to the ecological characteristics of the zones, particularly the climate and farming systems. Areas surrounding mango orchards in the NMF had fewer alternative hosts for fruit flies, which may also explain why it also had lower species richness, and up to four other species were represented by less than 10 individuals in the 2-year long trapping programme. The results on community structure suggest that the pest status of each genus may differ across geographical regions. This might be explained by differences in host preference for each genus, although we were unable to investigate this during the course of the study. For instance, the majority of the species of the Bactrocera and Dacus genera encountered in this study are well-known economic pests attacking a broad diversity of cucurbit fruits (Mwatawala et al., Reference Mwatawala, De Meyer, Makundi and Maerere2006a; Rwomushana et al., Reference Rwomushana, Ekesi, Ogol and Gordon2008). Therefore, the dominant representation by genus Dacus in the LVC and WMHF is probably due to the presence of cucurbit hosts in the area. Cucurbits are not a common crop in the NMF. The infrequent encounter of the other species that have been hitherto reported (Nakasinga, Reference Nakasinga2002) is probably due to the monophagous nature of their host range among indigenous fruits (Ekesi et al., Reference Ekesi, Nderitu and Rwomushana2006) or due to continued displacement (Mwatawala et al., Reference Mwatawala, De Meyer, Makundi and Maerere2006a; Rwomushana et al., Reference Rwomushana, Ekesi, Ogol and Gordon2008). Hence, the geographical variations observed in our study may be less important since ecological displacement by Bactrocera is taking place.
Differences in zonal fruit fly composition
The relatively high between-habitats diversity (β-diversity) observed in this study was probably the result of both environmental heterogeneity, species niche differentiation (Loreau, Reference Loreau1992) and dispersal limitation processes (Nekola and White, Reference Nekola and White1999). Steiner (Reference Steiner2014) demonstrated that mobility and dispersal processes are important determinants for β-diversity at small and intermediate scales. The distance between orchards and sampling points within an orchard was more or less constant within a zone, although it increased between the AEZs. The large β-diversity at the macroscale compared with the meso- and microscales concurs with the distance decay of similarity hypothesis (Nekola and White, Reference Nekola and White1999). Longer distances between the AEZs than between respective orchards might increase dispersal limitation and might therefore lead to different species pool adapted to local conditions (Steiner, Reference Steiner2014). This study has added to the evidence that insect community composition varies most significantly over broader spatial scales, even when total species richness does not (Steiner, Reference Steiner2014).
Zones differed in farming systems, which could ultimately affect zonal composition (Bengtsson et al., Reference Bengtsson, Ahnström and Weibull2005). In addition, the bimodal nature of rainfall favours all year fruiting of alternative hosts. Due to the polyphagous nature of most of the fruit fly species recorded, it is not surprising that the LVC recorded significantly higher (10 species) diversity compared with the NMF and WMHF. Given the dominance of coffee growing in the LVC, it explains the higher association of the zone with T. coffeae species, whose main host is coffee (Mwatawala et al., Reference Mwatawala, De Meyer, Makundi and Maerere2006a). The NMF has lower and less evenly distributed rainfall in the region and infrequent fruit hosts, hence low diversity (Tscharntke et al., Reference Tscharntke, Steffan-Dewenter, Kruess and Thies2002). The significantly higher (P= 0.000) fruit fly catches of most species recorded per month in the WMHF may perhaps be a consequence of the higher proportions of early and late maturing mango varieties that are grown as mixtures in orchards of the zone and, the conducive bimodal rainfall pattern characteristic of the zone. Vayssières et al. (Reference Vayssières, Korie and Ayegnon2009) advanced that proximity of wild hosts, polycultures of mango varieties and the presence of rain were all factors that favoured fruit fly populations.
Bactrocera invadens dominance over native fruit flies
The geometric series distribution of the fruit fly species recovered in this study describes communities of highly uneven species abundance distribution and low diversity characterized by a few dominant species. It appears that B. invadens is significantly negatively affecting the relative abundance of the native flies and outcompeting and replacing them from their niches in the three AEZs studied.
The dominance by Bactrocera genera observed here has already been widely reported (Mwatawala et al., Reference Mwatawala, White, Maerere, Senkondo and De Meyer2004; Ekesi et al., Reference Ekesi, Nderitu and Rwomushana2006; Mwatawala et al., Reference Mwatawala, De Meyer, Makundi and Maerere2006a, Reference Mwatawala, De Meyer, Makundi and Maerereb). Bactrocera invadens was reported to be displacing indigenous Ceratitis species of mango, constituting up to 98 and 97% of the total population in Kenya (Rwomushana et al., Reference Rwomushana, Ekesi, Ogol and Gordon2008) and Tanzania (Mwatawala et al., Reference Mwatawala, De Meyer, Makundi and Maerere2006a), respectively. The observed dominance in horticulture monocultures has also been demonstrated in West Africa (Vayssières et al., Reference Vayssières, Korie and Ayegnon2009).
Indeed B. invadens showed no significant community discrimination for any particular zone, although the relative abundance varied. The species is currently among the most important pests in Africa. Its polyphagous nature, predominance in certain hosts and rapid spread throughout Africa (Drew et al., Reference Drew, Tsuruta and White2005) make it a devastating pest. Besides being an important pest, it also seems to have an impact on the indigenous fruit fly fauna in commercial fruit produce, as has been detailed here, and in the region (Ekesi et al., Reference Ekesi, Nderitu and Rwomushana2006). Bactrocera invadens displacement of other species has been attributed to competition (Rwomushana et al., Reference Rwomushana, Ekesi, Ogol and Gordon2008), and annual and within-habitat spatial distribution activity (Mwatawala et al., Reference Mwatawala, White, Maerere, Senkondo and De Meyer2004; Drew et al., Reference Drew, Tsuruta and White2005; Mwatawala et al., Reference Mwatawala, De Meyer, Makundi and Maerere2006a, Reference Mwatawala, De Meyer, Makundi and Maerereb; Rwomushana et al., Reference Rwomushana, Ekesi, Ogol and Gordon2008; Nboyine et al., Reference Nboyine, Billah and Afreh-Nuamah2012; Geurts et al., Reference Geurts, Mwatawala and De Meyer2012).
Resource clumping too has been demonstrated to increase competition and displacement of the native species by introduced species (Kiesecker et al., Reference Kiesecker, Blaustein and Miller2001). The latter showed that the presence of B. invadens larvae had strong negative effects on the performance, survivorship and behaviour of native larvae, but the effect of the former on the latter was dependent on whether food resources were clumped or scattered. In this study, B. invadens dominance and niche pressure was highest (99.6%) in the NMF, followed by the WMHF (99.1%) and least in the LVC (98.1%), with the species richness and diversity being in the reverse order. The LVC farming system offers opportunities for resources distribution that avoids resources clumping in the mango orchards. In contrast, the NMF lacks this diversity of host species, and hence poor resources distribution. Consequently, resources-dependent inter-specific competition is highest here and most likely explains the highest displacement probability in the zone (Kiesecker et al., Reference Kiesecker, Blaustein and Miller2001). More work is needed to assess the general importance of landscape level distribution of resources on the effect of the African invader fruit fly on native species.
Conclusion
There are at least 10 tephritid fruit fly species in Uganda; however, B. invadens is the most abundant and widely distributed. This species is also apparently displacing the native fruit fly fauna. Analysis of community composition has shown that zones were significantly differentiated by their faunal composition, which was in turn attributed to the inherent environmental and host composition. There were significant differences in species richness and abundance of fruit flies among the three zones, but not in evenness and diversity of fruit flies across zones. Since B. invadens has devastating economic impacts on the horticulture industry, and particularly mango (Ekesi et al., Reference Ekesi, Nderitu and Rwomushana2006; Rwomushana et al., Reference Rwomushana, Ekesi, Ogol and Gordon2008), we propose that an integrated fruit fly management programme is implemented urgently to contain the very high infestation levels. Such a programme should also control infestations by the other fruit fly species and thereby guard the benefits of the horticulture industry.
Acknowledgements
The authors thank Winifred Agum, Florence Nampeera, William Waswa, Agnes Wenene and Patrick Odyomo for their help with practical and fieldwork, and the mango farmers for their kind cooperation. We thank the Uganda National Council for Science and Technology, through the Millennium Science Initiative for funding Brian E. Isabirye's PhD studies, of which this paper is part. We also acknowledge the support from the National Agricultural Research Laboratories (NARL), Uganda. Dr De Meyer (Royal Museum for Central Africa-Belgium) and Maulid Mwatawala (Sokoine University of Agriculture, Tanzania) guided on the confirmation of species during a ‘Training Course in Taxonomy and Systematics of African Fruit Flies’ at the Royal Museum for Central Africa-Belgium in 2012.