I. INTRODUCTION
Solar energy conversion is a highly attractive process for clean and renewable power for the future. Cu(In,Ga)(Se,S)2/CdS/ZnO has proven itself to be a worthwhile photovoltaic combination achieving record efficiencies upward of 20%. Reference Repins, Contreras, Egaas, DeHart, Scharf, Perkins, To and Noufi1 These record efficiencies have been obtained on the layered thin-film structures through vacuum-based approaches. Reference Repins, Contreras, Egaas, DeHart, Scharf, Perkins, To and Noufi1,Reference Kaelin, Rudmann and Tiwari2 Along with high performance, the cost of making such devices is also high, which has become a barrier to the affordability of vacuum-based solar cells as a commercial energy source. As a result, solution-based approaches such as electrodeposition, Reference Guimard, Bodereau, Kurdi, Guillemoles, Lincot, Grand, Ben Farrah, Taunier, Kerrec and Mogensen3,Reference Bhattacharya, Hiltner, Batchelor, Contreras, Noufi and Sites4 nanoparticle precursors, Reference Kapur, Bansal, Le and Asensio5,Reference Eberspacher, Fredric, Pauls and Serra6 and organic solutions Reference Jin, Banger, Harris and Hepp7 have attracted significant attention in the last few years. While the solution-based approaches have lower fabrication costs, there are a few disadvantages. These disadvantages include, for example, the difficulty in obtaining the desired grain structure characteristics, eliminating impurities (e.g., C, O, Cl), and the chemical complexity inherent in a compound semiconductor consisting of several different elements. Reference Kaelin, Rudmann and Tiwari2 So far, the most effective solution-based approach is the hydrazine-based precursor process pioneered by researchers at IBM. Reference Liu, Mitzi, Yuan, Kellock, Chey and Gunawan8–Reference Yuan and Mitzi13 Recorded efficiencies have reached up to 15%, Reference Todorov, Gunawan, Gokmen and Mitzi9 on par with that of the vacuum-based approaches. The process is a completely solution-based approach and involves dissolving precursor materials in anhydrous hydrazine.
The hydrazine-based approach possesses advantages such as good grain size, less impurity incorporation, precise control of material composition through individual precursors, and large-scale thin-film deposition with desired homogeneity. Reference Mitzi, Yuan, Liu, Kellock, Chey, Schrott and Deline11 Direct control over the film composition is crucial for achieving the desired grain structure and best device performance. Hydrazine allows for the elements to be mixed at a molecular level allowing for the large area deposition in commercial applications. Reference Mitzi, Yuan, Liu, Kellock, Chey, Deline and Schrott10
Compared with the devices achieved by vacuum processes, there is much room for the solution approach to improve its device efficiency. For doing so, a better understanding of a number of factors that influence solar cell efficiency is required. These include the absorber layer composition and electronic properties, buffer layer materials, and effects of annealing treatments. Reference Mitzi, Yuan, Liu, Kellock, Chey, Gignac and Schrott12 In this study, we investigated some of the important factors that are critical for improving solar cell efficiency using hydrazine-based solution process. One of the key questions to be answered is how to improve fill factor by adjusting the material properties such as series and shunt resistances. The roles of Cu and Ga in the absorber layer, annealing temperature, and chemical etching were studied.
It was found that the device performance has been improved by adjusting the composition to a Cu-poor concentration near the CIGS/CdS interface. A Cu-poor stoichiometry has also been reported to be favorable for vacuum-based device performance. Reference Leskela and Ritala14 Sequencing the absorber layer to include a Cu-rich portion has been shown to improve CIGS efficiency, Reference Niinisto, Paivasaari, Niinisto, Putkonen and Nieminen15 but we find that a Cu-poor interfacial layer with the buffer layer of cadmium sulfide (CdS) is still necessary for optimizing shunt resistance of the device. We have also investigated absorber alteration by increasing Ga concentration near the molybdenum (Mo) surface to reduce series resistance. With an appropriate Ga concentration, the series resistance can be minimized and therefore the device performance can be further improved.
II. EXPERIMENTAL
A hydrazine-based solution process was used for CIGS deposition in this study. Reference Liu, Mitzi, Yuan, Kellock, Chey and Gunawan8–Reference Mitzi, Yuan, Liu, Kellock, Chey, Gignac and Schrott12 Four precursor solutions are prepared by dissolving 6 mmol of copper (I) sulfide (Cu2S) with 12 mmol of S in 12 mL of anhydrous hydrazine (precursor 1), 4 mmol of indium (III) selenide (In2Se3) with 4 mmol of selenium (Se) in 12 mL of anhydrous hydrazine (precursor 2), 6 mmol of Ga with 12 mmol of Se in 12 mL of anhydrous hydrazine (precursor 3), and 12 mmol of Se in 12 mL of anhydrous hydrazine (precursor 4). A stirring process was used to prepare the precursor solutions.
Once the precursor solutions are complete, the final solutions are prepared by mixing the appropriate quantities of each precursor solution into a single solution. By tuning the quantity of each solution, the composition of the CIGS film can be adjusted. For example, to tune the Cu concentration in the CIGS films from Cu-poor to Cu-rich, final solutions with controlled Cu precursor from less-to-more and selenium precursor from more-to-less are prepared. The final solutions are then allowed to stir for up to two weeks to ensure the mixture is thorough. Once prepared, the final solution is stable and good to use for a couple of months.
After the final solutions are ready, the film layers are deposited on Mo-coated soda-lime glass substrates by spin coating at 1000 rpm for 60 s to ensure a uniform coating. For the increased Ga concentration near the Mo surface, different numbers of the Ga2Se3 (Precursor 3) layer were deposited initially. CIGS final solutions are then deposited. The typical CIGS chemical concentration is 1.0 for Cu, 0.7 for indium (In), 0.3 for Ga, and 2.0 for sulfur (S). This means the film contains 25% Cu. The focus of this research is to slightly adjust the concentration of Cu and Ga. Several CIGS samples are deposited with nine layers of the same Cu concentration ranging from 0.7 to 1.1 in terms of the chemical ratio with the other elements. Other samples are made with a sequencing Cu concentration so that the film is composed of three layers of each composition, i.e., Cu-poor (0.9), Cu-rich (1.1), and Cu-poor (0.9). After spin coating, the samples were immediately placed on a preheated hot plate to dry for 5 min at 290 °C in between each layer deposition. Note that all these procedures were finished in a N2 filled glove box because hydrazine is highly toxic and contact with the vapors or liquid needs to be prevented.
Postdeposition treatments must be done for obtaining device-quality absorber materials. There is no concern of residue hydrazine in the films because it is unstable during heat treatment, leaving the resulting film almost free of impurities. Reference Yuan and Mitzi13 It is important that both the initial and final heat treatments are done under an inert atmosphere to avoid any contaminants into the film as well as to protect from exposure to the hydrazine. Our final heat treatment is done by thermal sulfurization in a tube furnace, which is different from the process developed by the IBM group who did it in a glove box. The samples are heated in a vacuumed tube furnace with elemental sulfur powder present. The sulfur replaces the lost selenium in the films at high temperatures and also eliminates any contaminants that may arise in the film, such as oxygen.
Another postdeposition treatment is wet chemical etching. Nitric acid was used to etch CIGS for up to 60 s. This wet chemical etching helps to remove smaller crystals that may hinder carrier collection by offering more recombination centers.
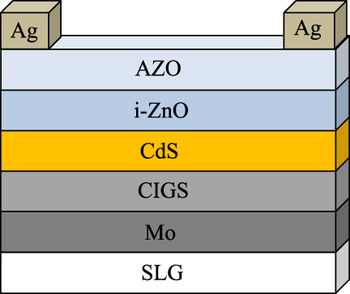
Photovoltaic devices are completed by using chemical bath-deposited CdS as a buffer layer, followed by an intrinsic zinc oxide (i-ZnO) layer and a window layer of aluminum-doped zinc oxide (AZO) both deposited by atomic layer deposition (ALD) method. ALD allows for precise control over deposition quality, uniformity related to film properties and thicknesses, and an ability to coat very large surface areas in industrial systems. Reference Leskela and Ritala14–Reference Levy and Nelson16 Oxygen plasma is used to adjust the properties of the intrinsic ZnO properties. ALD is able to precisely control Al doping in the AZO films to control resistivity in the 10–3 range. Reference Kim, Choi, Park, Golledge and Johnson17 The device structure is shown in Fig. 1. Mo is used as a back contact and silver (Ag)/AZO for a front contact.
Typical structure of CIGS thin-film solar cells.

Film morphology was observed with scanning electron microscopy (SEM; JEOL JSM7000 at 15 kV, Peabody, MA). The composition was analyzed and quantified with energy-dispersive spectroscopy (EDS). The structural properties were examined with x-ray diffraction (XRD, Rigaku, Cu Kα, λ = 1.54059 Å, The Woodlands, TX). After the solar cell devices were prepared, they were scribed into 3 × 3 mm2 small cells for testing. Current–voltage (I–V) characterization of the solar cells was performed by a Keithley 2400 source meter under AM1.5 spectrum using a solar simulator. A minimum of eight similar samples were used to determine experimental consistency.
III. RESULTS AND DISCUSSION
A. Effect of Cu on shunt resistance
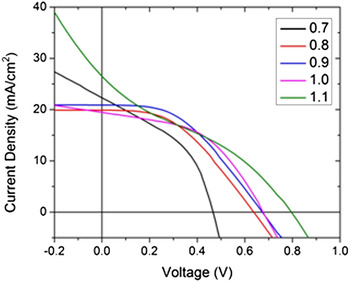
Shunt resistance plays an important role in a solar cell performance, which is used to describe the resistance when an unwanted short-circuit between the contacts occurs. The ideal shunt resistance approaches infinity so that there is no current leakage in solar cells. Low shunt resistances cause a power loss in the device. In this research, shunt resistance was studied by adjusting the amount of Cu in the absorber layer of CIGS near the CdS interface. The use of a solution process allows for simple and direct control of each elemental composition in the absorber material, which facilitates an easy way to study the relationship between the composition and the shunt resistance. Figure 2 shows the I–V curves of CIGS solar cells with the change of Cu concentration from 0.7 to 1.1. The Cu concentration was precisely controlled through direct manipulation of the stoichiometry of the final solution and confirmed in the resultant film by EDS. One can see that the I–V curves are significantly different as Cu composition changes. Very stable I–V curves are observed for Cu concentrations of 0.8, 0.9, and 1.0. The shunt resistance seems to be improved in this range as compared with concentrations of 0.7 and 1.1.
I–V curves of CIGS with different Cu concentrations.

The shunt resistance (R SH) can be determined from the forward I–V curve by measuring its slope near the short-circuit current. The inverse of this slope yields the shunt resistance:
 $${R_{{\rm{SH}}}} = {{\Delta V} \over {\Delta I}}\quad.$$
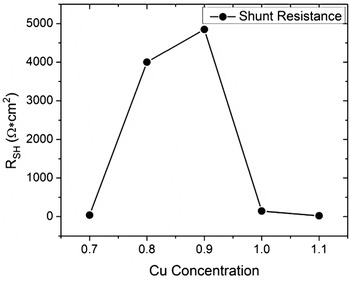
The calculated shunt resistances for these devices are shown in Fig. 3. One can see that either too high or too low Cu concentration produces very low values of shunt resistance in the devices. When the Cu concentration is 0.7, the shunt resistance is 40 Ω cm2. This value increases to 4000 and 5000 Ω cm2 at Cu concentrations of 0.8 and 0.9. Continued increase of the Cu content in CIGS, however, causes the shunt resistance to decrease to 20 Ω cm2.
Shunt resistances of CIGS at different Cu concentrations.

Influence of Cu content on shunt resistance has been investigated in vacuum-processed (coevaporation) CIGS. It was reported that the resistivity of bulk absorber materials increases with the decrease of Cu concentration and the shunt resistance increases in the corresponding devices. Reference Virtuani, Lotter and Powalla18 Cu-poor material resistively suppresses extensive current flow in the shunt regions. These regions can be thought of as nanoscale phase segregations in the space-charge region of the absorber near the absorber/buffer interface. Reference Virtuani, Lotter and Powalla18 In this solution-processed CIGS, the shunt resistance is very high only in a reasonable window of Cu concentrations. Too much or too little Cu in the film resulted in a low shunt resistance.
It is well accepted that Cu-poor and Cu-rich alternating layers provides the best combination for high efficiency CIGS solar cells. For example, an absorber layer of Cu poor-rich-poor has shown improvement in the device performance. Reference Kessler, Chityuttakan, Lu, Scholdstrom and Stolt19,Reference Shafarman and Zhu20 This has been done through vacuum-based approaches (coevaporation), which indicates that Cu-rich stoichiometry helps the crystallinity of CIGS due to the CuSe phase acting as a flux for growth. Reference Shafarman and Zhu20,Reference Klenk, Walter, Schock and Cahen21 The improved crystallinity allows for efficient charge transport and therefore better device performance.
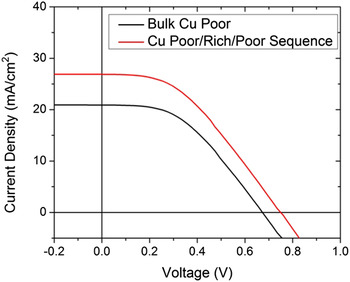
The hydrazine-based solution process can easily control Cu concentration to make Cu poor-rich-poor CIGS layers. A comparison study has been made to investigate the effect of a Cu poor-rich-poor structure on solar cell performance. The combination of Cu-poor and Cu-rich layers has shown improved device performance in terms of increased short-circuit current I sc. Figure 4 displays an increase of the I sc from 20.89 mA/cm2 for Cu-poor only, to 26.85 mA/cm2 by using Cu poor-rich-poor combination. The combination consisted of a Cu-rich concentration of 1.1 between two Cu-poor concentrations of 0.9. The open-circuit voltage (V oc) was also found to change from 0.67 V to 0.75 V. It is unknown at this time what effect the Cu-rich inclusion has on the open-circuit voltage. The device with poor-rich-poor combination shows an efficiency of 8.3% while the one with only Cu-poor has an efficiency of only 6.2%. Both devices have similar fill factor values. One may notice that the shape of the I–V curves look very similar because both devices have the same interfaces at the back contact and the p–n junction. The p–n junction consists of a Cu-poor CIGS material with CdS while the interface at the back contact is Cu-poor CIGS and Mo. The Cu-rich layer is sandwiched between the Cu-poor layers. The shunt resistances are very similar in both cases. The slowly decreasing slope of the I–V curve as it approaches the V oc corresponds to the series resistance of the device, which will be discussed in the next section. Both devices show similar but high series resistance. The Cu-rich layer does not affect the shunt resistance or the series resistance but the extra Cu promotes crystal growth and helps decrease the number of recombination centers and thus improve the short-circuit current.
I–V curves from CIGS solar cells with a single Cu-poor layer (black) and a Cu poor-rich-poor combination (red).

B. Effect of Ga on series resistance
One of the most productive ways to improve a solar cell device is to reduce the series resistance. As shown in Fig. 4, both devices have high values of series resistance, which have to be reduced to optimize the device performance. The contact resistance between the semiconductor and the metal contact, i.e., Mo/CIGS interface, plays an important role in tuning the series resistance. We have adjusted the Cu concentration of CIGS within a certain range, which did not show obvious effects on the series resistance. Another way to tune the resistance is to change Ga concentration near the interface. By increasing the Ga concentration in CIGS in a vacuum-based process, the electrical resistivity of the film was found to decrease. Reference Kwon, Lee and Ahn22 This observation may have implications in reducing series resistance in the solution-based process. The IBM group also included a Ga-richer CIGS layer between the Mo and bulk CIGS absorber layers for their devices. Reference Todorov, Gunawan, Gokmen and Mitzi9 In this study, the series resistance of CIGS solar cells was investigated by changing Ga concentration in the interface layer near Mo back contact. By optimizing the amount of Ga at the interface, series resistance has been minimized and device performance was improved.
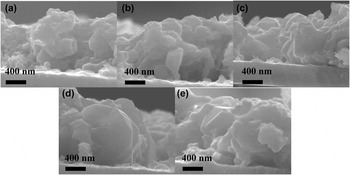
The samples under investigation were CIGS layers with Cu poor-rich-poor sequence deposited on a Ga2Se3 initial layer. Figure 5 shows the SEM cross-section images of CIGS thin films with different numbers of Ga2Se3 layers. The SEM images did not show a noticeable distinction in morphology between the Ga2Se3 layer and the main CIGS film, indicating that the Ga may have diffused into the CIGS thin film. This is confirmed by measuring EDS near the Mo/CIGS interface as shown in Fig. 7.
SEM of CIGS with different Ga2Se3 layers at Mo interface: (a) 0 layers, (b) 1 layer, (c) 2 layers, (d) 3 layers , and (e) 4 layers.

With more layers of the Ga2Se3 included in the film, grain size is increased from about half the film thickness to close to the full thickness of the film. Not having a Ga2Se3 layer at the interface produces meager sized grains which will work but are not ideal for device applications.
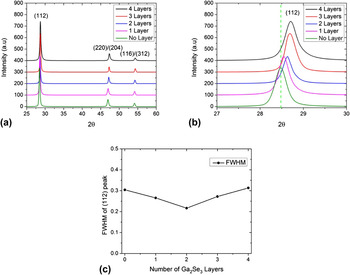
Figure 5 has indicated the change in crystallinity of the thin films, i.e., the films exhibited an increase in grain size as Ga2Se3 layer was increased at the base of the absorber layer. This crystallinity change was also confirmed by XRD measurement as shown in Fig. 6. All the samples show typical CIGS diffraction peaks at 28.4°, 46.9°, and 54.1°. However, the peak position and width are noticeably different among those patterns. Figure 6(b) shows the magnified peaks at 28°, indicating the peak shift to higher 2θ values. This shift is directly related to the increase of Ga in the CIGS thin film. The atomic radius of Ga is smaller than that of In, so the increase of Ga resulted in a smaller lattice constant and XRD peaks shift to higher angles. Reference Kwon, Ahn, Kim, Yoon and Song23
XRD of CIGS films with different numbers of Ga2Se3 from 0 to 4 layers: Wide angle scan (a), magnified spectra of (112) peak (b), and full width at half maximum (FWHM) for (112) peaks (c).

The change in crystal size due to the inclusion of Ga2Se3 initial layer was also confirmed by XRD. As shown in the morphologies of Fig. 5, the crystal size increases as Ga2Se3 was increased. Figure 6(c) shows the width of the (112) peak as a function of the number of layers of Ga2Se3. The grain size can be calculated by using the Scherrer equation, which indicates that the grain size is in the range of 54–78 nm. The film with two layers of Ga2Se3 shows the largest grain size. But with more Ga2Se3 layers, grain growth is hindered. It has been reported that the grain size decreases in a homogeneous CIGS thin film as Ga concentration increases toward 0.5. Reference Kwon, Lee and Ahn22 In this investigation, the peak broadening after two layers of Ga2Se3 indicate smaller crystals are present in the films. It is important to have the grain growth optimized in solar cell applications because grain boundaries act as recombination centers for photogenerated charge carriers. The smaller grains displayed without Ga2Se3 and with thicker layers of Ga2Se3 will hinder the device performance due to the increased recombination centers for the photogenerated carriers. However, device performance is improved in the film with large grains because of less recombination centers.
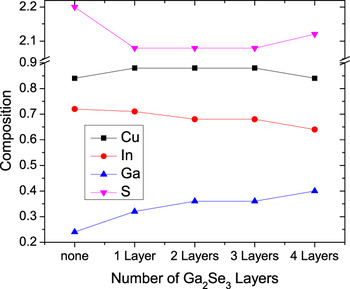
For checking how the Ga is distributed in the films, EDS was measured at 200 nm intervals from the Mo surface as shown in Fig. 7. As expected, as the number of Ga2Se3 layers increased, so did the Ga concentration in the film near the Mo surface. The inclusion of the Se has appeared to play a small role as it is replaced during sulfurization. Because the initial concentration of the film is slightly Cu-poor, the S content is much higher in the sample without the Ga2Se3 layer. It is also apparent that the increase of Ga concentration limits the amount of indium in the film.
Composition of CIGS films with different layers of Ga2Se3 inclusion as measured at 200 nm from Mo surface.

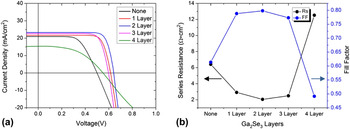
The effect of the Ga layer on device performance is shown in Fig. 8(a). Optimizing the Ga2Se3 in the absorber has improved device output. The inclusion of a thin Ga2Se3 layer shows an increase in short-circuit current by a factor of about 15% as compared to the device without the Ga2Se3 layer. This is primarily due to the increased charge carrier collection in the film of better crystallinity. An increase in open-circuit voltage is observed by the optimization of Ga2Se3 layers. However, adding too much Ga2Se3 in the initial layers hinders device performance. Both the open-circuit voltage and short-circuit current drop drastically when there is too much Ga2Se3 present in the film near the Mo interface. In this case grain growth is hindered greatly and more recombination centers are produced.
(a) I–V curves of CIGS devices with different Ga2Se3 layers, and (b) corresponding series resistance and fill factor.

The noticeable effect of Ga on the device is actually the series resistance as seen from the I–V curves. Figure 8(b) shows the series resistance as a function of number of Ga2Se3 layers. The series resistance decreases for very thin layers of Ga2Se3 up to 2 layers. Beyond that, the series resistance increases. This change in the series resistance is due to the different crystallinity of the absorber layer and the decreased resistivity in the CIGS layers near the Mo surface. The improvement in series resistance causes significant change in fill factor of the devices. The best measured device with 2 layers of Ga2Se3 at the CIGS/Mo interface showed an I sc of 23.3 mA/cm2, a V oc of 0.64 V, a photon conversion efficiency of 11.9%, and a fill factor of 79.8.
By optimizing the Ga2Se3 layer, the fill factor can be improved due to the decrease in series resistance. Gallium's role in the absorber layer material is 3-fold. An increase in the Ga concentration increases the optical band gap of the CIGS layer which has a direct effect on the open-circuit voltage. Reference Mitzi, Yuan, Liu, Kellock, Chey, Deline and Schrott10,Reference Kwon, Lee and Ahn22 We have seen the band gap increase up to 1.7 eV due to the Ga incorporation but also partially due to the replacement of selenium with sulfur. Direct control over crystallinity allows for improved carrier mobility and decreased recombination centers. And increased Ga concentration near the Mo surface also results in the decrease in the series resistance of the device and therefore an increase in fill factor.
C. Effect of surface etching
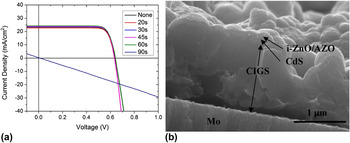
The largest crystal sizes are formed at 650 °C sulfurization temperature. But, there are still some small crystals which lead to a large number of grain boundaries. A wet chemical etching was performed to etch away the smaller crystals on the surface before device fabrication. It is expected that the solar cell performance would be improved. A decrease in the amount of smaller crystals was noticed as the etching time was increased up to 60 s. Beyond 60 s, no significant change was observed. However, longer etching times cause the film to slowly degrade away and thus device performance will eventually suffer. Devices were constructed after the surface etching and the I–V curves are shown in Fig. 9. Etching the surface of CIGS for a short time has very little effect on the I–V curves although it shows a slight improvement in short-circuit current. When etching for 90 s, it shows a linear I–V curve without a photovoltaic effect. The CIGS film may have been etched to the point that the material is completely eliminated in spots so that the device would short out.
(a) IV curves of CIGS devices with different wet chemical etching times and (b) SEM of CIGS device with a Cu poor-rich-poor sequence, 2-Ga2Se3 layers, and a 60 s etched absorber layer topped with CdS, i-ZnO, and AZO.

The final device consisting of a Cu poor-rich-poor CIGS film with two layers of Ga2Se3 and a 60 s wet chemical etching is shown in Fig. 9(b). One can see the large crystals in the CIGS film. Above the CIGS film, thin films of CdS buffer layer, i-ZnO intrinsic layer, and AZO window layer were deposited. It's hard to see these layers because of their very small thicknesses.
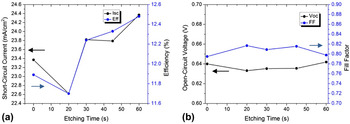
Figure 10 summarizes the impact of etching on short-circuit current, open-circuit voltage, efficiency, and fill factor of the devices. There is a slight increase in the short-circuit current and the cell efficiency. The open-circuit voltage and fill factor seem to stay constant after etching. This is easy to understand because the etching removes the small crystals on the surface but does change the absorber material's physical properties. Therefore, the charge recombination centers are reduced and the current is increased without impact fill factor and open-circuit voltage.
(a) Short-circuit current I sc and efficiency and (b) open-circuit voltage V oc and fill factor FF of CIGS solar cells after wet chemical etching for different times.

IV. CONCLUSIONS
CIGS based solar cell devices were improved by directly adjusting the shunt and series resistances. Cu-poor surface compositions were used to improve the shunt resistance while a Cu poor-rich-poor sequence was used to increase short-circuit current. The most effective device was made by using a CIGS layer with a surface layer that is Cu-poor. A Ga2Se3 layer on top of the Mo was used to improve crystallinity and series resistance. The specific parameters associated with the incorporation of Ga at the Mo/CIGS interface were found to increase the crystal size and lower the series resistance. The device with two layers of Ga2Se3 shows the lowest series resistance and the largest grain sizes. Elimination of small crystals on the CIGS surface by chemical etching did not change the series or shunt resistance, but slightly improved the charge collection due to the reduced grain boundaries. This study indicates that the solution-based process provides a simple but effective way to tune the composition of CIGS materials for improving the corresponding device performance. This process may also be considered for device optimization in other chalcogenide solar cell development.
ACKNOWLEDGMENTS
This work was supported by NSF under award EPS-1003970. The authors would like to thank the UALR Nanotechnology Center for use of its SEM and EDS facilities.