Introduction
Autism is a neurodevelopmental disorder with strong genetic components, that affect sensory, cognitive and motor systems (Behrmann, Thomas, & Humphreys, Reference Behrmann, Thomas and Humphreys2006; Milne, Swettenham, & Campbell, Reference Milne, Swettenham and Campbell2005; Mosconi, Takarae, & Sweeney, Reference Mosconi, Takarae and Sweeney2011; O'Hearn, Asato, Ordaz, & Luna, Reference O'Hearn, Asato, Ordaz and Luna2008). Elevated thresholds for visual motion perception (Annaz et al., Reference Annaz, Remington, Milne, Coleman, Campbell, Thomas and Swettenham2010; Koldewyn, Whitney, & Rivera, Reference Koldewyn, Whitney and Rivera2010; Milne et al., Reference Milne, Swettenham, Hansen, Campbell, Jeffries and Plaisted2002) and impairments in visual pursuit tracking (Takarae, Minshew, Luna, Krisky, & Sweeney, Reference Takarae, Minshew, Luna, Krisky and Sweeney2004) suggest alterations in processing of visual motion information and its use to guide behaviors. Two explanations have been proposed for these impairments: (1) a primary deficit in cortical motion detectors in the extrastriate area V5 or subcortical magnocellular systems projecting to V5 (Milne et al., Reference Milne, Swettenham, Hansen, Campbell, Jeffries and Plaisted2002; Spencer et al., Reference Spencer, O'Brien, Riggs, Braddick, Atkinson and Wattam-Bell2000), and (2) a deficit upstream, which affects higher-level perceptual analysis and top–down attentional control of sensory processing. The latter predicts task and stimulus dependent impairments in perceptual judgments about motion stimuli (Bertone, Mottron, Jelenic, & Faubert, Reference Bertone, Mottron, Jelenic and Faubert2003). With regard to the neural correlates of abnormalities in visual motion perception, there is evidence supporting both accounts. Smaller activation changes in V5 in response to manipulation of motion coherence suggest fundamental, lower-level disturbances in sensory processing (Brieber et al., Reference Brieber, Herpertz-Dahlmann, Fink, Kamp-Becker, Remschmidt and Konrad2010), while reduced brain activation specific to complex biological motion stimuli (Freitag et al., Reference Freitag, Konrad, Haberlen, Kleser, von Gontard, Reith and Krick2008; Koldewyn, Whitney, & Rivera, Reference Koldewyn, Whitney and Rivera2011) implicates higher-level systems.
In the present study, we used two tasks to investigate neural correlates of impairments related to visual motion perception. First, we used passive viewing of visual motion to examine response to bottom–up visual motion input as well as adaptation to the input. Adaptation paradigms have been effective in examining one of the fundamental properties of visual systems, opponency (Castelo-Branco et al., Reference Castelo-Branco, Kozak, Formisano, Teixeira, Xavier and Goebel2009; Tootell et al., Reference Tootell, Reppas, Dale, Look, Sereno, Malach and Rosen1995). Opponency refers to gamma-aminobutyric acid (GABA) mediated mutual inhibition between neurons with different direction tuning (Bair, Cavanaugh, & Movshon, Reference Bair, Cavanaugh and Movshon2003; Spiegel, Hansen, Byblow, & Thompson, Reference Spiegel, Hansen, Byblow and Thompson2012), which determines how signals from single neurons become integrated to decide direction selectivity of the population response (Heeger, Boynton, Demb, Seidemann, & Newsome, Reference Heeger, Boynton, Demb, Seidemann and Newsome1999). Because of supportive evidence for GABA system abnormalities in autism (Collins et al., Reference Collins, Ma, Whitehead, Martin, Wright, Abramson and Pericak-Vance2006; Fatemi et al., Reference Fatemi, Halt, Stary, Kanodia, Schulz and Realmuto2002; Oblak, Gibbs, & Blatt, Reference Oblak, Gibbs and Blatt2009), it is possible that this important mechanism for visual motion perception is compromised. Opponency underlies some perceptual phenomena, such as motion aftereffects, which includes the perception of illusory movement after viewing directional movement. Visual neurons go through adaptation after prolonged exposure to directional movement, then their activity as well as their abilities to maintain opponent inhibition over neurons with opposite direction tuning, decreases (Krekelberg, Boynton, & van Wezel, Reference Krekelberg, Boynton and van Wezel2006; Van Wezel & Britten, Reference Van Wezel and Britten2002). This disrupted balance in inhibitory networks results in a relative increase in activation, via disinhibition, in neurons with opposite direction tuning, and yields the perception of movement in the opposite direction (motion aftereffect) (Anstis, Verstraten, & Mather, Reference Anstis, Verstraten and Mather1998; Krekelberg et al., Reference Krekelberg, Boynton and van Wezel2006). The time course of V5 BOLD recovery function is related to the dissipation of opponency-related disinhibition that produces motion aftereffects (Castelo-Branco et al., Reference Castelo-Branco, Kozak, Formisano, Teixeira, Xavier and Goebel2009; Tootell et al., Reference Tootell, Reppas, Dale, Look, Sereno, Malach and Rosen1995). Thus, in addition to examining activation patterns during visual motion stimulation as typically performed in functional magnetic resonance imaging (fMRI) studies, we performed analysis of BOLD recovery function to examine opponency to address integrity of local V5 circuitries.
We also implemented a visual pursuit tracking task where visual motion needs to be more attentively processed to track a moving target to assess top–down control over visual motion processing. While there are several fMRI studies conducted to investigate visual motion perception in autism, few have investigated the use of visual motion information to guide motor response. Because activity of neural areas depends on interactions with other areas in the distributed network, this task provides another context to examine functioning of area V5.
Materials and Methods
Participants
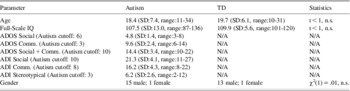
Participants were 16 high-functioning individuals with autism and 14 typically developing (TD) individuals group-matched on chronological age and on Full-Scale IQ obtained using age-appropriate versions of the Wechsler Intelligence Scale (Table 1). All participants in the autism group met the DSM-IV criteria for Autistic Disorder and as well as the autism criteria on the Autism Diagnostic Interview–Revised (ADI-R) (Lord, Rutter, & Le Couteur, Reference Lord, Rutter and Le Couteur1994) and the Autism Diagnostic Observation Schedule (ADOS) (Lord et al., 2000). Participants with autism were excluded if they had an associated infectious, genetic, or metabolic disorder known to cause autistic features such as fragile X or tuberous sclerosis, or known clinical history of mood or psychotic disorders. No participants had a history of taking lithium, antipsychotic, or anticonvulsant medications. One participant took stimulant medication more than 24 hours before testing. Three participants were taking antidepressant medication for treatment of anxiety and repetitive behaviors associated with autism.
Demographic, IQ, and diagnostic variables

TD participants reported no personal history of psychiatric or neurological disorder, no known family history of autism, and no first-degree relative with a neuropsychiatric disorder considered to have a genetic component. They had no personal history of developmental delay, significant problems in school performance, or sign of learning disability in psychoeducational testing (Williams et al., 2006). No participant had a history of head injury, birth injury or seizure disorder. Far acuity of all participants was normal or corrected to at least 20/40. Informed consent and/or assent were obtained from all participants and, when appropriate, from their parents/guardians. The study was approved by the Institutional Review Boards of the University of Pittsburgh where all MRI scans and clinical assessments were performed.
Tasks
Passive viewing of visual movement
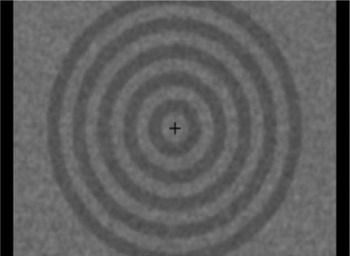
Outward moving rings (constant speed of 6.8 degs/s) were presented against a textured gray background for 30 s, alternating with 30 s during which the rings were stationary. This block design paradigm was used to index response to sustained visual motion, and the paradigm, which used a stimulus motion duration similar to previous studies of TD individuals (Berman & Colby, Reference Berman and Colby2002; Culham et al., Reference Culham, Dukelow, Vilis, Hassard, Gati, Menon and Goodale1999), induces a strong motion aftereffect. Each ring was 0.85 degs wide, and the widest extent of the expanding rings was ± 9 degs (Figure 1). As the rings reached the 9 deg radius, they were replaced with new rings near central fixation. A cross hair (0.8 degs wide) was presented at center at all times, and participants were instructed to maintain fixation on the cross hair throughout the task. The task sequence started and ended with stationary ring images, and the total duration of the task was 7.5 min. A shorter version of the task was presented before the scan session to demonstrate the task.
Illustration of the stimulus used in the Passive Viewing of Visual Movement task. Dark and light rings were constructed using 53 and 39% gray and presented against a textured background.

Visual pursuit tracking
The target for visual pursuit (a white circle with a diameter of 0.5 degs) started from center and moved back and forth between ± 7.5 deg positions along the horizontal plane. Target speed between ± 5 deg positions was kept constant at 10 degs/s. The target started decelerating after passing ± 5 deg positions toward ± 7.5 deg positions, at which point the target completely stopped its movement, reversed direction toward the center, and gradually accelerated until reaching ± 5 deg positions. Then the target moved at the constant speed of 10 deg/s until it reached ± 5 deg positions and started decelerating to reverse directions at ± 7.5 deg positions. The target oscillated in this manner for 30 s during which participants tracked the target with their eyes. The 30 s period of visual tracking was alternated with a 30 s fixation condition during which participants fixated on a central fixation cross (0.5 degs wide). The total duration of the task was 6.5 min.
Eye Movement Recording and Analysis
Eye movements during both fMRI tasks were monitored using a MRI compatible video-based tracking system (ASL-Model 504LRO, Applied Science Laboratories, Bedford, MA) at a 60 Hz sampling rate. Task compliance during passive motion viewing was examined off-line by counting the number of saccadic eye movements away from central fixation that were larger than 1 degree. There was no significant group difference in central fixation failure based on these saccade counts either with stationary or moving ring stimuli (t's < 1, n.s., mean saccade counts of .91 (SD = .88) and .71 (SD = .80) with stationary rings, and .92 (SD = .94) and .69 (SD = .80) with moving rings for autism and TD groups, respectively). Global performance of visual pursuit was evaluated by correlating eye and target positions after applying a 1 Hz, low-pass, digital filter to the eye movement data, and the correlation coefficients were transformed to Z scores using Fisher's z transformation. While a slightly poorer performance in the autism group was suggested, this group difference was not statistically significant, t(25) = 2.03, n.s. (Fisher Z scores of 2.03 (SD = .52) for the autism group and 2.43 (SD = .50) for the TD group, with lower scores indicating less correspondence in eye and target positions, thus poorer performance).
Scan Parameters
We performed gradient-echo echo-planar imaging using a 3 Tesla scanner (GE Signa LX whole body system) with a volume proton radiofrequency coil. Acquisition parameters were: repetition time (TR) = 2.5 s, echo time (TE) = 25 ms, flip angle = 90°, 23 slices, 1 number of excitations (NEX), 64 × 64 acquisition matrix, field of view (FOV) = 20 × 20 cm2, 5 mm thickness, 1 mm gap, axial plane of acquisition. This field of view covered the brain from the dorsal cortical surface to the dorsal cerebellum. For registration of the functional data, T1 weighted images were acquired of the whole brain with three-dimensional gradient echo imaging with TR = 25 ms, TE = 5 ms, flip angle = 30°, 256 × 256 acquisition matrix, 192 slices, FOV = 24 × 18 cm2, and 1.5 mm thick axial slices with no gap.
Image Analyses
FIASCO software (Functional Imaging Analysis Software - Computational Olio; Eddy et al., 1996) was used to correct for signal drift and head movement. For each participant, only volumes within 1.5 mm displacement and 0.5 deg rotation from the median head position over the time series were included in statistical analyses. There was no difference in the number of images that met this criterion across participant groups for either task, t's <1, n.s. [mean numbers of images 143.06 (SD = 36.01) and 139.36 (SD = 27.17) for the passive viewing task and 122.64 (SD = 28.67) and 129.14 (SD = 21.86) for the pursuit task, for autism and TD groups, respectively]. The time series data were shifted by 6 s to compensate for delay in the BOLD response, and a modest Gaussian filter (2.4 mm FWHM) was applied before statistical analysis to derive individual activation maps. The T1 structural images were co-registered with maps of brain activation obtained from each participant. Both image sets were then transformed into Talairach coordinate space (Talairach & Tournoux, 1988) using Analysis of Functional NeuroImages software (AFNI; Cox, 1996). Maps of within-group activation for each task were then created using Fisher's method (Lazar et al., 2002) and resampled to 2 mm isotropic voxels for group comparison. Statistic maps were created to quantify between-group differences in brain activation and contiguity thresholds (minimum 173 contiguous voxels, 1384 mm3) were applied to all activation maps to maintain nominal Type 1 error rates of p < .05 using the alphasim procedure in AFNI. The group activation maps were examined using regions of interest used in our previous work to aid interpretations (Takarae, Minshew, Luna, & Sweeney, Reference Takarae, Minshew, Luna and Sweeney2007).
Analysis of Hemodynamic Decay Functions after Passive Visual Motion Processing
Analysis of the decay of V5 hemodynamic responses after termination of visual motion during the passive viewing task was performed in original space for each participant to preserve shapes of the original time series data within voxels after slice timing correction. Voxels to model V5 BOLD decay were selected using the already co-registered individual T1 image and activation map described in the previous section. V5 was anatomically defined using the T1 image by tracing the ascending limb of the posterior inferior temporal sulcus and adjacent gyri (Berman & Colby, Reference Berman and Colby2002). Individual activation maps were thresholded using the alphasim simulation to maintain Type 1 error rates of p < .05 (minimum 10 contiguous original voxels, 584 mm3). Then, active voxels were selected for the modeling if they were inside the anatomically defined V5 region. A similar analysis of BOLD signal decay was performed using active V5 voxels after pursuit termination for comparison purposes. Activation in V5 during visual pursuit is well documented (Freitag et al., Reference Freitag, Greenlee, Lacina, Scheffler and Radu1998; Kimmig et al., Reference Kimmig, Ohlendorf, Speck, Sprenger, Rutschmann, Haller and Greenlee2008), while no motion aftereffect is likely to occur with the oscillatory target movement used in this study (He, Cohen, & Hu, Reference He, Cohen and Hu1998).
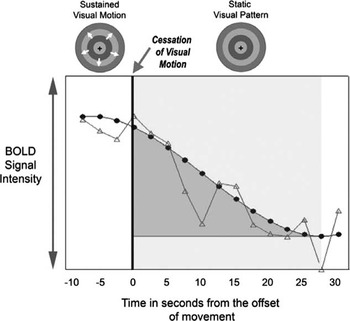
The modeling of BOLD signal decay was performed by fitting data with a mixed-effect regression model with Bayes estimates of polynomial coefficients (Gibbons et al., Reference Gibbons, Lazar, Bhaumik, Sclove, Chen, Thulborn and Patterson2004). The last one-third (10 s) of the preceding period with visual movement (or visual pursuit) through to the end of the subsequent period of stationary rings was used to model the decay function. The data from the prior motion (or pursuit) epoch was included to better anchor the level of activation from which decay began for parameter estimation. The time series data of interest were averaged across the six task blocks and then fitted with a regression model. Once the best fit function was defined, the area under the curve (AUC) for the decay function was estimated for each active voxel and then averaged across voxels to obtain a single index of post-motion activity in V5 for each participant (see Figure 2). The algorithm to fit the regression model did not converge well on one participant with autism from the passive viewing task, generating a result that was more than 5 standard deviations from the mean of the remaining participants. This participant was excluded from group analyses of the decay function.
Schematic illustration of the modeled decay function (dark gray line with filled circles) to a single voxel time series response (light gray line with open triangles), and the area under the curve (AUC, shaded in medium gray) computed for this voxel.

Results
Passive Viewing of Visual Movement
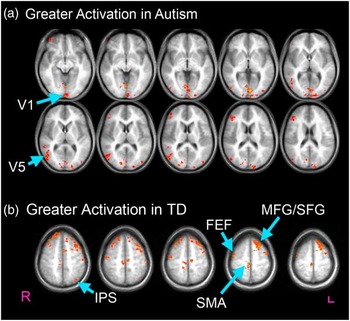
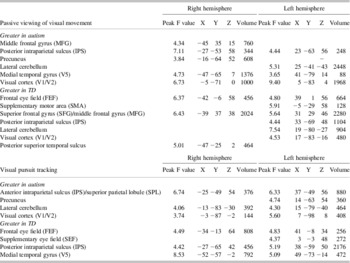
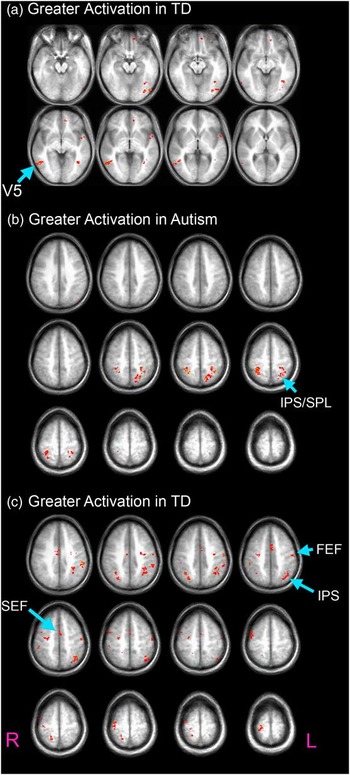
During the passive viewing of visual movement relative to stationary images, both participant groups showed significant activation in primary visual cortex, V5, intraparietal sulcus (IPS), precuneus, and cerebellar hemispheres (Supplementary Figure 1). The TD group demonstrated additional activation in the superior frontal gyrus and frontal eye fields (FEF). Relative to the TD group, the autism group had significantly greater activation in bilateral V5 and right precuneus, and lower activation in target fields of projections from V5, including the right posterior superior temporal sulcus (STS), bilateral FEF, and left superior frontal gyrus (Figure 3; Table 2).
a,b: Regions with statistical differences in activation during passive viewing of movement: (a) greater V5 activation in the autism group relative to the TD group (Z = −7 to +18), (b) greater activation in premotor and attention related regions in the TD group than autism group (Z = 49–58).

Brain regions showing statistically greater task-related activation in individuals with autism or matched typically developing control participants

Note. This table shows the F value for the peak activation in each region of interest and its corresponding coordinates in Talairach stereotaxic space, as well as the volume (mm3) of tissue in regions of interest in which there was statistically greater activation in one group relative to the other. Since clusters of activation identified by the contiguity threshold sometimes extended beyond pre-determined regions of interest, reported volumes of activation in regions of interest are in some cases less than the cluster volume required to identify significant effects.
Visual Pursuit Tracking
During the pursuit task, both groups showed bilateral activation in frontal and supplementary eye fields, superior frontal gyrus, IPS, precuneus, extrastriate area V5, and cerebellum (Supplementary Figures 2 and 3, Table 2). Activation of these regions during pursuit is consistent with previous studies (Berman et al., Reference Berman, Colby, Genovese, Voyvodic, Luna, Thulborn and Sweeney1999; Freitag et al., Reference Freitag, Greenlee, Lacina, Scheffler and Radu1998; Kimmig et al., Reference Kimmig, Ohlendorf, Speck, Sprenger, Rutschmann, Haller and Greenlee2008). Levels of activation were significantly reduced in bilateral FEF, posterior aspects of IPS, and V5 (Figure 4) in the autism group relative to the TD group. The autism group had significantly greater activation in rostral aspects of bilateral IPS, extending into the superior parietal lobule (SPL).
a–c: Regions with statistical differences in activation during visual pursuit: (a) greater V5 activation in the TD group relative to the autism group (Z = −16 to +5), (b) and (c) greater activation in anterior aspects of IPS and SPL and reduced activation in the FEF, SEF, and more interior and posterior aspects of IPS in the autism group compared to the TD group (Z = + 36 to +69).

Hemodynamic responses decay in V5
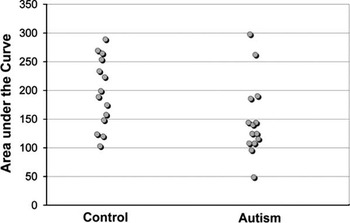
The area under the curve (AUC) for V5 BOLD response after visual movement cessation was significantly reduced in the autism group [mean 146.50 (SD = 64.56)] relative to the TD group [196.40 (SD = 60.86)]; t(27) = 2.14; p < .05; Cohen's d = .8 (Figure 5), even though activation was increased in this area in the autism group during passive motion viewing. The lower AUC indicates a reduced persistence of activation in participants with autism. This statistical difference was enhanced after covarying for the magnitude of activation during passive motion viewing, F(1,25) = 6.74; p < .05. The group difference was task specific, as the AUC values from the pursuit task did not significantly differ between groups, regardless of whether magnitude of activation was used as a covariate, F's < 1 [mean 116.48 (SD = 31.06) for autism and 115.74 (SD = 39.33) for TD]. This task specific effect suggests that the AUC difference in BOLD recovery following motion processing is related to specific neurophysiological and neurochemical processes that regulate the recovery from neural adaptation and associated disinhibition in extrastriate area V5.
Scatter plot of area under the curve (AUC) values, with each circle representing a single participant. The AUC values were computed based on polynomial mixed regressions fitted to BOLD responses from active V5 voxels for each participant. The autism group overall had smaller AUC values, consistent with reduced persistence of BOLD responses in autism.

Discussion
The aim of this study was to investigate the neural substrates of visual motion perception and visual pursuit tracking impairments that have been reported in autism (Bertone et al., Reference Bertone, Mottron, Jelenic and Faubert2003; Milne et al., Reference Milne, Swettenham, Hansen, Campbell, Jeffries and Plaisted2002; Spencer et al., Reference Spencer, O'Brien, Riggs, Braddick, Atkinson and Wattam-Bell2000; Takarae et al., Reference Takarae, Minshew, Luna, Krisky and Sweeney2004). The key brain area for both visual perception and visual pursuit is area V5. We used passive viewing of visual movement that primarily involves bottom–up drive to V5 and a pursuit task that is more dependent on areas of the association cortex involved in action planning and top–down control. The passive viewing task also provided an opportunity to examine strength of opponent inhibition in V5 via analysis of hemodynamic decay. The autism compared to the TD group showed greater activation in extrastriate area V5 during passive viewing and reduced activation in the same area during visual pursuit. They additionally had reduced persistence in V5 hemodynamic responses after viewing sustained movement, despite an enhanced activation during motion viewing relative to the TD group. During both tasks, the autism group showed reduced activation in rostral sensorimotor areas including FEF, and in higher-order visual areas such as STS. Finally, the autism group had greater activation in a more anterior and superior area in posterior parietal cortex during the visual pursuit task than the TD group, an area that has been linked to voluntary attention and decision making during visual tasks (Merriam et al., Reference Merriam, Colby, Thulborn, Luna, Olson and Sweeney2001).
One of the central questions regarding impairments in visual motion perception and its use for action planning in autism is whether the impairment stems from a system specific deficit that derives from abnormal sensory processing in lower level motion detectors, or disturbances in higher-level perceptual and sensorimotor systems (Dakin & Frith, Reference Dakin and Frith2005; Milne et al., Reference Milne, Swettenham and Campbell2005). Observations of relative increases and decreases over multiple visual areas during the different tasks in the autism group fail to indicate a simple dampening or enhancement of system specific activity. Rather, the results suggest a complex pattern of impairments including intrinsic abnormalities in V5 and additional disturbances in more distributed systems, including FEF and posterior IPS.
Activation of area V5 was enhanced during passive motion viewing in the autism group compared to the TD group. There were no differences observed at the thalamic level, and although there might be limitations in detecting thalamic activity due to low spatial resolution of fMRI, enhancement appears specific to neocortex. Similar V5 activity enhancement has been reported by other studies (Brieber et al., Reference Brieber, Herpertz-Dahlmann, Fink, Kamp-Becker, Remschmidt and Konrad2010), and a meta-analysis of fMRI studies suggests that enhancement of sensory activation is common across multiple visual paradigms in autism (Samson, Mottron, Soulieres, & Zeffiro, Reference Samson, Mottron, Soulieres and Zeffiro2012). In addition to the hyperactivity, our result of group differences in opponency-related disinhibition also points to local circuit alterations in V5.
Whether individuals with autism have impairments in lower level visual motion processing has been highly debated. Inconsistency in the literature seems to reflect multiple factors including developmental levels of participants and stimulus types (Annaz et al., Reference Annaz, Remington, Milne, Coleman, Campbell, Thomas and Swettenham2010; Bertone & Faubert, Reference Bertone and Faubert2006; Jones et al., Reference Jones, Swettenham, Charman, Marsden, Tregay, Baird and Happe2011; Koldewyn et al., Reference Koldewyn, Whitney and Rivera2010). While many low-level perceptual skills reach adult levels during childhood in TD individuals (Manning, Aagten-Murphy, & Pellicano, Reference Manning, Aagten-Murphy and Pellicano2012; van den Boomen, van der Smagt, & Kemner, Reference van den Boomen, van der Smagt and Kemner2012), more complex skills, such as biological motion perception, have slower trajectories (Hadad, Maurer, & Lewis, Reference Hadad, Maurer and Lewis2011; van den Boomen et al., Reference van den Boomen, van der Smagt and Kemner2012). The difference in developmental trajectories suggests that task performance depends on maturation of specific neural circuitries and may explain why impairments with higher level tasks are more consistently observed in autism (Kaiser & Shiffrar, Reference Kaiser and Shiffrar2009). However, there is possible heterogeneity in visual motion processing in the population even with relatively lower level tasks. Past studies have shown that early developmental history may predict severity of visual motion perception impairments (Spencer et al., Reference Spencer, O'Brien, Riggs, Braddick, Atkinson and Wattam-Bell2000; Takarae, Luna, Minshew, & Sweeney, 2008; Tsermentseli, O'Brien, & Spencer, Reference Tsermentseli, O'Brien and Spencer2008), indicating the possibility of multiple, different developmental trajectories for sensory processes in this population. The current findings indicate alterations in V5 function, and this may explain why some individuals with autism have impairments in lower level visual motion tasks.
V5 activation in the current study was increased during passive viewing of visual motion but reduced during the visual pursuit task, relative to TD participants. Increased V5 activation during visual pursuit relative to passive viewing has been frequently reported in TD adults and associated with robust top–down input to the area (Freitag et al., Reference Freitag, Greenlee, Lacina, Scheffler and Radu1998; Kimmig et al., Reference Kimmig, Ohlendorf, Speck, Sprenger, Rutschmann, Haller and Greenlee2008). Visual pursuit of an oscillating target is supported by both sensory and non-sensory information that includes prediction and memory for target movement. Sensory input during visual pursuit reflects retinal slip that derives from relative target to eye movement projected to the retina. Retinal slip signal increases with poorer performance, as the relative target to eye velocity increases when eyes lag behind the target. Thus sensory input to V5 during visual pursuit is to a large extent, function of pursuit performance. Pursuit performance during the fMRI task was poorer, albeit not statistically significant, in the autism group, and thus sensory input to V5 would be likely greater. However, despite the likely greater sensory input, V5 activation was lower in the autism group. Hence, the reduction in V5 activation during the visual pursuit task is not likely to be sensory by nature, but rather is likely to reflect a reduction of top–down non-sensory input to V5. Accordingly, the autism group demonstrated reduced activation in multiple neocortical areas supporting attention and sensorimotor transformations during visual pursuit, including FEF and posterior IPS (Berman et al., Reference Berman, Colby, Genovese, Voyvodic, Luna, Thulborn and Sweeney1999; Dieterich et al., Reference Dieterich, Muller-Schunk, Stephan, Bense, Seelos and Yousry2009). Top–down modulation of these cortical eye fields over visual sensory cortex has been well documented (Heinen, Feredoes, Weiskikpf, Ruff, & Driver, Reference Heinen, Feredoes, Weiskopf, Ruff and Driver2013; Ruff et al., Reference Ruff, Bestmann, Blankenburg, Bjoertomt, Josephs, Weiskopf and Driver2008, Reference Ruff, Blankenburg, Bjoertomt, Bestmann, Freeman, Haynes and Driver2006).
The current data also provide evidence for possible compensatory function during visual sensorimotor control. During visual pursuit, the autism group showed greater activation in the rostral IPS that extended into the superior parietal lobule (SPL), while also showing reduced activation in more posterior aspects of the IPS that is believed to support more basic sensorimotor processes. The SPL is involved in top–down, goal-directed control of smooth pursuit (Burke & Barnes, Reference Burke and Barnes2008), and cognitive control during stimulus evaluation for decision making (Merriam et al., Reference Merriam, Colby, Thulborn, Luna, Olson and Sweeney2001). We previously reported similar findings in which higher-order heteromodal cortex was recruited during basic sensorimotor control to support visually guided saccadic eye movements (Takarae et al., Reference Takarae, Minshew, Luna and Sweeney2007). In the current study, it is possible that enhanced activation in the SPL might represent a compensatory response to disturbances in the afferent projections from the extrastriate cortex to posterior parietal areas.
While our primary research questions concerned neural alterations related to visual motion processing, dependency of visual systems on GABA led us to consider a neurochemical hypothesis about autism. Genetic abnormalities associated with GABAergic systems (Coghlan et al., Reference Coghlan, Horder, Inkster, Mendez, Murphy and Nutt2012) and reduced GABA signaling in several brain regions have been reported in autism (Blatt et al., Reference Blatt, Fitzgerald, Guptill, Booker, Kemper and Bauman2001; Fatemi et al., Reference Fatemi, Halt, Stary, Kanodia, Schulz and Realmuto2002; Oblak et al., Reference Oblak, Gibbs and Blatt2009; Yip, Soghomonian, & Blatt, Reference Yip, Soghomonian and Blatt2007). Patterns of findings in the current study are consistent with predictions from reduced local GABA levels. Increased V5 activation during passive viewing is consistent with observations that administration of GABA antagonists leads to an increase in response amplitude and a reduction in response selectivity at the single cell level (Thiele, Distler, Korbmacher, & Hoffmann, Reference Thiele, Distler, Korbmacher and Hoffmann2004), which would result in a greater number of neurons responding to a given sensory stimulus and, therefore, heightened population level responses. Indirect support for this possibility is provided by recent MRI studies showing a negative relation between local GABA concentrations observed with MR spectroscopy and the amplitude of BOLD responses in visual cortex (Donahue, Near, Blicher, & Jezzard, Reference Donahue, Near, Blicher and Jezzard2011; Muthukumaraswamy, Evans, Edden, Wise, & Singh, Reference Muthukumaraswamy, Evans, Edden, Wise and Singh2012). The shorter persistence of hemodynamic decay we observed, which reflects opponent disinhibition, is also consistent with lower GABA tone. If inhibitory interactions between neurons are reduced, the disinhibition of contra-tuned neurons after adaptation would be also reduced. Consistently, lower GABA levels are associated with a shorter duration of BOLD responses to visual stimuli (Muthukumaraswamy et al., Reference Muthukumaraswamy, Evans, Edden, Wise and Singh2012). Thus, both the higher amplitude and reduced persistence of V5 activation in the present study are consistent with reduced GABA tone in ASD.
We used two visual tasks to investigate brain systems that support visual motion processing and sensorimotor behaviors in autism. We observed dysfunctions involving both local system abnormalities and reduced top–down modulation of visual sensory processing in V5 in autism. Limitations of the current study include small samples consisting of high functioning individuals. As is common in fMRI studies, our sample comprises high functioning individuals because of high compliance requirements during fMRI scans, and the finding may not generalize to the entire autism spectrum. We were also not able to examine how participants’ age might affect our findings due to the small sample size. Because top–down processes are likely to have late developmental trajectories due to greater reliance on frontal cortex maturation than bottom–up processes, understanding how the balance between these processes changes over lifespan and contributes to cognitive phenotypes in ASD, remains uncertain. Future studies clarifying the developmental trajectories of different aspects of sensory and sensorimotor system function may provide important insights into brain maturation alterations and phenotype variations associated with autism.
Results of the current study provide indirect evidence for a functional significance to reduced GABAergic tone in autism. While another potential contributing factor for the effects we report is increased excitatory glutamate-mediated neurotransmission (Jamain et al., Reference Jamain, Betancur, Quach, Philippe, Fellous, Giros and Bourgeron2002), alterations in the balance of excitatory and inhibitory drive might each contribute to heightened sensory sensitivity and to other clinical features of autism, such as the increased incidence of epileptiform abnormalities (Coghlan et al., Reference Coghlan, Horder, Inkster, Mendez, Murphy and Nutt2012; Spence & Schneider, Reference Spence and Schneider2009). Similar ideas have been presented by others (Keita, Mottron, Dawson, & Bertone, Reference Keita, Mottron, Dawson and Bertone2011; Snijders, Milivojecic, & Kemner, Reference Snijders, Milivojevic and Kemner2013). Future studies are needed to directly link sensory problems to biochemical alterations in GABA and glutamate in autism and other neurodevelopmental disorders.
Acknowledgments
This research was supported by an NICHD Collaborative Program of Excellence in Autism (HD35469) and an NICHD Autism Center of Excellence (HD055751), the National Alliance for Autism Research, and an NIH Mentored Research Scientist Development Award (MH087720). Dr. Sweeney serves as a member of advisory boards to Takeda, Lilly, BMS, Roche and Pfizer, and has received support from Janssen that is unrelated to the work presented in this manuscript. The authors report no actual or potential conflict of interest in relation to this manuscript.