INTRODUCTION
Grapevine varieties are long-living, woody perennial plants, which are asexually propagated. Vegetative propagation for many generations allows the appearance and accumulation of somatic mutations, which are the basis for selection of new clones that may exhibit differences in various characteristics such as vigour, berry and cluster weight, yield production, resistance to plagues and diseases and enological potential, among others.
Tools for distinguishing grapevine clones could be very useful to ensure quality management and tracking of grapevine propagation material (Blaich et al. Reference Blaich, Konradi, Rühl and Forneck2007). Clone discrimination was initially attempted using descriptive ampelography (Galet Reference Galet1979), which relies on plant morphological features, as well as isozymes, which target biochemical traits (Schläpfer & Fischer Reference Schläpfer and Fischer1998), without much success. Nowadays, the state-of-the-art methods for clone fingerprinting are based on DNA analysis procedures such as simple sequence repeats (SSR) (Regner et al. Reference Regner, Wiedeck and Stadlbauer2000), amplified fragment length polymorphism (AFLP) (Cervera et al. Reference Cervera, Cabezas, Sanchez-Escribano, Cenis and Martinez-Zapater2000) or random amplification of polymorphic DNA (RAPD) (Regner et al. Reference Regner, Wiedeck and Stadlbauer2000). The discrimination power of these techniques has been very variable in the literature, with both positive (Cervera et al. Reference Cervera, Cabezas, Sanchez-Escribano, Cenis and Martinez-Zapater2000; Imazio et al. Reference Imazio, Labra, Grassi, Winfield, Bardini and Scienza2002; Fanizza et al. Reference Fanizza, Lamaj, Resta, Ricciardi and Savino2005; Wegscheider et al. Reference Wegscheider, Benjak and Forneck2009; Blaich et al. Reference Blaich, Konradi, Rühl and Forneck2007; Cretazzo et al. Reference Cretazzo, Meneghetti, De Andrés, Gaforio, Frare and Cifre2010; Anhalt et al. Reference Anhalt, Martinez, Ruhl and Forneck2011) and negative results (Konradi et al. Reference Konradi, Blaich and Forneck2007; Moncada & Hinrichsen Reference Moncada and Hinrichsen2007) depending on the variety and methodology used. In addition, microsatellites, which are widely used for variety identification, have also been capable of discriminating grapevine clones but only on specific occasions (Silvestroni et al. Reference Silvestroni, Di Pietro, Intrieri, Vignani, Filippetti, Del Casino, Scali and Cresti1997; Kozjak et al. Reference Kozjak, Korošec-Koruza and Javornik2003; Regner et al. Reference Regner, Hack and Santiago2006). These DNA-based methods present problems of repeatability among laboratories and are complex, slow and time-consuming, preventing large-scale use. These drawbacks create the necessity of developing new methods that mitigate these problems in order to make clone discrimination easy and accessible to grape growers. Among the possible new methods for addressing grapevine clone discrimination, the combination of spectroscopy and machine learning techniques, which involves computational processes of discovering patterns in large data sets, is a promising and innovative approach.
Spectroscopy is the analysis of how electromagnetic radiation interacts with matter at different wavelengths. Hyperspectral imaging is a spectroscopic technique that allows gathering information for several hundred wavelength bands on various spatial positions. The radiation that reaches the leaf surface may afterwards be reflected, absorbed or transmitted. The nature and fractions of reflection, absorption and transmission depend on the wavelength of radiation, angle of incidence, surface roughness as well as optical properties and biochemical contents of the leaves (Vogelmann Reference Vogelmann1993). In the present work, only reflectance was used.
The spectral reflectance properties of plant leaves are determined by the absorption and scattering events occurring within the leaf (Grant Reference Grant1987). In the visible range (VIS: 400–700 nm), leaf pigments are the main factors responsible for leaf reflectance, whereas in the near infrared (NIR: 700–1350 nm) and short-wave infrared (SWIR: 1400–3000 nm) ranges, the reflectance signature of leaves is determined by structural processes (leaf morphology) and leaf water content (Peñuelas et al. Reference Peñuelas, Filella, Biel, Serrano and Savé1993), respectively. The transition from low reflectance at VIS to high reflectance at NIR is called the red-edge (Collins Reference Collins1978). Intrinsic differences in the leaf content of pigments among clones of a given species have been reported in previous work (Taylor et al. Reference Taylor, Baker, Owuor, Orchard, Othieno and Gay1992; Conforto et al. Reference Conforto, Bittencourt, Scaloppi and Moreno2011; Lin et al. Reference Lin, Zhang, Yu and Feng2011). Similarly, a histological study of leaves of several clones of cv. Albariño (Vitis vinifera L.) evidenced significant differences in the characteristics and thickness of their spongy mesophyll (Alonso-Villaverde et al. Reference Alonso-Villaverde, Boso, Santiago, Gago, Rodriguez-Garcia and Martinez2011). In this way, the distribution of air spaces and the arrangement and size of cells in the mesophyll have a strong impact on NIR reflectance (Gausman et al. Reference Gausman, Allen, Cardenas and Richardson1970). Leaves having a compact mesophyll layer with fewer air spaces would allow more transmission and less radiation scattering, and would lead to increased NIR reflectance from the adaxial leaf surface (Terashima & Saeki Reference Terashima and Saeki1983; Slaton et al. Reference Slaton, Hunt and Smith2001).
Partial least squares (PLS) is a machine learning regression and classification method. Machine learning is the discipline that studies the development of algorithms that provide machines the ability to automatically learn from new examples. Machine learning and spectroscopy have already been used separately for clone determination. Likewise, machine learning algorithms have been used to distinguish clones from Eastern Cottonwood (Pande Reference Pande2011), grapes (Ferrandino & Guidoni Reference Ferrandino and Guidoni2010) or cocoa (Engels Reference Engels1983) using chemical or morphological features measured through complex and slow methods. Spectroscopic measurements in their turn have been used to distinguish clones of the rubber plant (Osman et al. Reference Osman, Hashim, Al-Junid, Haron, Abdullah, Muhammad, Al-Dabass, Yunus, Ibrahim, Sarbatly and Abraham2010) and jojoba (Gayol et al. Reference Gayol, Labuckas, Nicotra, Oberti and Guzman2009). In the above works, the discrimination power of machine learning was not necessary because clone separation was based on a single feature, such as the maximum reflectance values of plant seeds, in the case of rubber (Osman et al. Reference Osman, Hashim, Al-Junid, Haron, Abdullah, Muhammad, Al-Dabass, Yunus, Ibrahim, Sarbatly and Abraham2010), or the concentration of a specific chemical compound in the case of jojoba (Gayol et al. Reference Gayol, Labuckas, Nicotra, Oberti and Guzman2009). The maximum reflectance values are not discriminative for grapevine clones and the Gayol et al. (Reference Gayol, Labuckas, Nicotra, Oberti and Guzman2009) method requires a conventional calibration to determine the chemical compounds concentration, a calibration which is avoided with the new method proposed in the current paper.
The present work proposes an innovative alternative to ampelography, isozyme and DNA analysis for grapevine clone discrimination, consisting of the combination of spectroscopic (hyperspectral imaging) and machine learning algorithms (PLS) to classify grapevine clones using the leaves. Partial least squares was used to create the clone classifier, i.e. the mathematical function that transforms the hyperspectral data into a given ‘clone type identification’. The proposed method aims at discriminating grapevine clones by combining the processing and analysis power of machine learning algorithms with the simplicity of gathering sample information using portable spectroscopes.
METHODS AND MATERIALS
Leaf samples
Leaves of grapevines of V. vinifera L. cv. Cabernet Sauvignon were collected on 5 October 2011. A total of 100 leaves from four clones named CS 15, CS 169, CS 685 and CS R5 were collected in the field (Vitis Navarra nursery, Tafalla, Spain) and Bodegas Pago de Larrainzar (Estella, Spain) (Table 1). The leaves, 25 per clone, were collected from 48 different vines, 12 vines per clone, at various maturity stages or shoot node positions, to have a representative set of leaf samples per clone. After collection, the leaves were immediately submerged in deionized water at 10 °C. This was intended to avoid desiccation as well as to bring all the leaves to a similar water status corresponding to fully hydrated leaves with approximately 100% relative water content. The leaves were then transported in portable refrigerators to the University of Rioja and were kept in cold water for 18 h. After this time, each leaf was blotted dry and a 2 cm diameter disc was cut in the apical part of the main lobe. Hyperspectral images of the leaf discs were taken immediately on the adaxial side of the fully hydrated leaf discs.
Designation of Cabernet Sauvignon (V. vinifera L.) clones used in this study and information about their origin and selection

Experimental setup and image acquisition
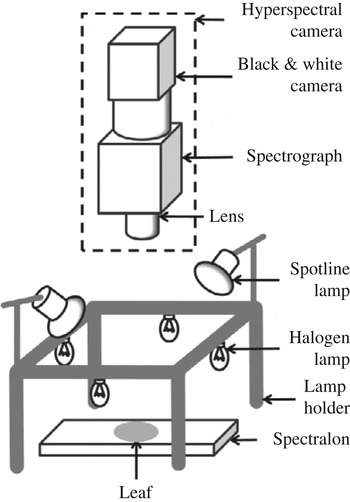
The experimental setup (Fig. 1) was composed of a hyperspectral camera, lighting and a white reference made of Spectralon® (Specim, Oulu, Finland). Spectralon® has the highest diffuse reflectance of any known material or coating over the ultraviolet, visible and near-infrared regions of the spectrum, allowing measurement of the total intensity of light that was incident on the leaf surface. The hyperspectral camera consisted of a JAI Pulnix black and white camera (JAI, Yokohama, Japan) that registered the image and a Specim Imspector V10E (Specim, Oulu, Finland) spectrograph that decomposed the light into its composing wavelengths. The camera also comprised a lens. The black and white camera image size was 1040×1392 pixels. The 1040 pixels corresponded to the same number of wavelength bands from 380 to 1028 nm, with each band being approximately 0·6 nm wide. The 1392 pixels were relative to the spatial dimension and each corresponded to a width of 79 μm.
Experimental setup for hyperspectral imaging of leaves.

In the present work, only the visible and part of the near-infrared regions, between 634 and 759 nm, and corresponding to 201 bands, were used. The wavelength region used was strongly narrowed to facilitate the potential development of cheap dedicated equipment after the current work. Nevertheless, the narrowing could not be too extreme or it would prevent the development of good classifiers due to discarding important information. The region was chosen to include the low red chlorophyll reflectance and the red-edge which constitute important features of the spectral response of vegetation.
For each leaf sample, 30 hyperspectral images were taken. Image acquisition was done using Coyote software (Version 2.2.0, JAI, Japan) at a frequency of eight images per second. The hyperspectral camera was placed at 420 mm from the sample: spectral calibration was performed using the manufacturer procedure (EHE 2006) and spatial calibration using a black and white target. The lighting used comprised four 20 W, 12 V halogen lamps and two 40 W, 230 V reflector lamps from Philips (Spotline, Philips, Eindhoven, The Netherlands). The lamps were chosen to provide the best possible illumination over the wavelength operation range of the hyperspectral camera. They were powered by direct current power supplies to avoid image flickering. The dimensions of the lamps holder were 300×300×175 mm3 (length×width×height). The measurements were done in a dark room at 20 °C.
Reflectance determination
The experimental setup allowed determination of the samples’ reflectance (R). The reflectance spectrum provides the percentage of light that is reflected by a leaf relative to the total intensity of light that is incident on the leaf for each wavelength (λ) measured. In hyperspectral images the reflectances were determined for each spatial position x. Reflectance for a certain position x and wavelength λ was determined according to Eqn (1):
 $$R(x,\lambda ) = \displaystyle{{LI(x,\lambda ) - D(x,\lambda )} \over {SI(x,\lambda ) - D(x,\lambda )}}$$
where LI(x,λ) is the intensity of light coming from the leaf, SI(x,λ) corresponds to the total light intensity that reaches the leaf and D(x,λ) is the camera's dark current. SI(x,λ), the reference for reflectance estimation, was measured using the white reference made of Spectralon®. The dark current was measured with the camera lens covered and corresponds to inherent electronic noise. Its value must be discounted from both the leaf and Spectralon® signals because it is independent from these signals and would distort the real reflectance values. The parameters LI(x,λ), SI(x,λ) and D(x,λ) were calculated from averaging the 30 hyperspectral images per leaf sample to minimize measurement noise. The reflectance values were averaged over all the spatial positions measured on the adaxial sides of the leaf discs. Finally, the values were normalized to a range of 0–1, originating NormR. This way, clone discrimination was based on spectra shape and not on absolute reflectance values. As an input to the classifiers, besides NormR, it was also used the first derivative (NormR (1)) or the second derivative (NormR (2)) of the normalized reflectance. The two derivatives were calculated using the following equations (Butt Reference Butt2010):
 $$NormR^{(1)} = \displaystyle{\matrix{ - NormR_{i + 2} + 8\; NormR_{i + 1} - 8\; NormR_{i - 1} + \; NormR_{i - 2} } \over {12}}$$
 $$NormR^{(2)} = \displaystyle{\matrix{ - NormR_{i + 2} + 16\, NormR_{i + 1} - 30\, NormR_i + 16\, NormR_{i - 1} - \, NormR_{i - 2} } \over {12}}$$
where i is the wavelength at which derivatives are being calculated and i+1 refers to the hyperspectral camera wavelength band after i.
Partial least squares
Partial least squares was used to develop the classifiers that provided a clone class for hyperspectral reflectance spectra of leaves. This method constructs a model that transforms independent variables, in the present case, the leaves reflectance values, or the reflectance derivatives, into a dependent variable, the clone class. It works by transforming the independent variables into a new set of variables that explain to the largest possible extent the covariance between independent and dependent variables (Geladi & Kowalski Reference Geladi and Kowalski1986). A small percentage of new independent variables, relative to the number of initial variables, is usually able to account for most of the variability in the data. The final step consists of a regression providing the coefficients that allow transforming the independent variables into the dependent ones. The number of new variables, also called components, varied from 1 to 79 for each classifier to determine the optimal value which corresponded to the lowest root mean squared error (RMSE) for a validation set.
Quaternary classifiers were created to discriminate the Cabernet Sauvignon (V. vinifera L.) leaves, meaning that a single classifier was capable of discriminating the four clones under study. The classifier inputs were the raw, first derivative and second derivative of the normalized reflectance. The classifiers had four output variables, one for each clone to be identified. Ideally, for a leaf of a certain clone, the classifier output variable assigned to the clone had value one and the remaining variables had value zero. A leaf was attributed to the clone whose corresponding output variable presented the largest value.
All calculations were done using Matlab (Release 2010a, MathWorks, Natick, USA).
Validation
The validation process aimed at verifying that the PLS model was capable of providing good results for data that were not employed in its creation, i.e. that the model was able to generalize. In the present work, the validation method employed was Monte-Carlo cross-validation where multiple training and validation sets were randomly selected from the available data (Arlot & Celisse Reference Arlot and Celisse2010). A PLS model was developed using each pair of training and validation sets; each of these PLS models is called a repetition. In each repetition, a certain leaf spectrum cannot be assigned to both training and validation sets. The final validation result corresponds to the average of the validation results for all repetitions. This method was used due to the natural variability of the leaf features which originated different training and validation results as the training and validation sets composition varied.
The validation of the different types of classifiers’ was done using 100 Monte-Carlo cross-validation repetitions per classifier type. Each repetition used 80 leaves for training and 20 for validation, with each one of the four clones contributing with 20 leaves for training and five leaves for validation.
RESULTS
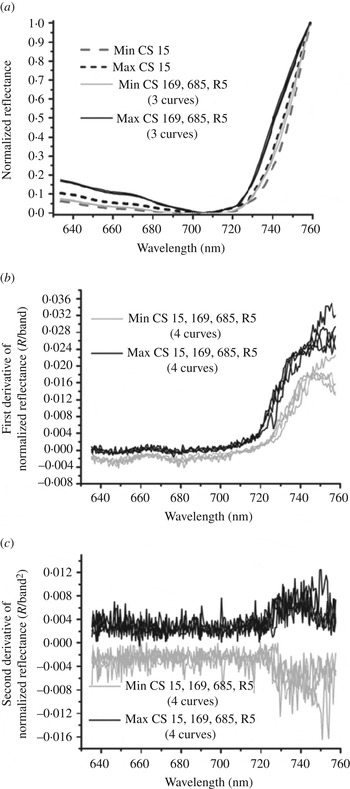
Clone discrimination was based on the differences in the shape, variation and curvature of the normalized reflectance curves. The variation and curvature were calculated using the first and second derivatives of the normalized reflectance, respectively. The minimum and maximum values of the normalized reflectance spectra and of the first and second derivatives of these spectra are depicted in Figs 2(a), (b) and (c), respectively. For practically all the cases shown, the maximum reflectance values for the different clones’ spectra were almost coincident. The same happened with the minimum values. Consequently, there were no strong differences between clones’ spectral signatures, but overlapping among their spectra. Only in the case of the normalized reflectance of CS 15 did the maximum values appear considerably different from those of all the other three clones, but the overlapping still existed. The red-edge was determined for each clone as the maximum values of the first derivative of the non-normalized reflectance spectra in the wavelength region below 800 nm. It was found at 758, 753, 745 and 754 nm for clones CS 15, CS 169, CS 685 and CS R5, respectively.
Envelope (minimum and maximum value) curves containing: (a) the normalized reflectance; (b) the first derivative of the normalized reflectance; and (c) the second derivative of the normalized reflectance. The curves may have the same colour for different clones because the values were similar.

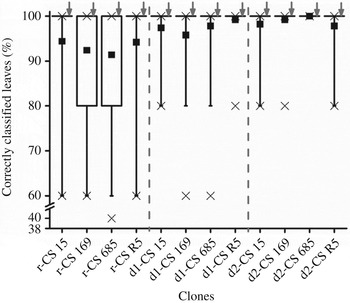
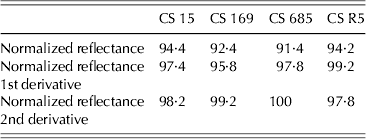
Figure 3 depicts the distribution of percentages of correctly classified leaves in the validation set of 100 Monte-Carlo repetitions. The results are shown for three different classifier inputs, namely, raw, first derivative and second derivative of the normalized reflectance which are designated by the prefixes ‘r’, ‘d1’ and ‘d2’, respectively. A total of 12 box plots are shown in Fig. 3, four per classifier, with each box plot corresponding to one of the clones to discriminate. Table 2 shows the average results of the Monte-Carlo repetitions from Fig. 3. These average results were the final validation results of the classifiers. The results in Fig. 3 and Table 2 showed an improvement in the classification results when the classifier input changed from normalized reflectance to the first derivative and then to the second derivative. Only in the case of CS R5 was the classification percentage better for the first derivative of the normalized reflectance (‘d1-CS R5’) than for the second derivative (‘d2-CS R5’). Overall, the best classifier input was the second derivative of the normalized reflectance because it allowed the best mean classification percentage for the four clones to be obtained. The mean classification percentage for each clone improved as the number of repetitions with correct classification percentages smaller than 100% was reduced. For example, from the 12 box plots, only ‘r-CS 169’ and ‘r-CS 685’ presented 25th percentiles of 80%; for ‘d1-CS 169’ and ‘d1-CS 685’, which showed better mean classification percentages than ‘r-CS 169’ and ‘r-CS 685’, the 25th percentile reached 100%. Another example involved the classifiers whose input was the normalized reflectance. Their 5th percentile whiskers were at a classification percentage of 60% while this percentile was equal to or larger than 80% for the first and second derivatives of the normalized reflectance, which presented better mean results. Using the same rationale it is possible to conclude that the decrease in correct classification percentage from ‘d1-CS R5’ to ‘d2-CS R5’ was caused by a decrease of 5th percentile whisker from 100% down to 80%. The classification percentage median, indicated by the grey arrows, was 100% for all box plots, meaning that 50% of the repetitions yielded correct classification results of 100%. The best classifier input allowed correct classification percentages of 98·2, 99·2, 100, 97·8% for the leaves from clones CS15, CS 169, CS 685 and CS R5, respectively.
Correctly classified leaf percentage for the validation set in the 100 repetitions of the Monte-Carlo cross-validation method for the four clones to be discriminated. The classifiers may have three inputs: (a) the normalized reflectance spectra, prefix ‘r’; (b) the first derivative of the normalized reflectance, prefix ‘d1’; and (c) the second derivative of the normalized reflectance ‘d2’. The box represents the 25th, 50th and 75th percentiles, while the whiskers represent the 5th and 95th percentiles. The crosses stand for the 1st and 99th percentiles and the minimum and maximum values. When the 1st or 99th percentile coincides with the minimum and maximum values, respectively, only one cross is visible. The dark square represents the mean value. The arrows point to the median line.

Mean percentage of correctly classified leaves in the validation sets of the Monte-Carlo cross-validation method
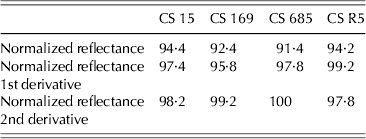
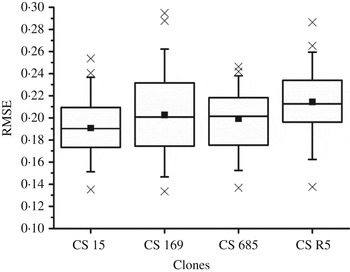
Figure 4 shows the distribution of the root mean squared error (RMSE) values obtained in the validation sets for the 100 repetitions of the Monte-Carlo cross validation. Results are shown only for the classifiers with the best input, the second derivative of the normalized reflectance. Figure 4 shows four box plots, each one corresponding to an output variable of the classifier and to the clone associated with the variable. The correspondence between the output variable and the clone is pertinent because, for example, when the first output variable presented a value close to one there was a high probability that the leaf belonged to clone CS 15. From these results it can be observed that it was harder to determine whether a leaf belonged to clone CS 169 or CS 685 than to clone CS 15. In addition, CS R5 was the clone to which leaf allocation was hardest, as the RMSE mean value for CS R5 was the largest and close to 0·21. The 75th percentile of the RMSE was smaller than 0·24 for all box plots and the largest RMSE was smaller than 0·3; these values are relatively small when considering that the optimal values, of the classifier output variable, for belonging or not to a clone are one and zero, respectively. Consequently, the classifier output values were relatively far from the midway value of 0·5 which could lead to unreliable classification.
Box plot of the RMSE for the validation set in the 100 repetitions of the Monte-Carlo cross-validation method. These results are relative to the four output variables and corresponding clones of the classifiers whose input was the second derivative of the normalized reflectance. The box represents the 25th, 50th and 75th percentiles, while the whiskers represent the 5th and 95th percentiles. The crosses stand for the 1st and 99th percentiles and the minimum and maximum values. When the 1st or 99th percentile coincides with the minimum and maximum values, respectively, only one cross is visible. The dark square represents the mean value.

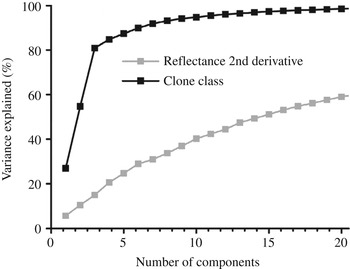
Figure 5 shows the variance of the second derivative of the normalized reflectance and of the clone classes, in the whole sample set, that is explained by the PLS components. Considering the second derivative, with 20 components, only 59% of the variance was explained. The amount of variance explained increased slowly with the number of components. With respect to the clone class, the same 20 components explained 98·5% of the variance. Only three components explained 80·9% of the variance and nine components were necessary to explain 94·1%. For more than nine components, the curve increased at a lower rate than for less than nine components.
Variance of the second derivative of reflectance and of the clone class, in the whole sample set, that is explained by the PLS components.

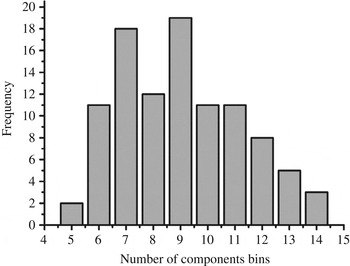
The distribution of the best number of components in the 100 Monte-Carlo repetitions carried out for the classifiers with the best input, the second derivative of the normalized reflectance, is presented in the histogram of Fig. 6. The mean value of components was nine and this value had the largest frequency; however, seven components presented only a slightly smaller frequency. There were no classifiers with more than 14 components. With nine components, only 36·9% of the variance of the second derivative of the normalized reflectance was explained. However, this unusually small percentage was enough to create classifiers that presented large correct classification percentages. The small number of components relative to the number of training samples, which was 80, helped the classifier to have good generalization ability.
Histogram of the best number of components in the 100 Monte-Carlo cross-validation repetitions for classifiers whose input was the second derivative of reflectance.

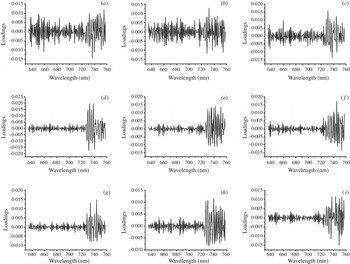
Figure 7 depicts the loadings of the PLS components of the whole data set when the input was the second derivative of the normalized reflectance. These loadings show the importance of each wavelength to the classification model. Figure 7 shows the loadings of nine components which were the average values of components employed by the classifiers. The variation in loading values from one wavelength to the next was most probably caused by the variation in the values of the second derivative of the normalized reflectance. In the first and second components (Fig. 7(a, b)) there were peaks over the whole wavelength range whereas in the third component (Fig. 7(c)) the loadings for wavelengths smaller than 720 nm became smaller than the loadings for wavelengths larger than 720 nm. This tendency was more evident for the loadings of components four to nine (Fig. 7(d to i)). The loadings for wavelengths between 640 and 670 nm and between 720 and 759 nm stood out, which suggests that these wavelengths were particularly useful for clone discrimination. Nevertheless, mainly in the first three components, the whole range between 634 and 759 nm was employed in the components formation and was relevant to the classification model.
Loadings of the PLS components for the whole sample set when classifier input was the second derivative of the normalized reflectance. Component rank: (a) first; (b) second; (c) third; (d) fourth; (e) fifth; (f) sixth; (g) seventh; (h) eighth; (i) ninth.

DISCUSSION
Leaf spectral reflectance data, which contains information regarding differences in leaf traits, have been employed in species discrimination (Castro-Esau et al. Reference Castro-Esau, Sánchez-Azofeifa and Caelli2004; Asner et al. Reference Asner, Jones, Martin, Knapp and Hughes2008; Sánchez-Azofeifa et al. Reference Sánchez-Azofeifa, Castro, Wright, Gamon, Kalacska, Rivard, Schnitzer and Feng2009; Burkholder et al. Reference Burkholder, Warner, Culp and Landenberger2011; Durgante et al. Reference Durgante, Higuchi, Almeida and Vicentini2013) and may also potentially contribute to clone differentiation within a given genotype. In grapevines, Lacar et al. (Reference Lacar, Lewis and Grierson2001) and Ferreiro-Armán et al. (Reference Ferreiro-Armán, Da Costa, Homayouni and Martin-Herrero2006) showed the feasibility of spectral imaging on leaves to discriminate successfully among grapevine varieties. Varietal discrimination of grapevines by spectroscopy is an important achievement, but the possibility of clone discrimination within a given grapevine variety from spectral imaging of leaves would be one step forward. In the present study, the discrimination of a Cabernet Sauvignon clone based on leaf spectroscopy in the visible and near-infrared range, among a group of four different clones, was achieved with a percentage of correct classification which exceeded 97·8% for the four tested clones, CS 15, CS 169, CS 685 and CS R5.
The wavelength range employed for the classifiers creation was reduced markedly (between 634 and 759 nm) to facilitate the potential subsequent development of cheap, dedicated equipment for clone discrimination at a commercial level. This is possible because the narrow range allows equipment complexity to be reduced and the chosen wavelength values may facilitate the development of good lighting at low cost as well as the use of efficient and cheap light sensors. The wavelength range used covered part of the red reflectance region, characterized by large absorption by chlorophylls (from 634 to 690 nm) and the red-edge, typically occurring at wavelengths between 690 and 740 nm depending on leaf surface variability (M. Dockray, personal communication). The use of the chlorophyll absorption region was pertinent because intrinsic differences in the leaf content of pigments among clones of a given species have been reported in previous works on the tea plant (Taylor et al. Reference Taylor, Baker, Owuor, Orchard, Othieno and Gay1992), rubber tree (Conforto et al. Reference Conforto, Bittencourt, Scaloppi and Moreno2011) and camphor tree (Lin et al. Reference Lin, Zhang, Yu and Feng2011). The red-edge was an interesting region because it was where the normalized reflectance values presented the largest variance, when the whole wavelength range between 380 and 1028 nm was considered. The first and second derivatives of the normalized reflectance also presented considerable variances at the red edge. In fact, the loadings for classifiers with the second derivative of the normalized reflectance as an input were larger at the red-edge region than in the remaining wavelengths in the range between 634 and 759 nm. The red-edge position varied for the four Cabernet Sauvignon clones studied, being found between 745 and 758 nm, probably because increased chlorophyll concentration shifted the red-edge to longer wavelengths (M. Dockray, personal communication). In view of all this, the range used in classifier creation puts focus on the influence of chlorophyll over the reflectance spectra. However, since the transition at the red-edge from chlorophyll absorption to within-leaf scattering is not abrupt, the developed classifiers probably also considered some information regarding the scattering.
Some of the identified sources of spectral variability include leaf age, adaxial and abaxial leaf surfaces, sun exposure and water content (Ribeiro da Luz Reference Ribeiro Da Luz2006). From these, the first three factors would be more important in the visible range than the leaf water content. However, with the aim of avoiding any interference from differential leaf hydration status, all sampled and imaged leaves were taken to full hydration and since all images were taken from the adaxial sides, no spectral variability due to the leaf surface side was expected. Regarding leaf age and sun exposure, for each clone leaves were collected at different node positions from the basal to the apical parts of the shoots and at both sides of the canopies, in order to cover a wide range of spectral variability within a given clone and help to increase the generalization ability of the classifiers created.
The combination of the second derivative of the normalized reflectance was highly efficient in extracting the information necessary for clone discrimination. In fact, the normalized reflectance, as well as its first derivative, seemed to contain spurious information that was ‘confusing’ the classifiers and lowering their classification efficiency. Moreover, the small percentage of variability from the second derivative of the normalized reflectance, 39·6%, that was necessary to create highly efficient classifiers also suggests that much of the information contained in the leaf reflectance is not important to distinguish the four clones. However, it is possible that the information that was not useful to discriminate the clones in the current analysis may be relevant for discriminating other clones. The low dispersion of classification percentage results in the validation sets from the Monte-Carlo repetitions suggests that the classifiers created are robust.
The results obtained in the present work evidence the potential capability of local spectroscopy combined with PLS techniques to successfully discriminate among clones of a given grapevine variety. Though preliminary, the results are completely innovative and promising, and constitute the starting point for further research involving increased number of clones per given variety, increased number of varieties and growing sites, in order to create a wide and more complete database of classifiers. This database could be further implemented for commercial purposes, providing the grape and wine industry, including nurseries, wineries, grape growers and suppliers with an automatic, fast, environmentally friendly (solvent-free) and reliable tool for grapevine clone discrimination.
CONCLUSIONS
The present work suggests that it is possible to discriminate among grapevine leaves of different clones of Cabernet Sauvignon (V. vinifera L.) variety by using PLS to analyse hyperspectral imaging data taken in a narrow range of the visible and near-infrared spectrum. This narrow range, which includes strong chlorophyll absorption and the red-edge, was used to facilitate the future development of affordable dedicated spectroscopes. Although further research including more clones per variety, increased number of grapevine varieties and sites is needed, the results obtained in this work seem to warrant the use of this new method based on leaf spectroscopy and PLS analysis for grapevine clone discrimination.
Armando Fernandes acknowledges an Auxiliary Researcher contract from program ‘Ciência 2008’. This work is part of the research project Hyper (PTDC/EEA-AUT/121056/2010) from the Fundação para a Ciência e Tecnologia.
This work was supported by European Union Funds (FEDER/COMPETE – Operational Competitiveness Programme) and by national funds (FCT – Portuguese Foundation for Science and Technology) under the project FCOMP-01-0124-FEDER-022692.