

Using human brain imaging to understand the neural basis of behavior
The development of magnetic resonance imaging (MRI) technology since the early 1990s has led to rapid advances in mapping the human brain at high spatial resolution using noninvasive methods. Although significant progress has been made in mapping the functions of different brain regions, linking this understanding of basic brain organization to the fine-grained local computations that underlie complex human behaviors remains a core challenge in neuroscience. Here we discuss the potential for these methods to contribute to understanding the links between perceptual and physiological states within Teller’s linking hypothesis framework (Teller & Pugh, 1983; Teller, 1984). Exploiting brain imaging methods necessitates bringing to mind an additional set of linking hypotheses between the measurement signals and the underlying patterns of cortical activity than those originally discussed by Teller and Pugh (1983). In particular, noninvasive brain imaging methods (e.g., fMRI: functional magnetic resonance imaging) involve remote sensing that aggregates the activity of large populations of neurons. Such transforms of neural activity complicate the mapping between perceptual states and their physiological basis. Although these issues are present—at least in some form—for direct measures of neural activity, and further complicated when making comparisons between species, the indirect nature of the measurements used in human brain imaging makes it important to understand the constraints imposed on linking neural activity to behavior. Moreover, within Teller’s framework, we can frame the notion of equivalence classes in neural responses and their measurement via imaging techniques. In particular, it is possible that different sensory inputs might evoke the same neuronal responses, but it is also quite possible that a measured equivalence between inputs is “apparent” in that the measurements are insufficiently differentiable to reveal different underlying neuronal states. This is a familiar problem in psychophysical research that has long grappled with the possibility that equivalent performance on a particular task (for instance, judgments of distance) does not preclude different underlying perceptual states (e.g., depth evoked by different combinations of cues).
fMRI relies on the link between neuronal activity and changes in blood flow in the brain. Such hemodynamic changes (and in particular changes in blood oxygenation) that underlie the blood oxygenation level-dependent (BOLD) response are linked to changes in neuronal activity in an indirect manner. In particular, the chain of events that changes BOLD in response to the metabolic demands of neuronal activity is a complex one involving a cascade of processes (increased synaptic activity, changes in glucose consumption, increase in venous blood volume, and changes in magnetic susceptibility that can be contrasted for BOLD) that are not fully understood (Heeger & Ress, Reference Heeger and Ress2002). Moreover, BOLD changes caused by the metabolic requirements of neurons are slow in relation to neuronal activity, typically taking 4 to 6 s after changes in neuronal activity.
Further uncertainty surrounds the neuronal events that give rise to BOLD changes. In particular, the fMRI signal almost certainly not only reflects the firing rates of very large numbers of neurons but is likely to include subthreshold (nonspiking) activity, pooled excitatory and inhibitory neural signals and feedback from higher portions of the processing stream (Logothetis et al., Reference Logothetis, Pauls, Augath, Trinath and Oeltermann2001; Mukamel et al., Reference Mukamel, Gelbard, Arieli, Hasson, Fried and Malach2005; Viswanathan & Freeman, Reference Viswanathan and Freeman2007). Using Teller’s terminology, there is a large equivalence class of fMRI responses in that the same BOLD response could be evoked by large changes in a small number of active neurons or small changes in a large number of neurons (Scannell & Young, Reference Scannell and Young1999). Although BOLD responses to sensory stimuli are thought to follow reliably from the linear summation of neural signals across space and time (Boynton et al., Reference Boynton, Engel, Glover and Heeger1996), the relationship between changes in neuronal activity and changes in BOLD may reflect a complex nonlinear function: small changes in activity may evoke large changes in BOLD, but responses may become saturated at higher response levels, such that changes in neuronal activity based on changes in blood oxygenation become difficult to measure (Miller et al., Reference Miller, Luh, Liu, Martinez, Obata, Wong, Frank and Buxton2001). Further, task-related components (e.g., anticipation, awareness, and attention) introduce nonlinear influences that disrupt the correspondence between BOLD and neural activity (Boynton, Reference Boynton2011; Cardoso et al., Reference Cardoso, Sirotin, Lima, Glushenkova and Das2012).
Despite these concerns, there appears to be a reasonable range over which stimulus-evoked BOLD responses can be characterized using a linear transducer function that assumes fMRI signals reflect the local average of neuronal activity. For instance, Boynton et al. (Reference Boynton, Engel, Glover and Heeger1996) tested the dependence of visually evoked BOLD responses on the (a) presentation duration and (b) stimulus contrast, finding evidence that these dimensions are separable and importantly that hemodynamics are similar at different contrast levels. Thereafter, Boynton et al. (Reference Boynton, Demb, Glover and Heeger1999) were able to test for similarities (i.e., Tellerian analogies) between fMRI-measured contrast response functions and psychophysical contrast increment thresholds. By systematically varying stimulus contrast, they were able to show similarities between the contrast response functions in early visual areas and psychophysical judgments of contrast increments. This link between activity in early portions of the visual processing stream and psychophysical task performance was further strengthened by Ress and Heeger (Reference Ress and Heeger2003), who contrasted fMRI responses evoked while participants performed a demanding contrast-detection task. They found that higher fMRI responses were evoked when participants reported detecting a target, whether the target was present or not. Specifically, BOLD responses were higher when the target was presented and detected (i.e., a “hit”), and when the signal was absent, but the participant reported seeing it (i.e., a “false alarm”); by contrast, “correct rejections” (stimulus absent, reported to be absent) and “misses” (stimulus present but not reported) gave rise to lower responses. This result is particularly elegant in within Teller’s framework (Teller, 1984) in that it provides an illustration of a case in which the same perceptual state (e.g., believing a target is present) is associated with similar fMRI responses (i.e., a converse proposition), as well as demonstrating that different perceptual states give rise to different responses, despite the physical similarity of the viewed stimulus (i.e., a contrapositive proposition).
Thus, despite important caveats on the uncertainty of the mapping between neuronal activity and fMRI measurements in particular, and brain imaging signals more generally, manipulations of simple sensory features (e.g., contrast), whose physiological bases have been studied extensively, provide good reasons to believe that these methods provide a basis from which relationships between physiological and psychological states can be tested. From this foundation, we review work that has sought to understand the link between human neuronal activity and perception for higher-level visual features. We focus on studies using methodological approaches (i.e., fMRI adaptation, multivoxel pattern classification) that are thought to be more sensitive than conventional fMRI analysis methods to weak, but informative, brain signals related to neural preference. We compare fMRI signals revealed by these methods to behavioral performance to test for links (analogies) between human brain signals and behavior. To illustrate these links, we review studies examining the link between (1) brain activity and 3D perception, (2) brain plasticity and visual learning.
Linking fMRI responses to the perception of 3D shapes
Understanding the neural basis of mid-level visual processes requires the careful selection of stimulus conditions as part of the fMRI design. In particular, identifying particular aspects of functional processing requires that we can identify a contrast between different conditions. In practice, it can be very difficult to find such a contrasting stimulus, so forms of spatial scrambling of the image features are often employed (e.g., Kanwisher et al., Reference Kanwisher, Chun, McDermott and Ledden1996; Georgieva et al., Reference Georgieva, Todd, Peeters and Orban2008). This approach has been successful when localizing cortical activity related to high-level visual features; however, low-level image differences can constitute a concern. For example, do responses in a particular area relate to the aspect we would like to study (e.g., 3D shape from shading)? Or is contrasting activity evoked because the different stimuli differ in their low-level statistics? If low-level image features differ between “depth” and “nondepth” stimuli, it can be difficult to determine whether an fMRI response relates to low-level feature differences or the depth percept (see Georgieva et al., Reference Georgieva, Todd, Peeters and Orban2008 for a systematic investigation of lower-level image changes related to shading cues).
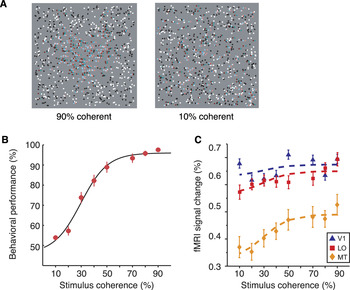
An alternative approach is to make parametric stimulus manipulations and evaluate changes in the fMRI response to look for similarities between changes in the fMRI response and psychophysical judgments (Chandrasekaran et al., Reference Chandrasekaran, Canon, Dahmen, Kourtzi and Welchman2007; Georgieva et al., Reference Georgieva, Peeters, Kolster, Todd and Orban2009). Chandrasekaran et al. (Reference Chandrasekaran, Canon, Dahmen, Kourtzi and Welchman2007) used such an approach to investigate the perception of 3D shape defined by disparity. In particular, they presented observers with random dot patterns (Fig. 1a) to ensure that the 3D structure of the display was only apparent after global binocular correspondence had been established. To test for cortical areas whose activity related to processing of disparity signals for 3D shape perception, shapes were systematically degraded to measure the effects on both fMRI response and perceptual discrimination. Specifically, the spatial integrity of the disparity-defined shapes was parametrically manipulated by randomly relocating the spatial positions of dots with a given disparity in the display (Fig. 1a). This affected observers’ performance in judging the global 3D shape (Fig. 1b) while keeping the overall histogram of dot disparities unchanged.
Linking fMRI and behavioral judgments of 3D shape. (A) Stimuli: RDS of a 3D shape at different levels of spatial coherence (90%, 10%) for use with red–green anaglyph glasses. RDS provide a means of isolating disparity signals from monocular cues to shape. Manipulating the spatial coherence of the disparities in the shape makes it harder to see the global 3D shape depicted. (B) Psychometric function showing performance in judging the properties of the 3D shape (here it is axis of symmetry: horizontal vs. vertical) as a function of stimulus coherence. (C) fMRI responses in three representative areas of interest (V1, MT, and LO) as a function of stimulus coherence. The psychometric function shown in part B is scaled to fit the fMRI response.

The experimental logic of the study of Chandrasekaran et al. was that reliable perceptual judgments of disparity-defined shape would be associated with strong fMRI responses in areas that encode disparity signals for 3D shape. The study demonstrated different patterns of results in different cortical areas. In particular, responses in early visual areas were largely unaffected by the manipulation of shape coherence (Fig. 1c). This suggests a local processing of disparity signals in early areas that is blind to the global coherence of the shape. In contrast, responses in higher ventral (lateral occipital: LO) and dorsal (hMT+/V5) areas increased significantly as the shapes became more coherent, suggesting the encoding of more extensive surfaces important for shape judgments. Further support for a link between activity in these areas and perceptual judgments of 3D shape was provided by significant correlations between individual observers’ psychophysical judgments and individual mean fMRI responses. While correlating average perceptual judgments with mean fMRI responses suggests a link between neural activity and behavior, this coupling is more compelling if provided on a trial-by-trial basis. The approach of exploiting between-trial variation is well established in macaque electrophysiology (Britten et al., Reference Britten, Shadlen, Newsome and Movshon1992), and was adopted by Chandrasekaran et al. for the analysis of a subset of fMRI responses. In particular, they asked whether it was possible to determine the 3D shape viewed by a participant based only on fMRI responses within a particular area of cortex. Using the distributions of fMRI responses obtained across trials for different types of 3D shape (horizontal vs. vertical axis of symmetry), they computed receiver operating characteristic (ROC) curves, revealing fMRI responses diagnostic of the viewed shape in cortical areas V3, V3B/KO, hMT+/V5, and LO. This analysis did not allow them to dissociate the stimulus from its perceptual interpretation (Bradley et al., Reference Bradley, Chang and Andersen1998), as wholly ambiguous stimuli were not employed. However, the idea of predicting the viewed stimulus, given only the fMRI response, has been explored further in subsequent work using machine learning fMRI data analysis, which we return to below.
fMRI measurement and analysis—unpicking apparent “equivalence classes” in responses
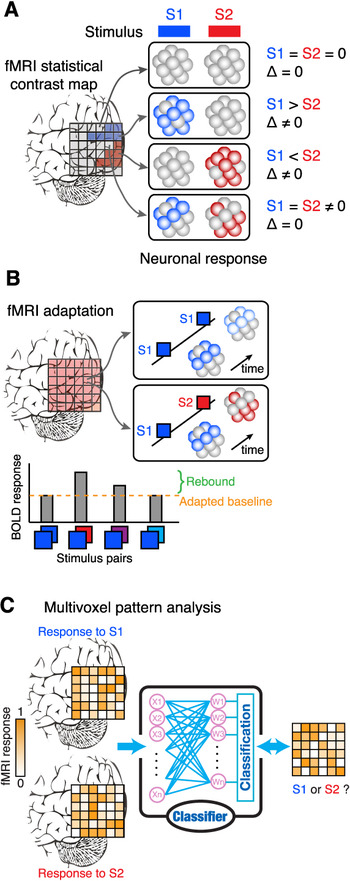
fMRI measurements are crude in relation to the underlying neural responses that they seek to quantify. Basic units of measurements (fMRI voxels) are typically 3 × 3 × 3 mm in size and therefore pool the activity of (at least) hundreds of thousands of individual neurons. This limited measurement resolution means that the neuronal responses evoked by two different classes of stimuli may be equivalent at the fMRI measurement level but clearly separable at the scale of individual neural responses (Fig. 2a). For instance, consider the problem of identifying whether a visual area responds to two different cues (disparity and motion) on the basis of processing each cue separately or conjointly (Preston et al., Reference Preston, Kourtzi and Welchman2009; Ban et al., Reference Ban, Preston, Meeson and Welchman2012). The two cues might be processed by independent neuronal populations that lie within the same fMRI voxel. By averaging the responses of these subpopulations, the voxel response might appear identical when the different depth cues are presented. This could be taken to suggest a convergence of depth signals, when in actuality, information is processed in parallel and follows different routes through the cortex (Ponce et al., Reference Ponce, Lomber and Born2008). Thus, there might be an apparent equivalence class in that fMRI measurements give rise to similar patterns of activity, but actually the physiological basis of that activity differs (see Ban et al., Reference Ban, Preston, Meeson and Welchman2012 for a means of separating these different hypotheses for this example).
Illustrations of the potential for apparent equivalence in responses at the fMRI voxel level. (A) Illustration of the standard fMRI contrast analysis approach. Four different scenarios are presented for the response of neuronal populations within an individual voxel (represented as a cluster of spheres) to two different stimuli: S1 and S2. Scenario 1: the neuronal population does not respond to either stimulus, so a contrast (correctly) suggests no differential activity. Scenario 2, 3: the neuronal population responds preferentially to S1 or S2 respectively, with the fMRI contrast revealing these differential selectivities. Scenario 4: the voxel contains a mixed population—some neurons respond to S1 and some to S2; the response of the voxel to both stimulus classes means the contrast yields no difference, a result that is identical to scenario 1. (B) The fMRI adaptation approach can help identify mixed populations within individual voxels. The logic is that presenting the same stimulus twice will evoke a lower neuronal response, and therefore lower BOLD response, relative to presenting two different stimuli that stimulate different neuronal populations. This rebound effect can be used to index the way in which the underlying neuronal population encodes stimulus information: different stimuli that are encoded by the same populations will give rise to a minimal rebound effect. (C) The multivoxel analysis approach. Information about the stimulus is distributed across the pattern of responses of individual voxels: some voxels will show similar responses to the different stimuli, others will give rise to subtly different responses. The machine learning algorithm learns which features are informative in separating the two stimulus classes. Once trained, the classifier is tested by predicting the stimulus for a voxel pattern that it was not trained on. The prediction performance of the classifier is typically used to index the amount of information about the stimulus that is contained in the pattern of voxel responses.

One means of addressing this potential for apparent equivalence between responses is to alter the fMRI design to maximize sensitivity to different responses by subpopulations. One approach to doing this is based on the logic of neural adaptation and repetition suppression effects whereby neural activity is lower for stimuli that have been viewed recently than for stimuli that have not (Grill-Spector & Malach, Reference Grill-Spector and Malach2001; Kourtzi & Kanwisher, Reference Kourtzi and Kanwisher2001). In particular, the premise of this approach is that showing the same stimulus twice (“test–test”) results in an adapted fMRI response, while pairing the test stimulus with a stimulus that engages a different set of neurons (“test-comparison”) will not produce an adapted response (Fig. 2b). The difference in the fMRI response between these two conditions (“the rebound effect”) thus acts as an index of the sensitivity of the underlying neural population to differences between the test and comparison stimuli. Although the direct link between fMRI adaptation and neural selectivity is complicated by the complexity of the BOLD signal (Krekelberg et al., Reference Krekelberg, Boynton and van Wezel2006; Sawamura et al., Reference Sawamura, Orban and Vogels2006), adaptation has been a useful tool for discerning large neural populations as revealed by fMRI (Grill-Spector & Malach, Reference Grill-Spector and Malach2001; Grill-Spector et al., Reference Grill-Spector, Henson and Martin2006).
For example, imagine presenting a 3D shape defined by disparity and motion. If an area responded to the information specified individually by disparity and motion, we would have expected a rebound effect whereby changes in the component cues gave rise to higher fMRI responses. In contrast, an area that encoded 3D shape would show no rebound effect if changes in the individual cues were such that the impression of 3D shape remained constant. Welchman et al. (Reference Welchman, Deubelius, Conrad, Bülthoff and Kourtzi2005) used such an approach to study 3D shape from disparity and perspective information, introducing small differences between the individual cues to effect changes in individual cues and changes in the estimate of shape based on combined cues. Thereby, they were able to demonstrate responses in higher ventral area Lateral Occipital Complex (LOC) that related to the 3D shape based on integrated cues. Based on the small differences between the presented stimuli, an approach based on simply contrasting fMRI responses from different conditions would have been unlikely to be sufficiently sensitive.
A second approach to resolving the potential for mistaken equivalence between measured responses is based on adopting more sensitive fMRI analysis methods. In particular, data treatment often involves fairly extensive spatial smoothing, exacerbating the problem of differentiating the convergence of signals from separate encoding by independent neuronal subpopulations described above. Moreover, fMRI activity within a particular region of cortex is often treated as equivalent, and thus quantified on the basis of the grand average (i.e., univariate) response. Adopting multivariate analysis methods for fMRI data (Cox & Savoy, Reference Cox and Savoy2003; Haynes & Rees, Reference Haynes and Rees2006; Norman et al., Reference Norman, Polyn, Detre and Haxby2006) is therefore useful in allowing a finer-scale analysis of fMRI data that can differentiate responses that would appear equivalent based on average responses across a cortical area (Fig. 2c). There is an ongoing debate about the origin of the preferences that are exploited by multivoxel pattern classification analysis (MVPA) approaches, with contributions likely from random spatial irregularities in fine columnar maps (Swisher et al., Reference Swisher, Gatenby, Gore, Wolfe, Moon, Kim and Tong2010) as well as coarser scale signals that reflect the systematic (i.e., retinotopic) organization of stimulus responses to properties such as orientation and motion direction (Raemaekers et al., Reference Raemaekers, Lankheet, Moorman, Kourtzi and van Wezel2009; Freeman et al., Reference Freeman, Brouwer, Heeger and Merriam2011; Beckett et al., Reference Beckett, Peirce, Sanchez-Panchuelo, Francis and Schluppeck2012). This debate reflects the complex correspondence between BOLD and neural selectivity (Kriegeskorte et al., Reference Kriegeskorte, Cusack and Bandettini2010) and emphasizes the importance of work comparing directly physiology to imaging signals. Nevertheless, these techniques have increased the analysis sensitivity to help unpick apparent equivalence classes of responses.
Decoding approaches to test the link between fMRI responses and the perception of depth from disparity
Understanding the link between physiological responses and perceptual processes represents a considerable challenge for visual features that are encoded in a widespread manner in the visual cortex. For instance, neurons sensitive to binocular disparity information have been found throughout visual, temporal, and parietal regions (Cumming & DeAngelis, Reference Cumming and DeAngelis2001; Orban et al., Reference Orban, Janssen and Vogels2006; Parker, Reference Parker2007), making it a challenge to determine the functional significance of such widespread representations.
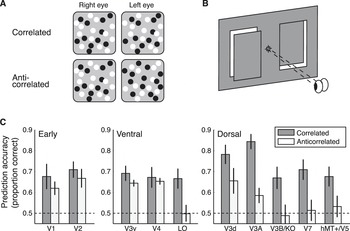
Using the multivoxel analysis approach, Preston et al. (Reference Preston, Li, Kourtzi and Welchman2008) sought to test the relationship between fMRI responses and the perception of disparity-defined depth, using a simple low-level stimulus manipulation. In particular, they rendered depth planes with different disparities in random dot stereograms (RDS) and altered the visibility of the disparity-defined form by manipulating the contrast of the dots presented to the two eyes (Fig. 3a). In cases where the contrast of the dots presented to each eye was the same (correlated RDS: a white dot in the left eye matches a white dot in the right eye), observers had no difficulty in determining the depth position of a target plane. However, reversing the contrast of dots in the two eyes (anticorrelated RDS: a black dot in the left eye matches a white dot in the right eye) abolished the perception of disparity-defined depth (Cogan et al., Reference Cogan, Kontsevich, Lomakin, Halpern and Blake1995; Cumming et al., Reference Cumming, Shapiro and Parker1998). Nevertheless, the disparity information contained in anticorrelated RDS stimuli is encoded by neurons in primary visual cortex of the macaque (Cumming & Parker, Reference Cumming and Parker1997). This simple manipulation therefore provided a tool with which to identify responses to binocular disparity that were analogous to perceptual judgments (see also Bridge & Parker, Reference Bridge and Parker2007 and Cottereau et al., Reference Cottereau, Mckee, Ales and Norcia2011, Reference Cottereau, McKee, Ales and Norcia2012).
Decoding disparity signals contained in correlated and anticorrelated RDS. (A) An illustration of correlated random dot patterns (white dots match with white dots between the two eyes, and black dots with black dots) and anticorrelated patterns (white dots match with black dots and vice versa). Free-fusing the stereopairs (by crossing the eyes) yields the impression of a central square region in front of a background for the correlated pattern only; depth is incoherent for the anticorrelated pattern. (B) An illustration of the crossed versus uncrossed disparity configuration used in the study by Preston et al. (Reference Preston, Li, Kourtzi and Welchman2008). (C) The pattern of decoding accuracies across visual cortex for correlated and anticorrelated disparity stimuli. The bar graphs represent the prediction accuracy of the classifier, where chance is at 0.5 (binary classification task). Error bars show SEM.

Preston et al. (Reference Preston, Li, Kourtzi and Welchman2008) manipulated stimulus correlation to test for areas that contained information about depth structure only when observers could perceive the disparity-defined structure of the stimuli. They investigated a basic property of disparity encoding: whether a target is positioned near (crossed disparity) or far (uncrossed disparity) with respect to the fixation point (Fig. 3b). Measuring the fMRI responses evoked by crossed versus uncrossed disparities using both correlated and anticorrelated stimuli allowed them to determine which cortical areas represent disparity signals that are constrained by matching features with the same luminance contrast between the eyes. Based on results from neurophysiology, neurons sensitive to crossed and uncrossed disparities are closely colocated within cortex (DeAngelis & Newsome, Reference DeAngelis and Newsome1999). Therefore, a standard fMRI analysis that compared responses to targets in front of versus behind the fixation point would be unlikely to yield reliably different responses as neurons selective to near and far stimuli would be colocated within the same voxels. Thus, Preston et al. designed their study for multivariate data analysis and trained a support vector machine (SVM) to associate the pattern of fMRI responses evoked by RDS that depicted depth positions behind or in front of the fixation plane. Then, using an independent data set, they tested how well the SVM classifier could determine what the participant had been looking based on their fMRI data (Fig. 2c). The classifier’s performance in discriminating whether the subject had viewed a near or far stimulus thus provided an index of the information contained in a particular region of cortex.
Decoding accuracies suggested a differential pattern of responses for correlated and anticorrelated stimuli across the visual hierarchy. The classifier’s ability to predict the viewed stimulus was significantly above chance across the visual cortex when subjects viewed correlated stimuli (Fig. 3c). This is consistent with previous imaging and neurophysiological data that shows disparity-selective responses widespread throughout cortex. However, the same was not true for anticorrelated stimuli. In early visual areas, the classifier could also decode the disparity signals contained in anticorrelated stimuli. This is consistent with electrophysiological recordings in suggesting dissociation between early cortical responses and the perception of disparity-defined depth (Cumming & Parker, Reference Cumming and Parker1997). Results in higher areas were somewhat surprising in that activity in intermediate areas in the ventral stream (V3v, V4), such as early visual cortex, supported similar decoding performance for correlated and anticorrelated stimuli. In contrast, responses in higher ventral LO area supported significant decoding of correlated, but not anticorrelated, stimuli. This suggests that, like perceptual judgments, responses in LO are selective for binocular matches that involve similar features in the two eyes. This finding is in agreement with neurophysiological recordings in inferior temporal cortex (analogous to LO), where responses to anticorrelated stimuli are not observed (Janssen et al., Reference Janssen, Vogels, Liu and Orban2003).
Preston et al. also found that responses in the dorsal visual cortex supported decoding that was preferential for correlated over anticorrelated responses, indicating multiple loci in which the constraint of binocular matching by contrast similarity is implemented. However, a further experiment in which they manipulated disparity parametrically suggested different types of responses in higher dorsal versus ventral cortex. In particular, their data suggested that dorsal areas had responses that were quite specific to the disparity being viewed, whereas ventral responses were less specific to the particular disparity of the scene, but rather might represent the local stimulus configuration. Thus, responses analogous to perceptual interpretations were widespread, but further testing indicated different forms of representation in dorsal versus ventral visual areas. Reflecting Teller, this highlights the need for multiple explorations of the possible parameter space of responses when seeking to understand the links between measures of human cortical activity and perceptual states.
Linking brain plasticity to human learning
Next, we consider evidence for links between perceptual states and brain responses through studies that show how these can change through learning. Learning is known to result in improved behavioral performance in a variety of perceptual and motor tasks, but what are the concomitant changes in brain states that support it? Brain imaging provides a useful tool with which to assess the neural signatures that support learning-dependent behavioral improvements, with recent work demonstrating both functional and structural brain changes as a result of training (Zatorre et al., Reference Zatorre, Fields and Johansen-Berg2012). Frequently, links between behavioral improvements and brain changes have been quantified using correlations of the magnitude of functional or structural brain changes and improvement in task performance after training. Although such approaches can provide insight into the relationship between brain signals and behavior, they are often limited by small sample sizes, outlier observations, and bias in data sampling (Vul & Pashler, Reference Vul and Pashler2012). Here, we discuss recent work using multivoxel pattern classification methods to investigate the link between BOLD and learning-dependent changes in neural tuning and behavior. These methods rely on cross-validating patterns of results based on independent data set and therefore provide a sensitive tool for uncovering neural preferences and studying the link between brain patterns and behavior in an unbiased manner.
Learning-dependent changes in neural signals as revealed by fMRI
Understanding the link between behavioral improvement with training and learning-dependent changes in fMRI signals is fraught with complexity. First, learning-dependent changes measured by BOLD may reflect different underlying changes in neural selectivity (i.e., sharpening of neuronal tuning to a visual stimulus): there may be enhanced responses to the preferred stimulus, decreased responses to nonpreferred stimuli, or a combination of the two. This clearly complicates the inferences that can be drawn from fMRI data; that is apparent equivalence in responses might have different underlying causes. A number of studies have shown that learning changes the overall responsiveness (i.e., increased or decreased fMRI responses) of visual areas to trained stimuli (Kourtzi et al., Reference Kourtzi, Betts, Sarkheil and Welchman2005; Sigman et al., Reference Sigman, Pan, Yang, Stern, Silbersweig and Gilbert2005; Op de Beeck et al., Reference Op de Beeck, Baker, DiCarlo and Kanwisher2006; Mukai et al., Reference Mukai, Kim, Fukunaga, Japee, Marrett and Ungerleider2007; Yotsumoto et al., Reference Yotsumoto, Watanabe and Sasaki2008). However, considering only the overall magnitude (i.e., univariate fMRI signal) does not allow us to discern whether learning-dependent changes in fMRI relate to changes in the overall magnitude of neural responses or changes in the selectivity of neural populations.
A second difficulty relates to making comparisons between overall activity between sessions—that is for brain imaging measurements made before versus after training. Such differences may have generalized causes such as differences in the state of the observers (e.g., alertness, attention, and interest) or differences in the measurement equipment (e.g., different levels of scanner noise) rather than training per se. Therefore, it is preferable to compare brain activity between different stimulus conditions within each session, using an experimental design that looks for changes in the relative response to different conditions before versus after training to index underlying changes in neural representations due to training.
Third, to quantify changes in (1) perceptual performance and (2) brain responses due to learning, it is useful to vary stimuli parametrically and test changing levels of performance. However, as discussed above, simple univariate fMRI measures may be insufficient to understand subtle changes in the neuronal responses and the links between perceptual and neuronal states. Recent work has sought to increase analysis sensitivity using MVPA to test training-dependent changes in the neural representations of visual stimuli (Op de Beeck et al., Reference Op de Beeck, Baker, DiCarlo and Kanwisher2006; Zhang et al., Reference Zhang, Meeson, Welchman and Kourtzi2010; Jehee et al., Reference Jehee, Ling, Swisher, van Bergen and Tong2012). Next, we describe work that has looked for Tellerian analogies between psychometric and brain imaging measurements by comparing the choices of human observers and pattern classifiers to derive similar functions from behavioral and fMRI data.
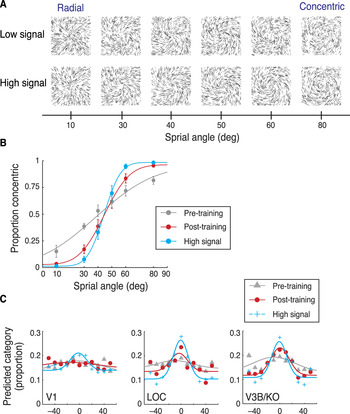
For example, in recent work Zhang et al. (Reference Zhang, Meeson, Welchman and Kourtzi2010) tested the mechanisms that mediate visual perceptual learning by combining behavioral judgments with high resolution imaging (i.e., smaller voxels for finer-grained measurements) and MVPA tools (Haynes & Rees, Reference Haynes and Rees2005; Kamitani & Tong, Reference Kamitani and Tong2005). To gain insight into the way in which responses to visual forms change with training, they employed a parametric stimulus space in which they could morph systematically between two different stimulus classes (concentric vs. radial glass patterns; Fig. 4a). By adding external noise to the displays, and using fine-scale variations in the morphing space, they were able to characterize observers’ behavioral discrimination performance before and after training on the task (Fig. 4b). Using fMRI measurements concurrent with stimulus presentation, Zhang et al. (Reference Zhang, Meeson, Welchman and Kourtzi2010) were able to evaluate the ability of the machine-learning algorithm to decode the presented stimuli. They were particularly interested in the choices of the pattern classifier in predicting each of the presented stimuli. Using the distribution of choices for each stimulus, they were able to generate fMRI-based voxel tuning functions that described the distribution of choices made by the classifier when given data were measured in different visual areas (Fig. 4c). Thereby, they sought to link learning-based changes in behavioral responses and fMRI responses by comparing psychometric functions and fMRI pattern-based tuning functions before and after training.
Learning to discriminate global shapes embedded in a clutter. (A) Stimuli: Low- and high-signal glass pattern stimuli. (B) Behavioral performance (average data across observers) across stimuli in the morphing space (as indicated by spiral angle) during scanning. The curves indicate the best fit of the cumulative Gaussian function for high-signal stimuli and low-signal stimuli before and after training. Error bars indicate the standard error of the mean. (C) fMRI pattern-based tuning functions for V1, LO, and V3B/KO: The proportion of predictions made to each stimulus condition in terms of the difference in spiral angle between the viewed stimulus and the prediction. Symbols indicate average data across observers; solid lines indicate the best fit of a Gaussian to the data from 1000 bootstrap samples.

Comparing the performance of human observers and classifiers demonstrated that learning altered the observers’ sensitivity to visual forms and the tuning of fMRI activation patterns in visual areas selective for task-relevant features. For high signal stimuli (i.e., 80% of the dots in the display were aligned to the stimulus shape, whereas 20% were randomly positioned), a tuned response across visual areas was observed, that is, the classifiers mispredicted similar stimuli more frequently than dissimilar ones. Consistent with the behavioral results, these tuning functions had higher amplitude for high-signal stimuli than low-signal stimuli (i.e., only 45% of the dots in the display were aligned to the stimulus shape) before training in higher visual areas (Fig. 4c). However, training on low-signal stimuli enhanced the amplitude while it reduced the width of pattern-based tuning functions in higher dorsal and ventral visual areas (Fig. 4c). Increased amplitude after training indicates higher stimulus discriminability that may relate to enhanced neural responses for the preferred stimulus category at the level of large neural populations. Reduced tuning width after training indicates fewer classification mispredictions, suggesting that learning decreases neural responses to nonpreferred stimuli. Thus, these findings suggest that learning of visual patterns is implemented in the human visual cortex by enhancing the response to the preferred stimulus category while reducing the response to nonpreferred stimuli.
Linking BOLD changes to behavioral improvement after training
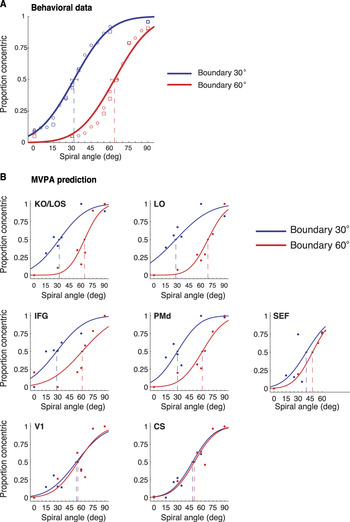
Learning is known to improve performance in perceptual tasks when there is considerable uncertainty, such as when detecting stimuli presented in cluttered backgrounds or discriminating between highly similar stimuli (Goldstone, Reference Goldstone1998; Gilbert et al., Reference Gilbert, Sigman and Crist2001; Goldstone et al., Reference Goldstone, Lippa and Shiffrin2001; Fine & Jacobs, Reference Fine and Jacobs2002). These training effects can be manifested in two different ways: training can improve behavioral sensitivity for target detection (i.e., learning makes psychometric functions steeper) or alter the decision criterion that represents the perceptual boundary between stimulus categories (i.e., learning can shift the midpoint, or bias, of the psychometric function). To investigate the brain mechanisms that support such changes, Li et al. (Reference Li, Mayhew and Kourtzi2009) tested how training paradigms altered the pattern-based analysis of single-trial fMRI signals. In particular, they employed a categorization task in which observers were presented with stimuli from a morphing space generated by interpolating between radial and concentric glass patterns (Fig. 4a). Observers were asked to decide whether the viewed stimulus was radial or concentric. Using feedback, they were able to alter the location of the observers’ categorical boundary in the morphing space (Fig. 5a), thereby dissociating the physical stimuli from their categorical interpretation. Using fMRI, they asked which cortical regions carry the neural signature of this learning-dependent flexibility in categorical decisions. Li et al. (Reference Li, Mayhew and Kourtzi2009) reasoned that such regions would show trial-by-trial variations that correspond to the behavioral choice of the observers and change to reflect the shift in the decision criterion (i.e., category boundary).
Learning for flexible categorical decisions. (A) Behavioral data for each of the two trained category boundaries (30 and 60° boundary). Lines indicate the cumulative Gaussian fits of the behavioral data from the lab. Error bars indicate the 95% confidence interval at 50% concentric threshold. (B) fMR-metric curves based on the observers’ behavioral choice for each task (30 and 60° boundary) and ROI. Average classifier prediction data across observers are scaled from 0 to 1 and fitted with cumulative Gaussian functions. Error bars indicate the 95% confidence interval at 50% concentric threshold.

To test this prediction, Li et al. (Reference Li, Mayhew and Kourtzi2009) computed psychometric functions based on the observers’ behavioral choice on each stimulus trial and “fMR-metric” functions based on the classifier’s choice on single-trial fMRI signals (Fig. 5b). In particular, they trained a linear SVM to classify fMRI signals based on the observer’s behavioral choice (radial vs. concentric) on each trial and evaluated the SVM’s prediction performance in predicting the observers’ choice for an independent dataset. Comparing the classifier’s choices with the observer’s choices showed that fMR-metric functions resemble psychometric functions, suggesting a link between behavioral and neural responses (Fig. 5b). Importantly, Li et al. (Reference Li, Mayhew and Kourtzi2009) showed that learning-dependent changes in the behavioral decision criterion (i.e., categorical boundary) are reflected by changes in the threshold (50% point) of the fMR-metric functions in ventrolateral prefrontal, premotor, and higher occipitotemporal regions. Analysis of the slopes of the psychometric and fMR-metric functions suggested that learning changes processes related to decision variables (criterion for stimulus comparison, stimulus uncertainty relative to criterion). In contrast, no significant shift was observed in the fMR-metric functions in V1, CS, or SEF suggesting that learning a new criterion for categorization does not affect the physical stimulus- or response-related representations in these regions that may support signal detection and motor execution, respectively.
Thus, comparing psychometric and fMR-metric functions allows to reliably decode (a) the observers’ choice on single trials and (b) learning-dependent changes on the decision criterion used by the observers for classifying sensory input. These findings provide evidence that category learning shapes neural representations in a circuit involving frontal and higher occipitotemporal regions to reflect the observers’ behavioral choice during categorical decisions. This link between behavioral and brain changes due to learning was supported by two further analyses methods.
First, fitting the fMRI data using a scaled version of the psychometric function obtained during scanning showed that fMR-metric functions in frontal (IFG, PMd) and extrastriate visual (KO/LOS, LO) areas (but not SEF, V1 or CS) were shifted in correspondence with the learned categorization boundary. Second, Li et al. (Reference Li, Mayhew and Kourtzi2009) used a choice probability analysis [e.g., (Britten et al., Reference Britten, Newsome, Shadlen, Celebrini and Movshon1996; Uka & DeAngelis, Reference Uka and DeAngelis2003)] to quantify the relationship between the observers’ choice and fMRI responses. They used voxel pattern responses (i.e., classification accuracy) evoked by stimuli near threshold performance (i.e., stimuli at the boundary), as observers’ performance included a sufficient number of errors for these stimuli. In particular, for each observer, trials were labeled based on the observer’s behavioral choice and the classifier’s performance in predicting the observer’s choice per stimulus trial was tested on an independent data set. The area under this ROC curve signified the choice probability for each observer and cortical region. Significant choice probabilities were observed in frontal and higher occipitotemporal areas, suggesting that pattern-based fMRI responses in these regions were strongly analogous to observers’ behavioral choices.
Comparing spatiotemporal brain patterns to human behavior
The work so far reviewed has focused on identifying spatial brain patterns (i.e., brain regions) that change with learning, implicating occipitotemporal and frontoparietal areas. However, little is known about the interactions within this network that mediate learning-dependent improvement in complex perceptual tasks. Some studies argue that learning alters early sensory processing (Adini et al., Reference Adini, Sagi and Tsodyks2002; Teich & Qian, Reference Teich and Qian2003), whereas others propose that learning alters later decision-related processes (Dosher & Lu, Reference Dosher and Lu1999; Li et al., Reference Li, Piech and Gilbert2004; Law & Gold, Reference Law and Gold2008; Jacobs, Reference Jacobs2009).
Using fMRI alone would make it difficult to identify cortical circuits related to different temporal processes involved in visual learning due to the low temporal resolution of the technique. In some recent work, Li et al. (Reference Li, Mayhew and Kourtzi2012) and Mayhew et al. (Reference Mayhew, Li and Kourtzi2012) took advantage of the complementary high spatial and temporal resolution of simultaneous electroencephalogram (EEG)-fMRI to identify the spatiotemporal dynamics between cortical networks involved in perceptual learning under uncertainty. Using EEG-informed fMRI and pattern classification analysis methods, they tested for learning-dependent changes in EEG-fMRI activation patterns that related to the observers’ enhanced performance in discriminating global forms (i.e., radial vs. concentric patterns) after training. These multimodal measurements allowed testing the hypothesis that changes in neural representations due to training may occur at different timescales related to different computational processes (e.g., stimulus processing vs. perceptual judgment).
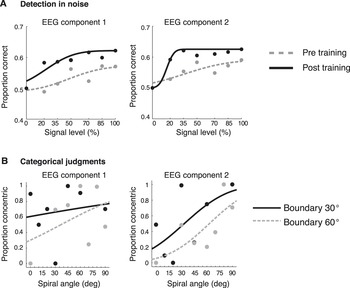
To test this hypothesis, Li et al. (Reference Li, Mayhew and Kourtzi2012) and Mayhew et al. (Reference Mayhew, Li and Kourtzi2012) used EEG to identify components with distinct latencies that are thought to relate to different processes (Johnson & Olshausen, Reference Johnson and Olshausen2003; Ohla et al., Reference Ohla, Busch, Dahlem and Herrmann2005; Pei et al., Reference Pei, Pettet, Vildavski and Norcia2005; Tanskanen et al., Reference Tanskanen, Saarinen, Parkkonen and Hari2008; Das et al., Reference Das, Giesbrecht and Eckstein2010): a first component around 120 ms known to relate to visual form integration and a second component around 240 ms known to relate to fine perceptual judgments. To identify brain regions that are involved in the different temporal processes related to these EEG components, they conducted an EEG-informed fMRI analysis, using the EEG time course to generate regressors corresponding to the two different components for the General Linear Model (GLM) analysis on the fMRI signals (Debener et al., Reference Debener, Ullsperger, Siegel, Fiehler, von Cramon and Engel2005; Eichele et al., Reference Eichele, Specht, Moosmann, Jongsma, Quiroga, Nordby and Hugdahl2005; Philiastides & Sajda, Reference Philiastides and Sajda2007). To test the link between spatiotemporal brain activations (i.e., brain areas activated for each of the two EEG components) and behavior, they measured the choices of a pattern classifier when predicting each stimulus from EEG-fMRI signals. That is, similar to the fMR-metric functions, Li et al. (Reference Li, Mayhew and Kourtzi2012) and Mayhew et al. (Reference Mayhew, Li and Kourtzi2012) generated EEG-metric functions (Philiastides & Sajda, Reference Philiastides and Sajda2006; Das et al., Reference Das, Giesbrecht and Eckstein2010) for each of the two EEG components. They tested whether decoding radial versus concentric glass patterns from single-trial EEG data improved after training.
Comparing the choices of the classifier algorithm (EEG/fMR-metric functions) with the observer’s choices (psychometric functions) demonstrated that learning improves our ability to discriminate visual forms and EEG-fMRI activation patterns related to distinct visual recognition processes. In particular, when observers discriminated radial from concentric patterns in noise, training improved observers’ sensitivity. This behavioral improvement was associated with neural changes in (a) early processes involved in the integration of global forms engaging occipitotemporal and posterior parietal areas and (b) later processes related to categorical judgments engaging frontal circuits (Fig. 6a). In contrast, when observers performed categorical judgments on morphed stimuli (i.e., radial vs. concentric patterns), training altered the decision criteria (i.e., category boundary). These learning-dependent changes in the decision criteria were associated only with changes in later EEG processes engaging higher occipitotemporal and frontoparietal circuits: category learning did not modulate early processes in the medial frontotemporal network that are thought to support the coarse interpretation of visual scenes (Fig. 6b).
Learning-dependent changes in spatiotemporal brain patterns. EEG-metric curves before and after training when (A) discriminating shapes in noise and (B) discriminating and categorizing similar shapes. For each of the two EEG components, the classifier performance at each condition was averaged across observers and fitted with cumulative Gaussian functions for each session: pre- (gray dotted lines) and post- (black solid lines) training.

Summary
Teller’s formalized framework (Teller & Pugh, 1983; Teller, 1984) for understanding the links between perceptual and physiological states was originally discussed in relation to the activity of small numbers of neurons. Here we reviewed the potential contributions from human brain imaging in understanding the links between neuronal responses and visual perceptual states. These imaging approaches aggregate information from large numbers of neurons and involve complex transducer functions that necessitate careful considerations in their interpretation. Nevertheless, there are good reasons to believe that human imaging data can provide a mid-level analysis of physiological processes that can link to single-unit recording work as well as facilitating the use of perceptual tasks whose complexity approximates many of the challenges of everyday human vision. In particular, we have highlighted the potential to use parametric stimulus manipulations coupled with fMRI design approaches that seek to increase the sensitivity of data acquisition (e.g., high-resolution acquisition; adaptation designs) and analysis (e.g., machine-learning approaches and information theory analysis to quantify the information contained in rich data sets). These data are best understood as providing analogies between perceptual states and physiological signals within Teller’s terminology. The strength of these analogies become more compelling as different data converge to the same conclusions to promote links between activity within particular circuits and what we see.