INTRODUCTION
The ability to accurately identify individuals at risk for progression to Alzheimer’s disease (AD) is dependent on detecting and characterizing its earliest manifestations. Efforts to characterize early stages of AD have focused on identifying biomarkers that become abnormal well before an individual demonstrates clinical symptoms. Beta-amyloid (Aβ) peptides are the primary component of amyloid plaques, a hallmark feature of AD. These peptides are thought to accumulate very early in the pathogenesis of AD (Jansen et al., Reference Jansen, Ossenkoppele, Knol, Tijms, Scheltens, Verhey and Zetterberg2015) and to drive other downsteam effects, including a progressive loss of neurons and cognitive symptoms (Jack et al., Reference Jack, Knopman, Jagust, Shaw, Aisen, Weiner and Trojanowski2010; Jack, Knopman, et al., Reference Jack, Knopman, Jagust, Petersen, Weiner, Aisen and Trojanowski2013). More recently, it has been proposed that pathways promoting Aβ and neurodegeneration may arise independently and then converge, leading to further acceleration of neurodegeneration and cognitive impairment (Sperling, Mormino, & Johnson, Reference Sperling, Mormino and Johnson2014).
Florbetapir is an amyloid imaging tracer that has been shown through in vivo and ex vivo studies to measure cortical fibrillar Aβ (Clark et al., Reference Clark, Pontecorvo, Beach, Bedell, Coleman, Doraiswamy and Skovronsky2012). Within the Alzheimer’s Disease Neuroimaging Initiative (ADNI) dataset, we recently examined cortical amyloid burden as measured by florbetapir positron emission tomography (PET) amyloid scans in empirically derived subtypes of mild cognitive impairment (MCI) (Bangen et al., Reference Bangen, Clark, Werhane, Edmonds, Nation, Evangelista and Delano-Wood2016). We found that 65% of MCI participants with impaired neuropsychological performance and 34% of normal controls demonstrated an abnormal scan that was positive for amyloid (Bangen et al., Reference Bangen, Clark, Werhane, Edmonds, Nation, Evangelista and Delano-Wood2016). These findings are consistent with the literature showing a high prevalence of amyloid deposition in cognitively normal samples (Balasubramanian, Kawas, Peltz, Brookmeyer, & Corrada, Reference Balasubramanian, Kawas, Peltz, Brookmeyer and Corrada2012; Bennett, Schneider, Bienias, Evans, & Wilson, Reference Bennett, Schneider, Bienias, Evans and Wilson2005; Davis, Schmitt, Wekstein, & Markesbery, Reference Davis, Schmitt, Wekstein and Markesbery1999; Price et al., Reference Price, McKeel, Buckles, Roe, Xiong, Grundman and Morris2009; Rodrigue et al., Reference Rodrigue, Kennedy, Devous, Rieck, Hebrank, Diaz-Arrastia and Park2012; Rowe et al., Reference Rowe, Ng, Ackermann, Gong, Pike, Savage and Villemagne2007), suggesting some level of amyloid burden may be nonspecific and not necessarily a sign of early AD. On the other hand, it is possible that at least some of these individuals with high amyloid levels are already in a “preclinical” stage of AD.
“Preclinical” AD is a phase in which individuals are classified as “cognitively normal” yet they demonstrate abnormalities in biomarkers or subtle cognitive markers associated with AD. The National Institute on Aging and the Alzheimer’s Association (NIA-AA) have proposed a method of staging preclinical AD based on the presence or absence of these particular markers. Stage 1 involves amyloidosis; Stage 2 involves amyloidosis plus neurodegeneration; Stage 3 involves amyloidosis, neurodegeneration, and evidence of “subtle cognitive decline” (from one’s own baseline) defined as “very subtle cognitive impairment” on sensitive cognitive measures (Sperling et al., Reference Sperling, Aisen, Beckett, Bennett, Craft, Fagan and Phelps2011). Studies that have attempted to apply these NIA-AA criteria have also included two additional classifications: “suspected non-AD pathophysiology” (SNAP; individuals with normal amyloid levels but evidence of neurodegeneration) and “Unclassified” (individuals with subtle cognitive decline but no neurodegeneration) (Jack et al., Reference Jack, Knopman, Weigand, Wiste, Vemuri, Lowe and Petersen2012).
A limitation to this staging system, which is based on the amyloid cascade hypothesis (Jack et al., Reference Jack, Knopman, Jagust, Shaw, Aisen, Weiner and Trojanowski2010; Jack, Knopman, et al. Reference Jack, Knopman, Jagust, Petersen, Weiner, Aisen and Trojanowski2013), is that many individuals do not follow this proposed sequence of events, as there is growing evidence that neurodegeneration (Edmonds, Delano-Wood, Galasko et al., Reference Edmonds, Delano-Wood, Galasko, Salmon and Bondi2015; Jack, Wiste, et al., Reference Jack, Wiste, Weigand, Knopman, Lowe, Vemuri and Petersen2013) and/or cognitive changes (Edmonds, Delano-Wood, Galasko, et al., Reference Edmonds, Delano-Wood, Galasko, Salmon and Bondi2015; Jedynak et al., Reference Jedynak, Lang, Liu, Katz, Zhang, Wyman and Prince2012; Landau et al., Reference Landau, Harvey, Madison, Reiman, Foster, Aisen and Jagust2010) may precede amyloidosis as the first sign of prodromal AD.
We proposed an alternative classification method for staging preclinical AD (Edmonds, Delano-Wood, Galasko, et al., Reference Edmonds, Delano-Wood, Galasko, Salmon and Bondi2015). Our staging method is based simply on a tally of the number of abnormal biomarkers (i.e., amyloidosis, neurodegeneration) or cognitive markers (i.e., subtle cognitive/functional decline) associated with preclinical AD that each individual possesses without regard for their temporal order of occurrence. This method does not adhere to the amyloid cascade hypothesis (Jack et al., Reference Jack, Knopman, Jagust, Shaw, Aisen, Weiner and Trojanowski2010; Jack, Knopman, et al., Reference Jack, Knopman, Jagust, Petersen, Weiner, Aisen and Trojanowski2013), which requires a specific temporal order of biomarker/cognitive marker abnormalities (although there is recent acknowledgement that amyloid and neurodegeneration do not have to occur in a fixed sequence; Jack, Knopman, et al., Reference Jack, Knopman, Jagust, Petersen, Weiner, Aisen and Trojanowski2013; Sperling, Mormino, & Johnson, Reference Sperling, Mormino and Johnson2014). Rather, our classification method is based on the work of Braak, Zetterberg, Del Tredici, and Blennow (Reference Braak, Zetterberg, Del Tredici and Blennow2013) who have proposed an alternative model to the amyloid cascade hypothesis. This model posits that AD pathologic markers (Aβ deposition, tau pathology, neurodegeneration) co-occur nearly simultaneously, and the perceived differences in timing are thought to be due to varying sensitivity of the biomarkers or of our ability to detect change, rather than a true difference in the sequence of these neurobiological changes. Cognition has traditionally been viewed as the last marker to be affected in preclinical AD due to the routine use of insensitive measures (i.e., rating scales or screening measures). However, sensitive episodic memory measures (i.e., verbal list learning and memory) may be the earliest markers to become abnormal in the progression to AD (Jedynak et al., Reference Jedynak, Lang, Liu, Katz, Zhang, Wyman and Prince2012). We found that our approach to classification was as predictive of progression to MCI or AD as the method proposed by the NIA-AA criteria (Edmonds, Delano-Wood, Galasko, et al., 2015).
The current study aimed to build upon our previous findings in MCI (Bangen et al., Reference Bangen, Clark, Werhane, Edmonds, Nation, Evangelista and Delano-Wood2016) by examining Aβ burden using florbetapir PET amyloid scans in individuals who are earlier in the disease process—those with preclinical AD. We hypothesized that we would observe an increase in cortical Aβ burden across stages of preclinical AD, with relatively low levels in early stages of preclinical AD and levels approaching MCI participants by the later stages. An exploratory aim was to examine amyloid burden in several allocortical and subcortical regions, including the accumbens, amygdala, caudate, hippocampus, pallidum, putamen, and thalamus. We expected that subcortical amyloid would largely follow the same pattern as cortical amyloid, with levels increasing over stages of preclinical AD.
METHODS
Data used in the preparation of this article were obtained from the ADNI database (adni.loni.usc.edu). The ADNI was launched in 2003 as a public–private partnership. This study was approved by an ethical standards committee on human experimentation at each institution. Written informed consent was obtained from all participants or authorized representatives participating in the study. For additional information, see www.adni-info.org.
Participants
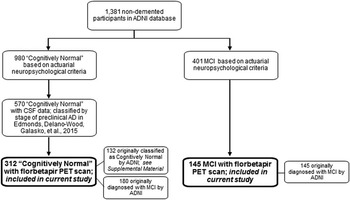
This cross-sectional study included 312 “cognitively normal” participants and 145 MCI participants enrolled in ADNI (mean age=72.3 years; SD=7.2). The sample of 312 cognitively normal individuals is a subset of 570 ADNI participants who we had previous classified by stage of preclinical AD (Edmonds, Delano-Wood, Galasko, et al., Reference Edmonds, Delano-Wood, Galasko, Salmon and Bondi2015). For the current study, we included those participants who had a florbetapir PET scan with processed data available for download as of December 1, 2015. See Figure 1 for a flowchart showing which participants from the overall ADNI database were included in the current study.
Flowchart showing which participants from the overall ADNI database were included in the current study.

The classification of “cognitively normal” versus MCI for this study was determined by an actuarial neuropsychological diagnostic method (Bondi et al., Reference Bondi, Edmonds, Jak, Clark, Delano-Wood, McDonald and Salmon2014; Jak et al., Reference Jak, Bondi, Delano-Wood, Wierenga, Corey-Bloom, Salmon and Delis2009) applied to participants’ baseline neuropsychological test data. We have previously demonstrated that conventional diagnostic methods for MCI (which are based on subjective complaints, rating scales, cognitive screening measures, and a single memory test; Petersen, Reference Petersen2004; Petersen et al., Reference Petersen, Aisen, Beckett, Donohue, Gamst, Harvey and Weiner2010) are highly susceptible to false-positive diagnostic errors, with over one-third of MCI samples being better classified as “cognitively normal” due to normal cognitive functioning, normal AD biomarkers, and low progression rates to AD (Bangen et al., Reference Bangen, Clark, Werhane, Edmonds, Nation, Evangelista and Delano-Wood2016; Bondi et al., Reference Bondi, Edmonds, Jak, Clark, Delano-Wood, McDonald and Salmon2014; Clark et al., Reference Clark, Delano-Wood, Libon, McDonald, Nation, Bangen and Bondi2013; Edmonds, Delano-Wood, Cark, et al., Reference Edmonds, Delano-Wood, Clark, Jak, Nation, McDonald and Bondi2015; Edmonds et al., in Reference Edmonds, Eppig, Bondi, Leyden, Goodwin, Delano-Wood and McDonaldpress). MCI diagnosed via our actuarial neuropsychological method, which assigns diagnoses of MCI based on multiple objective neuropsychological tests assessing a range of cognitive domains, has been shown to produce greater diagnostic stability (Jak et al., Reference Jak, Bondi, Delano-Wood, Wierenga, Corey-Bloom, Salmon and Delis2009) and stronger relationships between cognition, biomarkers, and rates of progression to AD (Bondi et al., Reference Bondi, Edmonds, Jak, Clark, Delano-Wood, McDonald and Salmon2014; Clark et al., Reference Clark, Delano-Wood, Libon, McDonald, Nation, Bangen and Bondi2013; Edmonds et al., Reference Edmonds, Delano-Wood, Jak, Galasko, Salmon and Bondi2016).
MATERIALS AND PROCEDURE
Preclinical AD Staging Based on Number of Abnormal Biomarkers
Participants underwent neuropsychological testing and lumbar puncture for cerebrospinal fluid (CSF) collection at the same visit during their baseline assessment. We classified all cognitively normal participants as “normal” or “abnormal” for (1) cerebral amyloidosis, (2) neurodegeneration, and (3) subtle cognitive/functional decline. Abnormal cerebral amyloid accumulation was defined as CSF Aβ1–42 level of <192 pg/mL, and the presence of neurodegeneration was defined as CSF tau level of>93 pg/mL or CSF p-tau181p level of>23 pg/mL (Shaw et al., Reference Shaw, Vanderstichele, Knapik-Czajka, Clark, Aisen, Petersen and Trojanowski2009).
We operationalized subtle cognitive decline based on two measures of language (Animal Fluency; Boston Naming Test), two measures of attention/executive function (Trail Making Test, Parts A & B), and two scores from a memory measure (Rey Auditory Verbal Learning Test [AVLT] 30-min delayed free recall and recognition). Each score was converted to an age-corrected standard score (Ivnik et al., Reference Ivnik, Malec, Smith, Tangalos, Petersen, Kokmen and Kurland1992; Shirk et al., Reference Shirk, Mitchell, Shaughnessy, Sherman, Locascio, Weintraub and Atri2011; Weintraub et al., Reference Weintraub, Salmon, Mercaldo, Ferris, Graff-Radford, Chui and Morris2009). Subtle cognitive or functional decline was defined as having (1) scores>1 SD below the age-corrected normative mean (i.e., “impaired”) on two of the six neuropsychological measures in different cognitive domains (patients with two impaired scores within the same cognitive domain were considered to have MCI and excluded from the study; see Edmonds, Delano-Wood, Galasko, et al., Reference Edmonds, Delano-Wood, Galasko, Salmon and Bondi2015), or (2) a Functional Activities Questionnaire (FAQ) score of 2, indicative of some decline in daily activities (patients with an FAQ score of ≥3 were considered to have MCI and excluded from the study). The number of abnormal biomarkers or cognitive markers that each individual possessed was tallied to determine their stage of preclinical AD. For comparison purposes, we also classified participants based on the NIA-AA criteria (Sperling et al., Reference Sperling, Aisen, Beckett, Bennett, Craft, Fagan and Phelps2011).
Florbetapir PET Data Acquisition and Processing
All participants underwent florbetapir PET imaging within 2 weeks of their baseline neuropsychological assessment. A detailed description of ADNIs florbetapir PET imaging data acquisition and processing methods can be found online (http://adni.loni.usc.edu/methods/pet-analysis/pre-processing/). Briefly, florbetapir images consisting of four or six frames were acquired post-injection of florbetapir F18. Each scan was reviewed for quality control before being co-registered, averaged, reoriented into a standard 160×160×96 voxel image grid with 1.5-mm cubic voxels, and smoothed to a uniform isotropic resolution of 8 mm full width at half maximum. Structural MR images were skull-stripped, segmented, parcellated using Freesurfer (version 5.3.0; surfer.nmr.mgh.harvard.edu) and then co-registered to each participant’s first florbetapir image. Freesurfer was used to delineate cortical and subcortical regions.
The ADNI database provides the mean florbetapir uptake within several cortical and subcortical regions. The four cortical regions of interest (ROI) were: (1) frontal, (2) anterior/posterior cingulate, (3) lateral parietal, and (4) lateral temporal cortex. ADNI extracts florbetapir means from gray matter in each subregion within these four large ROIs (Jagust et al., Reference Jagust, Landau, Shaw, Trojanowski, Koeppe, Reiman and Mathis2009; Mormino et al., Reference Mormino, Kluth, Madison, Rabinovici, Baker, Miller and Jagust2009). For the current study, standardized uptake value ratios (SUVRs) were calculated using the procedure recommended by ADNI: dividing the florbetapir mean for each of the cortical ROIs by the mean florbetapir uptake value for the reference region (i.e., whole cerebellum). ADNI provides a global cortical summary SUVR, which is calculated by creating a conventional (nonweighted) average across the four main cortical ROIs and dividing by the mean florbetapir uptake value of the whole cerebellum. Increased retention of florbetapir is thought to reflect increased cortical amyloid load.
The ADNI database also includes florbetapir uptake values for allocortical and subcortical ROIs. The following seven regions were examined: (1) acumbens, (2) amygdala, (3) caudate, (4) hippocampus, (5) pallidum, (6) putamen, and (7) thalamus. We created SUVRs by averaging the left and right values for each ROI and dividing by the mean florbetapir uptake value for the reference region (i.e., whole cerebellum).
Statistical Analyses
Differences between stages of preclinical AD (based on number of abnormal biomarkers) in demographics, apolipoprotein E (APOE) genotype, and baseline neuropsychological performance were examined using analysis of variance (ANOVA) and chi-square analyses. To examine our hypotheses related to cortical and allocortical/subcortical Aβ burden across preclinical AD stages, group differences in regional florbetapir SUVRs were examined using multivariate analysis of covariance (MANCOVA). Bonferroni-corrected post hoc comparisons were conducted for significant omnibus tests (four preclinical AD groups based on number of abnormal biomarkers; six comparisons; p=.05/6=.008). We also used MANCOVA to compare preclinical AD groups to the 145 MCI participants.
All cognitively normal participants were also classified based on the NIA-AA criteria (Sperling et al., Reference Sperling, Aisen, Beckett, Bennett, Craft, Fagan and Phelps2011). Group differences in regional florbetapir SUVRs were examined using MANCOVA with Bonferroni-corrected post hoc comparisons (six NIA-AA stages; 15 comparisons; p=.05/15=.003). Lastly, to ensure that our results were not simply due to our method of classifying “cognitively normal,” we examined florbetapir SUVRs using only those individuals who were originally classified as cognitively normal by ADNI based on conventional diagnostic criteria (Petersen et al., Reference Petersen, Aisen, Beckett, Donohue, Gamst, Harvey and Weiner2010); see Supplemental Materials for further description of this subset (n=132).
RESULTS
Clinical Characteristics of Preclinical AD Stages
For the 312 cognitively normal participants, 46.2% of the sample (n=144) was positive for amyloidosis, 68.6% (n=214) for neurodegeneration, and 17.3% (n=54) for subtle cognitive/functional decline. There was no difference in age, education, gender, or APOE status between participants who demonstrated subtle cognitive decline (n=30) versus subtle functional decline (n=24; p’s>.05).
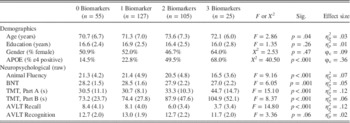
The number of abnormal biomarkers or cognitive markers that each individual possessed was tallied to determine their stage of preclinical AD. Using this classification strategy, 55 participants (17.6%) had no abnormal biomarkers or cognitive markers (“0 Biomarkers”); 127 (40.7%) had one abnormal marker (“1 Biomarker”); 105 (33.7%) had two abnormal markers (“2 Biomarkers”); and 25 (8.0%) had abnormalities on all three markers (“3 Biomarkers”; see Table 1). Of those with one abnormal biomarker, 23 had amyloidosis, 91 had neurodegeneration, and 13 had subtle cognitive/functional decline. Of those with two abnormal biomarkers, 89 had amyloidosis and neurodegeneration, 7 had amyloidosis and subtle/functional cognitive decline, and 9 had neurodegeneration and subtle cognitive/functional decline.
Demographic and neuropsychological characteristics for participants in each stage of preclinical AD (based on number of abnormal biomarkers)

Note. Data are summarized as mean (SD) unless otherwise noted.
APOE=apolipoprotein E; BNT=Boston Naming Test; TMT=Trail Making Test; AVLT=Rey Auditory Verbal Learning Test.
Demographic and neuropsychological characteristics for each stage of preclinical AD based on number of abnormal biomarkers are presented in Table 1. Age, education, and gender did not differ significantly between groups. The prevalence of APOE-ε4 carriers increased across preclinical AD stages, with the 0 Biomarkers and 1 Biomarker groups differing significantly from the 2 Biomarkers and 3 Biomarkers groups (p<.001; φc=.36). All analyses comparing preclinical AD stages controlled for APOE status.
Comparison of the 312 cognitively normal and the 145 MCI participants revealed no significant age difference (p>.05). However, the MCI group had less education (mean=15.7 years; SD=2.8; p=.001), more males (60.0%; p=.03), and a greater prevalence of APOE-ε4 carriers (62.7%; p<.001). Analyses comparing the preclinical AD stages to MCI controlled for education, gender, and APOE status.
Cortical Amyloid in Preclinical AD Stages
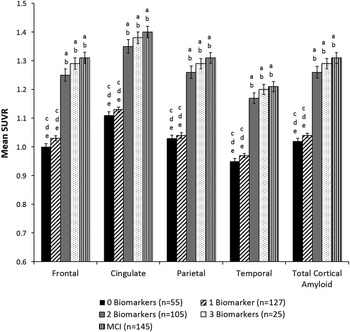
The mean florbetapir SUVRs for each cortical ROI, as well as the mean global cortical florbetapir SUVRs, are shown as a function of preclinical AD stage (based on number of abnormal biomarkers) in Table 2 and Figure 2. There were significant group differences for global cortical SUVR and for SUVRs in all cortical ROIs (ps<.001). Post hoc comparisons showed the same pattern of results across all cortical ROIs: the 0 Biomarkers and 1 Biomarker groups did not differ from each other (p>.05), but both had significantly lower SUVRs than the 2 Biomarkers and 3 Biomarkers groups (p<.001). The 2 Biomarkers and 3 Biomarkers groups did not differ from each other (p>.05). Comparison of the preclinical AD stages (based on number of abnormal biomarkers) to MCI revealed that the 2 Biomarkers and 3 Biomarkers groups had mean florbetapir SUVRs that were not significantly different from MCI for all cortical ROIs (p>.05); see Figure 2.
Mean regional and global florbetapir standard uptake ratio (SUVR) for cortical regions in preclinical AD stages (based on number of abnormal biomarkers) and MCI. Error bars denote standard error of the mean. Letters denote significant group differences: a=different than 0 Biomarkers; b=different than 1 Biomarker; c=different than 2 Biomarkers; d=different than 3 Biomarkers; e=different than MCI.

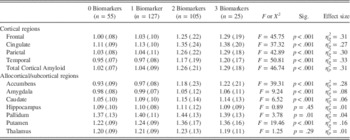
Mean florbetapir SUVR for cortical and subcortical regions for participants in each stage of preclinical AD (based on number of abnormal biomarkers)

Note. Data are summarized as mean (SD). All SUVRs use whole cerebellum as reference region.
Allocortical and Subcortical Amyloid in Preclinical AD Stages
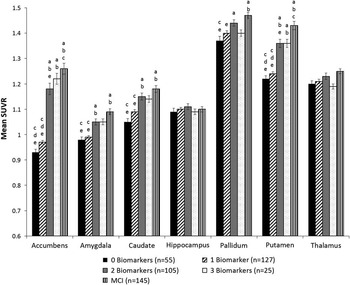
Mean florbetapir SUVRs for the seven allocortical and subcortical ROIs are shown as a function of preclinical AD stage (based on number of abnormal biomarkers) in Table 2 and Figure 3. There were significant group differences in the accumbens, amygdala, caudate, and putamen (p<.001). Post hoc tests showed a pattern of results that was similar to the cortical regions for each of these four allocortical/subcortical areas: the 0 Biomarkers and 1 Biomarker groups did not differ (p>.05), and the 2 Biomarkers and 3 Biomarkers groups did not differ (p>.05). However, the 0 Biomarkers and 1 Biomarker groups had significantly lower SUVRs than the 2 Biomarkers group for all four regions (ps<.001) and lower SUVRs than the 3 Biomarkers group for the accumbens and putamen (ps<.001).
Mean standard uptake ratio (SUVR) for allocortical/subcortical regions in preclinical AD stages (based on number of abnormal biomarkers) and MCI. Error bars denote standard error of the mean. Letters denote significant group differences: a=different than 0 Biomarkers; b=different than 1 Biomarker; c=different than 2 Biomarkers; d=different than 3 Biomarkers; e=different than MCI.

A different pattern emerged for the other three allocortical and subcortical regions. There were no differences among the groups in SUVRs in the hippocampus (omnibus p=.45) or the thalamus (omnibus p=.29). While the omnibus test for the pallidum was significant at p=.01, Bonferroni-corrected post hoc tests showed the only significant group difference was between the 0 Biomarkers and 2 Biomarkers group.
Comparison of the preclinical AD stages to MCI (see Figure 3) revealed that the 2 Biomarkers and 3 Biomarkers groups had mean florbetapir SUVRs that did not differ from the MCI group for the amygdala, caudate, and pallidum (ps≥.05). The 3 Biomarkers group also did not differ from MCI for the accumens and putamen (ps≥.04). SUVRs in the hippocampus and thalamus did not differ between MCI and any of the preclinical AD stages (based on number of biomarkers) (omnibus ps>.05).
Comparison to Preclinical AD Stages Based on NIA-AA Criteria
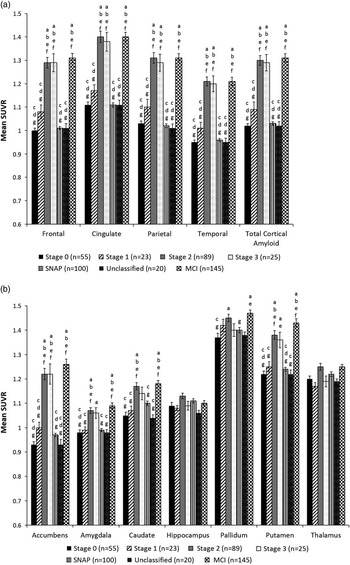
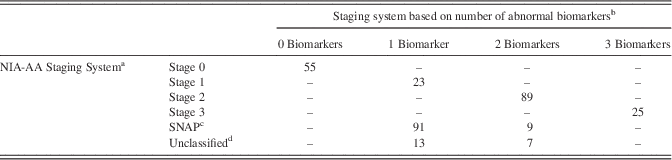
The NIA-AA criteria for preclinical AD (Sperling et al., Reference Sperling, Aisen, Beckett, Bennett, Craft, Fagan and Phelps2011) was applied to stage all 312 cognitively normal participants. Comparison of the number of participants classified at each stage of preclinical based on the two staging systems is shown in Table 3. Mean florbetapir SUVRs for cortical and allocortical/subcortical regions are shown as a function of NIA-AA preclinical AD stage in Figure 4. MANCOVA with APOE status included as a covariate (as this variable differed significantly between groups based on NIA-AA criteria) showed that the SNAP and Unclassified groups did not differ from one another in global cortical SUVR or SUVRs in any cortical ROIs (ps>.05), nor did they statistically differ from Stage 0 (ps>.05) or Stage 1 (ps>.01). Similarly, for the subcortical ROIs, the SNAP and Unclassified groups did not differ significantly from each other (ps>.02), or from Stage 0 (ps>.03) or Stage 1 (ps>.04). The SNAP and Unclassified groups had significantly lower SUVRs than Stages 2 and 3 for all cortical ROIs (ps<.001); lower SUVRs than Stage 2 for the accumbens, amygdala, caudate, and putamen (ps<.002); and lower SUVRs than Stage 3 for the accumbens (ps<.001).
Mean standard uptake ratio (SUVR) for (a) cortical and (b) subcortical regions when participants were classified based on NIA-AA criteria for preclinical AD. Error bars denote standard error of the mean. Letters denote significant group differences: a=different than Stage 0; b=different than Stage 1; c=different than Stage 2; d=different than Stage 3; e=different than SNAP; f=different than Unclassified; g=different than MCI.

Number of participants classified at each stage of preclinical AD based on the two staging systems

Note. NIA-AA=National Institute on Aging–Alzheimer’s Association; SNAP=suspected non-AD pathophysiology.
a Staging system based on the biomarkers/cognitive markers an individual possesses and requires a specific temporal order (i.e., amyloidosis first, then neurodegeneration, then subtle cognitive decline).
b Staging system based on the number of biomarkers/cognitive markers an individual possesses without regard for their temporal order of occurrence.
c SNAP participants had neurodegeneration with normal amyloid levels.
d Unclassified participants had subtle cognitive/functional decline with no neurodegeneration.
Comparison of the NIA-AA stages to MCI participants revealed that Stages 2 and 3 had mean florbetapir SUVRs that were not significantly different from MCI for all cortical ROIs (ps>.05); see Figure 4. Stages 2 and 3 also did not differ from the MCI group for allcortical/subcortical ROIs (p≥.04). Stage 1 and the Unclassified group did not differ from MCI for the pallidum (p≥.03). There were no group differences for the hippocampus (omnibus p>.05) or thalamus (p>.01).
Comparison to Conventional Diagnostic Methods
We examined florbetapir SUVRs in only those individuals classified as “cognitively normal” by ADNI’s diagnostic criteria (n=132) (Petersen et al., Reference Petersen, Aisen, Beckett, Donohue, Gamst, Harvey and Weiner2010; see Supplemental Material). The pattern of results for amyloid deposition in the cortical and allocortical/subcortical ROIs across stages of preclinical AD in this subsample was remarkably similar to the results found in the full sample of 312 participants who were classified as “cognitively normal” based on actuarial neuropsychological criteria. This was the case both when stages of preclinical AD were based on the number of abnormal biomarkers (see Supplementary Figure 1) or the NIA-AA criteria (see Supplementary Figure 2).
DISCUSSION
We examined florbetapir PET amyloid scans in preclinical AD to characterize the prevalence and pattern of cerebral amyloid burden. Preclinical AD stages were based on empirically defined methods (Edmonds, Delano-Wood, Galasko, et al., Reference Edmonds, Delano-Wood, Galasko, Salmon and Bondi2015). In cortical ROIs, amyloid deposition increased across stages of preclinical AD, consistent with our hypothesis. This is not surprising, given that the preclinical AD stages themselves were based on three markers, one of which was participants’ CSF Aβ1–42 level. The correspondence between florbetapir PET imaging and CSF Aβ has been shown to be quite high in the ADNI dataset, with 86% agreement between the two measurements (Landau, Lu, et al., Reference Landau, Lu, Joshi, Pontecorvo, Mintun, Trojanowski and Shaw2013). Thus, it follows that cortical SUVRs would be higher in the 2 and 3 Biomarkers groups, where nearly everyone (97% of the 2 and 3 Biomarkers groups combined) had abnormal CSF Aβ1–42, relative to the 0 and 1 Biomarker groups where the rate of CSF Aβ1–42 abnormality was much lower (14% of the 0 and 1 Biomarker groups combined).
Levels of florbetapir PET Aβ in the later stages of preclinical AD were not significantly different from MCI participants, although it should be noted that this does not necessarily imply equivalence and there was a trend for the 2 and 3 Biomarkers groups to have somewhat lower amyloid levels than the MCI group (see Figures 2 and 3). These findings are consistent with the notion that cerebral amyloid pathology may often, although not invariantly, occur early in the pathogenesis of AD, perhaps as many as 20–30 years before expression of clinical AD (Jansen et al., Reference Jansen, Ossenkoppele, Knol, Tijms, Scheltens, Verhey and Zetterberg2015), and that substantial accumulation has already occurred before one meets criteria for a clinical diagnosis for even mild forms of cognitive impairment.
The most intriguing finding from this study was the pattern of results seen in the allocortical and subcortical gray-matter regions. Several of these regions followed the same general pattern as the cortical areas, including the accumbens, amygdala, caudate, and putamen. However, the SUVRs observed in the hippocampus, pallidum, and thalamus largely did not differ across stages of preclinical AD. This finding indicates that neither our staging system nor the NIA-AA staging system adequately captures the progression of amyloid in these allocortical and subcortical regions. One possible explanation for the discrepancy is that CSF Aβ1–42 may not correspond well to florbetapir PET SUVRs in these particular subcortical structures. Previous research has shown that CSF and PET markers of amyloid are indeed associated with one another, but in a nonlinear way. Specifically, the relationship between CSF Aβ1–42 and florbetapir PET in the ADNI sample was found to be strong only when values were in the midrange on both measures; they did not closely correlate in the low and high range of values (Toledo et al., Reference Toledo, Bjerke, Da, Landau, Foster, Jagust and Trojanowski2015). This suggests that CSF and florbetapir PET biomarkers are measuring different aspects of AD amyloid pathology (Toledo et al., Reference Toledo, Bjerke, Da, Landau, Foster, Jagust and Trojanowski2015), which may account for our unexpected findings in some of the allocortical/subcortical regions.
An SUVR of 1.11 has been suggested as a cutoff value for “amyloid positivity” in cortical regions (Joshi et al., Reference Joshi, Pontecorvo, Clark, Carpenter, Jennings, Sadowsky and Skovronsky2012; Landau, Breault, et al., Reference Landau, Breault, Joshi, Pontecorvo, Mathis, Jagust and Mintun2013). However, it is unclear what cutoff value would be most appropriate for determining “positivity” in subcortical regions. One consideration in establishing such a cutoff is that the cortical uptake measure samples from a larger number of voxels relative to the smaller subcortical ROIs, which may make subcortical SUVRs less reliable and more sensitive to variation. Thus, a single cutoff value for regions of different sizes may not be ideal, perhaps necessitating different normative values for each region. On the other hand, perhaps abnormality should be determined by a range of SUVRs values rather than a particular cutoff, given the drawbacks of dichotomizing a continuous predictor in biomarker research (Royston, Altman, & Sauerbrei, Reference Royston, Altman and Sauerbrei2006).
Despite not having a clear cutoff for “positivity,” the pallidum, putamen, and thalamus all appear to have high SUVRs across preclinical AD stages. The accumbens and caudate are also quite high in the later stages. Older neuropathologic studies in AD patients have shown that the striatum is particularly vulnerable to amyloid deposition and diffuse plaques (Braak & Braak, Reference Braak and Braak1990; Suenaga, Hirano, Llena, Yen, & Dickson, Reference Suenaga, Hirano, Llena, Yen and Dickson1990), especially the caudate, rostral putamen, and accumbens (Brilliant, Elble, Ghobrial, & Struble, Reference Brilliant, Elble, Ghobrial and Struble1997). The hippocampus, on the other hand, is an area that shows a low level of amyloid deposition until late in the disease (Arriagada, Growdon, Hedley-Whyte, & Hyman, Reference Arriagada, Growdon, Hedley-Whyte and Hyman1992; Giannakopoulos, Hof, Michel, Guimon, & Bouras, Reference Giannakopoulos, Hof, Michel, Guimon and Bouras1997; Price, Davis, Morris, & White, Reference Price, Davis, Morris and White1991), consistent with our finding that SUVR levels in the hippocampus did not increase across stages of preclinical AD.
The pattern of observed SUVRs raises questions regarding the timing and/or sequence of amyloid accumulation between cortical and some allocortical and subcortical regions. At face value, our results appear to suggest that subcortical amyloid deposition occurs early in the disease process, and that the buildup of amyloid may be more complete in subcortical areas relative to cortical areas, even by the earliest phases of preclinical AD. However, such a sequence of amyloid accumulation would contradict the cascade of events that has been described in the literature which is a downward progression of Aβ from neocortex to subcortical regions (e.g., thalamus and striatum) (Braak & Del Tredici, Reference Braak and Del Tredici2015; Thal, Rüb, Orantes, & Braak, Reference Thal, Rüb, Orantes and Braak2002).
Although studies have shown early subcortical Aβ deposition in the basal ganglia and thalamus in autosomal dominant forms of AD (Klunk et al., Reference Klunk, Price, Mathis, Tsopelas, Lopresti, Ziolko and DeKosky2007; Bateman et al., Reference Bateman, Xiong, Benzinger, Fagan, Goate, Fox and Morris2012; Cho et al., Reference Cho, Seo, Kim, Suh, Lee, Choe and Na2013), this has not been described in late-onset sporadic AD. Therefore, rather than being indicative of an alternate sequence of amyloid accumulation in late-onset sporadic AD, the current findings may point to a lack of correspondence between subcortical florbetapir PET SUVRs and the underlying neuropathology. Hatsuta et al. (Reference Hatsuta, Takao, Ishii, Ishiwata, Saito, Kanemaru and Murayama2015) found that 11C-Pittsburgh compound B (PiB) uptake in cortical regions was highly correlated with amyloid deposition and neuritic plaques at autopsy in patients with dementia; however, PiB uptake in subcortical grey matter (i.e., basal ganglia, thalamus, amygdala) did not show these associations. In a previous study, subcortical PiB uptake in the putamen and thalamus were found to be high regardless of whether a patient had amyloid aggregates at biopsy (Leinonen et al., Reference Leinonen, Alafuzoff, Aalto, Suotunen, Savolainen, Nagren and Rinner2008). The current findings dovetail nicely with this work and suggest that the discrepancy between subcortical SUVRs and histopathological measures of amyloid deposition/neuritic plaques could extend to a preclinical AD group, although clearly more work is needed to explore this hypothesis.
An alternative interpretation of our findings is that amyloid deposition in certain subcortical regions is non-specific and unrelated to risk for future development of AD. Previous studies have reported amyloid positivity in up to one-third of cognitively normal older adults (Chételat et al., Reference Chételat, La Joie, Villain, Perrotin, da La Sayette, Eustache and Vandenberghe2013; Sperling et al., Reference Sperling, Mormino and Johnson2014); however, the clinical implications of these elevations in asymptomatic individuals remain uncertain (Leuzy, Zimmer, Heurling, Rosa-Neto, & Gauthier, Reference Leuzy, Zimmer, Heurling, Rosa-Neto and Gauthier2014; Sperling et al., Reference Sperling, Mormino and Johnson2014). It is also possible that subcortical disease may be contributing to our findings of high SUVRs in some subcortical regions. Although participants with significant vascular burden (Hachinski Ischemic Score of>4) were excluded from the ADNI sample, previous research has shown the presence of vascular pathology in ADNI’s cognitively normal participants (Nettiksimmons et al., Reference Nettiksimmons, Beckett, Schwarz, Carmichael, Fletcher and Decarli2013) and MCI participants (Toledo et al., Reference Toledo, Cairns, Da, Chen, Carter, Fleisher and Trojanoswki2013). Future studies examining vascular risk factors and vascular biomarkers in stages of preclinical AD are needed to address this possibility.
In sum, our analysis of the florbetapir PET imaging data in the ADNI cohort demonstrates unique patterns of amyloid burden in cortical and subcortical regions before a clinical diagnosis. Longitudinal research will be important to further understand how biomarkers of subcortical amyloid are related to the mechanistic pathways underlying AD, and whether the presence of amyloid in striatal or other subcortical regions may add predictive power in determining who is most likely to progress to AD. Beach and colleagues (Reference Beach, Thal, Zanette, Smith and Buckley2016) have recently suggested that amyloid imaging of the cerebral cortex and striatum together may increase accuracy in making a clinicopathological diagnosis of AD and in the pathology-based clinical staging of AD. Perhaps this type of clinical staging could be applied even earlier in the disease process if longitudinal findings ultimately show that “cognitively normal” individuals with both cortical and striatal amyloid burden have an increased risk of progressing to MCI or AD.
A limitation of our study was ADNI’s use of Freesurfer to delineate the ROIs. Although scans underwent a quality control process by ADNI, previous research has shown that Freesurfer’s segmentation accuracy is decreased in subcortical structures (e.g., thalamus; Eggert, Sommer, Jansen, Kircher, & Konrad, Reference Eggert, Sommer, Jansen, Kircher and Konrad2012). An additional limitation is that neuropsychological measures were corrected for age only, as normative data correcting for age, education, and sex were not available for all measures. A strength of our study was our ability to compare the two classification systems for preclinical AD. We demonstrated that the NIA-AA method essentially produced the same pattern of results as our novel staging method. The “SNAP” and “Unclassified” groups were largely comparable to Stages 0 and 1; therefore, separating these two groups based on their sequence of biomarker abnormalities neither improved nor informed the characterization of preclinical AD at baseline. Our previous work has also shown that these additional categories did not improve the prediction of who progressed to MCI/AD, since most participants who progressed did not follow the temporal order proposed by NIA-AA criteria (Edmonds, Delano-Wood, Galasko, et al., Reference Edmonds, Delano-Wood, Galasko, Salmon and Bondi2015). Similarly, other studies have shown that both “amyloid-first” and “neurodegeneration-first” (i.e., SNAP) biomarker profile pathways to preclinical AD exist (Jack, Wiste, et al., Reference Jack, Wiste, Weigand, Knopman, Lowe, Vemuri and Petersen2013), and that individuals with subtle cognitive decline but no neurodegeneration (i.e., Unclassified) progress to MCI/AD at a relatively high rate (Toledo et al., Reference Toledo, Weiner, Wolk, Da, Chen, Arnold and Trojanowski2014). By combining sophisticated imaging biomarkers with detailed cognitive assessment to better characterize stages of preclinical AD, we can advance our understanding of which individuals are at risk for future progression, with the hope that eventually disease-modifying interventions can be provided early in the course of the disease.
ACKNOWLEDGMENTS
Dr. Salmon serves as a consultant for Bristol-Myers Squibb. The other authors report no disclosures. This work was supported by the NIH grants R01 AG049810, K24 AG026431 and P50 AG05131. Data collection and sharing for this project was funded by the Alzheimer’s Disease Neuroimaging Initiative (ADNI) (National Institutes of Health Grant U01 AG024904) and DOD ADNI (Department of Defense award number W81XWH-12-2-0012). ADNI is funded by the National Institute on Aging, the National Institute of Biomedical Imaging and Bioengineering, and through generous contributions from the following: AbbVie, Alzheimer’s Association; Alzheimer’s Drug Discovery Foundation; Araclon Biotech; BioClinica, Inc.; Biogen; Bristol-Myers Squibb Company; CereSpir, Inc.; Eisai Inc.; Elan Pharmaceuticals, Inc.; Eli Lilly and Company; EuroImmun; F. Hoffmann-La Roche Ltd and its affiliated company Genentech, Inc.; Fujirebio; GE Healthcare; IXICO Ltd.; Janssen Alzheimer Immunotherapy Research & Development, LLC.; Johnson & Johnson Pharmaceutical Research & Development LLC.; Lumosity; Lundbeck; Merck & Co., Inc.; Meso Scale Diagnostics, LLC.; NeuroRx Research; Neurotrack Technologies; Novartis Pharmaceuticals Corporation; Pfizer Inc.; Piramal Imaging; Servier; Takeda Pharmaceutical Company; and Transition Therapeutics. The Canadian Institutes of Health Research is providing funds to support ADNI clinical sites in Canada. Private sector contributions are facilitated by the Foundation for the National Institutes of Health (www.fnih.org). The grantee organization is the Northern California Institute for Research and Education, and the study is coordinated by the Alzheimer’s Disease Cooperative Study at the University of California, San Diego. ADNI data are disseminated by the Laboratory for Neuro Imaging at the University of Southern California.
SUPPLEMENTARY MATERIAL
For supplementary material/s referred to in this article, please visit https://doi.org/10.1017/S1355617716000928