Introduction
Obesity is a complex and multifactorial condition, considered one of the main public health problems today. Excess weight in both children and adults can contribute to the development of serious comorbidities such as diabetes, cardiovascular diseases, hypertension, and respiratory problems, thus raising mortality rates associated with obesity.1 In addition, obesity is also related to changes in the reproductive function in both genders, which can lead to infertility and post-pregnancy complications.2
To study obesity/overweight control and treatment strategies and/or their comorbidities, experimental methods are used on laboratory animals, involving the consumption of hypercaloric diets, high-fat, high-sugar cafeteria diets, litter reduction, among others.Reference Cesaretti and Kohlmann Junior3
The litter reduction method in rodents consists in the reduction of the number of pups on the second day of postnatal life to three to five animals per mother, aiming at lower competitiveness regarding food resources and consequently favoring greater breast milk availability.Reference Bei, Jia and Jia4 Overfeeding during the infancy phase, an important period concerning the development of various organs and systems, can lead to hormonal dysregulation through epigenetic pathways, with the potential of altering hypothalamic pathway ontogeny, leading to lack of control over energy balance, increased appetite, and decreased energy expenditure.Reference Plagemann, Harder and Rake5
These metabolic alterations generated by infant overfeeding may contribute to serious comorbidities such as diabetes, cardiovascular diseases, hypertension, and respiratory problems, consequently raising the mortality rates associated with obesity.1 It is known that, besides causing the problems described earlier, obesity is also related to alterations in the reproductive function of both genders causing infertility and post-pregnancy complications.2 The reproductive capacity in the adult life of these individuals can also be affected by several stimuli that act during different development stages, which can be mediated by alterations in the hypothalamic-pituitary-gonadal axis.Reference Zambrano, Guzmán, Rodríguez-González, Durand-Carbajal and Nathanielsz6
In male Wistar rats, both the physical and molecular structure of spermatozoa can be affected.Reference Palmer, Bakos, Fullston and Lane7 In females, studies such as those carried out by Bei et al. Reference Bei, Jia and Jia4 and Sánchez-GarridoReference Sánchez-Garrido, Ruiz-pino and Manfredi-lozano8 demonstrated that the litter reduction method associated to the administration of a high-fat diet is able to generate metabolic and overweight disorders as well as decreases in luteinizing hormone (LH) and estradiol levels in blood by kiss1 gene expression suppression responsible for LH stimulation/release.
Although metabolic alterations that support the development of obesity in rats from small litters have been reported, no studies regarding their effects on the reproductive capacity of this model are available, since overweight/obesity is capable of altering the various mechanisms that act on the reproduction of these animals. Therefore, the aim of the present study was to evaluate overfeeding effects induced by the litter reduction protocol on the reproductive parameters of male and female Wistar rats.
Material and methods
Subjects
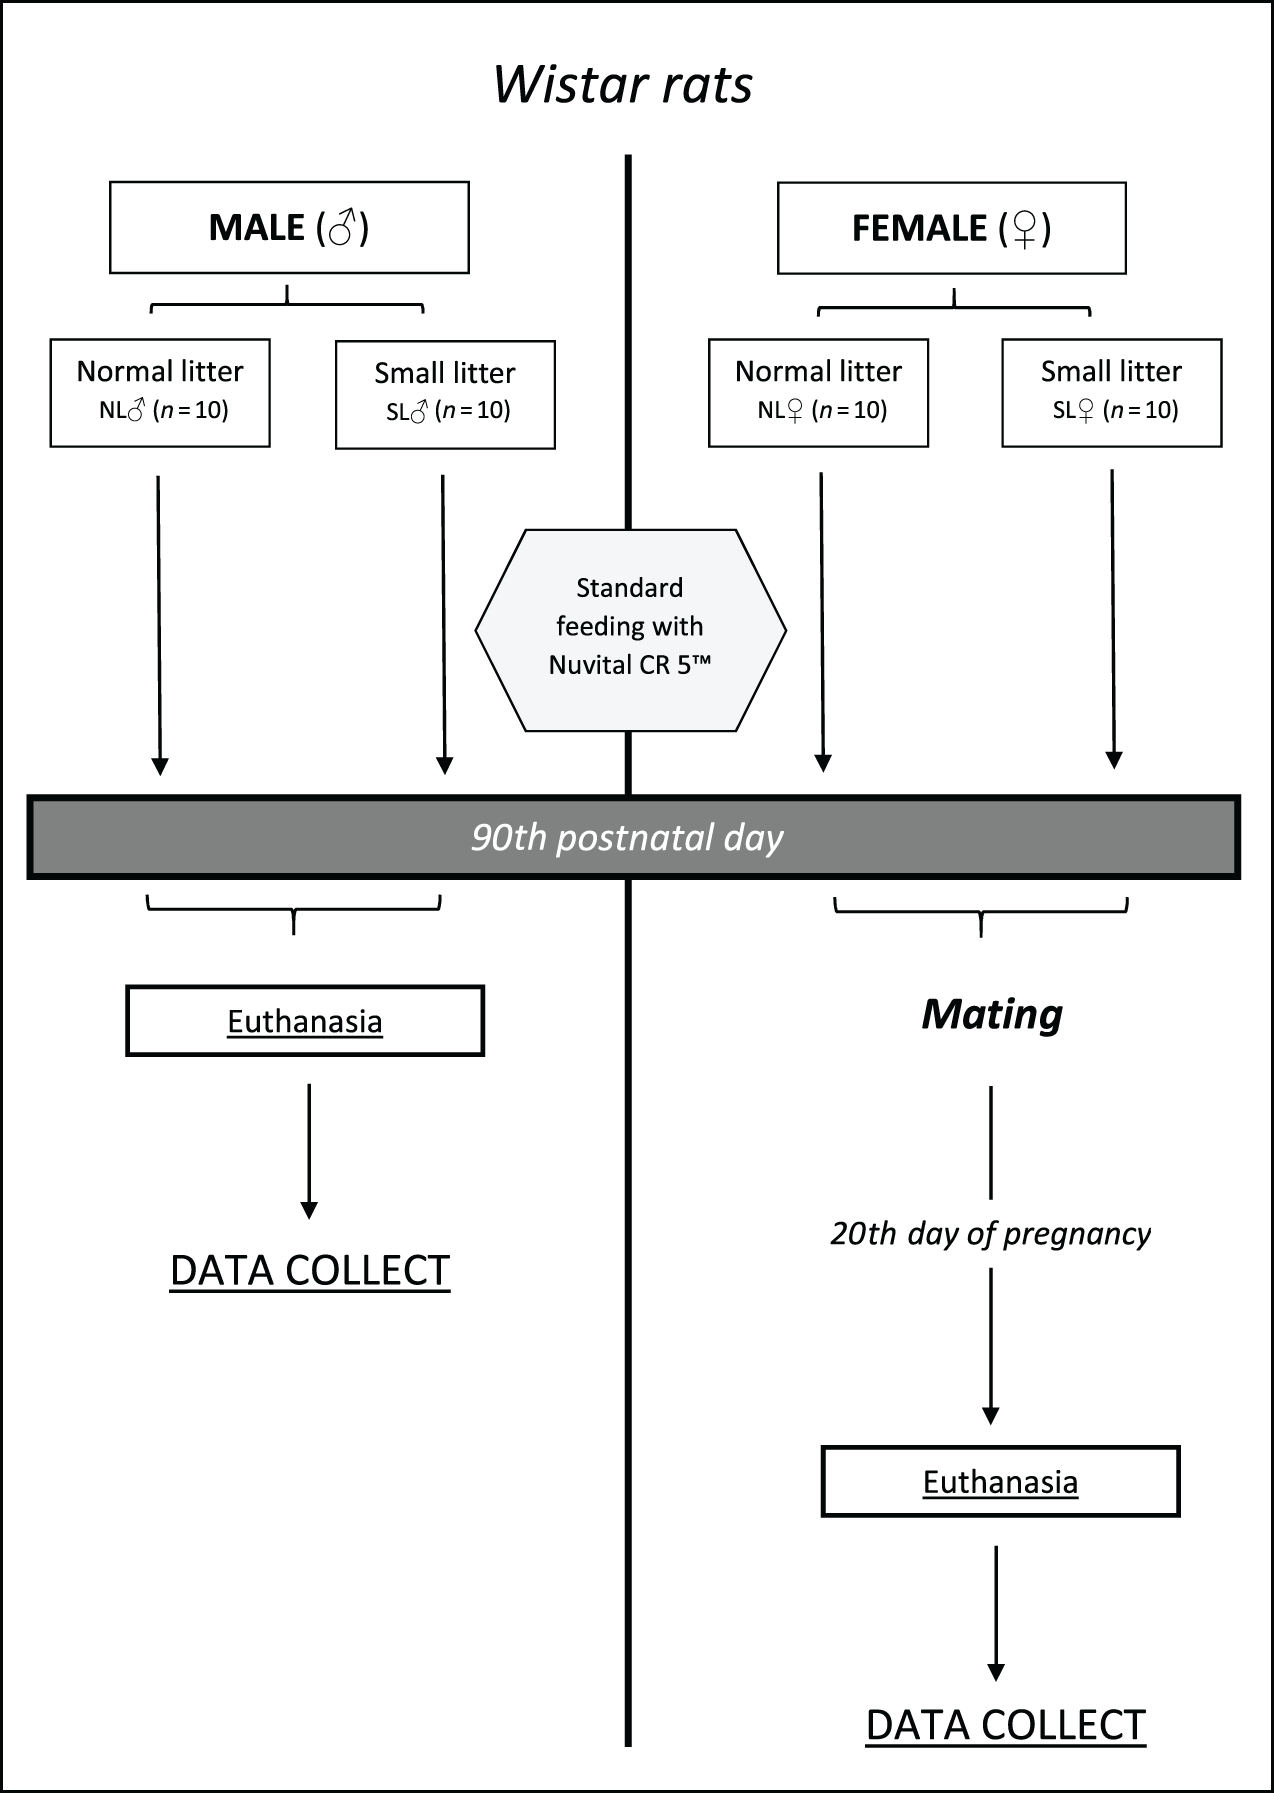
Fourteen Wistar rats (Rattus norvegicus L. Berkenhout, 1769) were used, 20 males and 20 females, distributed in four experimental groups: one comprising 10 normal litter female rats (NL♀) and another with 10 female rats from a small litter (SL♀) (Fig. 1). The same was carried out with males (NL♂ and SL♂, respectively). The animals were supplied by the breeding laboratory and maintained at the experimental biology laboratory at the Federal University of Juiz de Fora (UFJF), Brazil, – CIAEP nº 01,0048,2013 – in ALESCO™ microisolators (Brazil) lined with selected non-sterilized shavings, equipped with a wire trough for pellet-type feed and bottle-type polypropylene bottle feeders filled with filtered water.
Schematic overview of the project.

The cages were maintained in ventilated ALESCO™ racks at a controlled temperature of 22 ± 2°C. The animals were housed in rooms with controlled light/dark cycle of 12 hours. All procedures were approved by the UFJF Ethics Committee on the Use of Animals (CEUA / UFJF – protocol no. 045/2015).
Litter reduction protocol
On the second postpartum day, offspring from the NL and SL groups were reassigned into four subgroups, two comprising only female offspring (NL♀ and SL♀) and two comprising only male offspring (NL♂ and SL♂), leaving 10 females/males for each mother in the NL groups and 4 females/males for each mother of the SL group. Weaning occurred on the 21st postnatal day, followed by feeding with Nuvital CR 5™ commercial feed for all animals.
Body weight evolution and food consumption progress
The body weight of NL and SL animals was recorded weekly from the 4th postnatal day to the 90th day of life. Weight evolution was calculated by the difference between the body weights of the animals measured from a previous week by the subsequent one. Food consumption was also recorded weekly by the difference in weight between the amount of offered food and the remaining amount 24 hours after food supplying. All analyses measured on an analytical scale (Bioprecisa™, specificity of 0.0001 g, Brazil) and data were expressed in an area under the curve.
Oral glucose tolerance test
At 90 postnatal days, the animals were submitted to a 6-hour fasting period and blood was collected to measure capillary glycemia at T0 (time zero). Subsequently, 2 g/kg body weight of a 50% glucose solution were intragastrically administered, and blood samples were then collected at T1 (15 min), T2 (30 min), T3 (60 min), and T4 (120 min).Reference Silva, Santos and Franca9 The tail lance method was used for blood collection and all samples were analyzed on an AccuChek Advanced capillary gauge (Roche™, Germany). The data were expressed in an area under the curve.
Insulin tolerance test (ITT)
The insulin tolerance test (ITT) was performed one week after the oral glucose tolerance test (OGTT) and also after the 6-hour food fast. All animals received SLH insulin (Novolin™ N-Novo Nordisk, Bagsvaerd, Denmark) intraperitoneally at 1 IU/kg body weight after blood glucose measurement at T0 (baseline) and subsequent times of T5 (5 min), T15 (15 min), T30 (30 min), and T45 (45 min).Reference Hirata, Alvarez-Rojas, Campello Carvalheira, De Oliveira Carvalho, Dolnikoff and Abdalla Saad10 The constant rate for glucose disappearance (Kitt) was computed through the formula 0.693/(t1/2), where t1/2 is calculated from the slope of the smallest quadratic analysis of plasma glucose concentrations after insulin administration. Blood was collected by the same method described for OGTT.
Female mating
After 90th postnatal day, all females of each group were submitted to mating with breeding males from a normal litter from the colony of the Center of Reproductive Biology. After confirmation of the proestrus analyzed by vaginal smears, the males were placed in the female cages at dusk and remained there for 16 hours. Subsequently, the animals were separated and the females submitted to a new vaginal smear procedure. The first day of gestation was confirmed by the presence of vaginal or sperm buffer in the vaginal smears. On the 20th day of pregnancy, females were weighed and euthanized.
Euthanasia procedure
All animals were euthanized by cardiac exsanguination following anesthesia and diaphragmatic rupture supplementation – Normative Resolution No. 37 CONCEA.Reference Raupp11 The anesthetic protocol combined the dissociative anesthetic chetamine hydrochloride at a 90 mg/kg dose (Vetanarcol™, Konig, Brazil) and the sedative and myorelaxant xylazine hydrochloride at a 10 mg/kg dose (Kensol™, Konig, Brazil). The two drugs were mixed and applied intraperitoneally, according to the anesthesia protocol recommended by Wolfensohn and Lloyd.Reference Lloyd and Wolfensohn12 A minimum of 5 min was allowed prior to diaphragmatic rupture. The weights of the male and female reproductive organs as well as retroperitoneal and perigonadal adipose tissue were also measured on an analytical scale (Bioprecisa™, specificity of 0.0001 g, Brazil) and weight corrected by body weight, establishing the relative weight for each animal. The retroperitoneal and perigonadal adipose tissue were considered as adiposity.
Reproductive analyses
Males
Testicular descent and differentiation of penile gland morphology
At 15th postnatal day until the appearance of the variable, animals were monitored daily to check testicular descent. At 25th postnatal day, differentiation of the penile gland morphology was also monitored, identifying the day of the appearance of the three differentiation phases (A, B, and C), observed according to Yamasaki et al. Reference Yamasaki, Sawaki, Noda, Muroi and Takatsuki13 Phase A is characterized by a projecting structure in the penis gland, which begins with a gradual change to a W shape (phase B), and a subsequent change from the W shape to a flattened surface (phase C). These variables were analyzed by the same trained observant. The day of the testicular descent and the phases of the gland morphology were expressed as the mean of the day on which the events occurred.
Sperm counts
Immediately after euthanasia, spermatozoa were collected from epididymal secretions through a small incision of the tail of the left epididymis. Secretions were placed in 50 μL of a PBS buffer solution (Sigma ) and mixed. After homogenization with PBS, a 20 μL aliquot was removed and placed in 6 mL of distilled water to immobilize the spermatozoa (dilution 1:300) for counting on a Neubauer chamber using a model BH-2 optical microscope (Olympus™, Japan) at 40x magnification. The mean sperm count values of the four lateral quadrants on both sides of the chamber were considered to calculate the sperm concentrations using the formula:
Sperm concentration (sptz/mL) = Means × 300 × 104, where the number 300 represents the dilution factor and 104 the correction factor of the chamber to obtain the number of sperms per mL.
Evaluation of spermatic vitality
Spermatozoon smears were performed and stained by the Nigrosina eosin technique,14 where 200 spermatozoa from each animal, classified as living or dead, were evaluated under a BH-2 optical microscope (Olympus™, Japan) at 1000× magnification. Data were expressed as percentage of live spermatozoa.
Sperm morphology evaluation
Spermatozoa smears were obtained and stained by the Shorr technique for the determination of the abnormality index and morphological classification.14 A total of 200 spermatozoa were analyzed and classified as normal or abnormal using a BH-2 optical microscope (Olympus™, Japan) at 1000× magnification. Abnormal alterations comprised head (amorphous) and tail (broken and coiled) defects, according to Seed et al. Reference Seed, Chapin and Clegg15 and Oshio et al. Reference Oshio, Ribeiro, Marques, Guerra, da Matta and Reis16
Histometric analyses
The right epididymis and right testis were used for the hystometric analyses. The epididymis was fixed in Bouin for 24 hours. The testis was fixed in a modified Karnovsky fixative (4% paraformaldehyde: 4% glutaraldehyde in 0.1 mL/L phosphate saline buffer, pH 7.4). The organs were included in paraffin, sectioned at 5 μm thickness for epididymide Gomori trichrome staining and testicle hematoxylin and eosin staining. The height of the epididymis epithelium was determined from four measurements per tubule in 10 transverse tubules/animal in the initial segment and in the epididymis caudal area. Mean tubule epithelium height was calculated and six animals per group were analyzed. The epithelium height of the seminiferous tubule was determined by calculating the means of four opposite measurements (basal lamina to the last nucleated round spermatid). The luminal diameter was calculated by the difference between the total diameter and the sum of two horizontal epithelium heights. The most circular tubules of six testicles per group were analyzed, totaling 20 tubules per animal. Histological sections were photographed using an AXIOPHOT HBO50 (Zeiss™) optical microscope with a coupled camera (AXIOCAM ICc3, Zeiss™). The Image Pro Plus™ version 6 software was used for the measurements.
Females
Vaginal opening
From the 21st postnatal day, females of both groups were inspected daily for vaginal membrane rupture.
Dissection, female reproductive organ weighing and fetal analyses
After euthanasia, necropsy and removal of right and left ovaries were carried out in the females. Luteal bodies were counted using a stereoscopic Steime SV-6 microscope (Zeiss™, Germany) and the total number of implants and resorptions in the uterine horns were quantified.
Uteri were weighed with contents and the final body weight of the females was considered by calculating the difference between the weights obtained before euthanasia and the weights of the uterus with contents. Weights and the number of live and dead fetuses and their respective placentas were also obtained and separated by sex. Fetal nasal length was determined with a digital caliper.
After fetus euthanasia, external morphologies were analyzed, considering upper and lower limbs morphology and the presence or absence of polydactyly and syndactyly. Cranioschisis, micro or anophthalmia, cleft palate, cleft lip, and macro or microglossia present in the fetus were also assessed.Reference Yakubu, Adeshina and Oladiji17 All analyses were carried out with a Steime SV-6 microscope (Zeiss™, Germany).
The following indices were calculated: gestation = (total number of mated females that remained pregnant/number of not pregnant mated females) × 100; implantation = (total number of deployments/total number of corpora lutea) × 100; birth = (total number of fetuses/total number of implantation) × 100; preimplantation losses = (total number of corpora lutea × total number of implantations/total number of corpora lutea) × 100; fetal malformations = (total number of malformations/total number of fetuses) × 100.Reference Balasinor, Gill-Sharma, Parte, D’souza, Kedia and Juneja18
Statistical analyses
The Shapiro–Wilk test was performed to verify data normality. Comparisons between the NL and SL groups were carried out using Student’s t-test or the Mann–Whitney test for parametric or nonparametric data. OGTT results were obtained by calculating the total area under the glycemic curve. Significance levels were set at p < 0.05. All analyses were performed using the SPSS™ (Statistical Package for the Social Sciences) programs, Summer 21 (New York, USA) and Graphpad Prism™ – Version 5 (La Jolla, USA) softwares.
Results
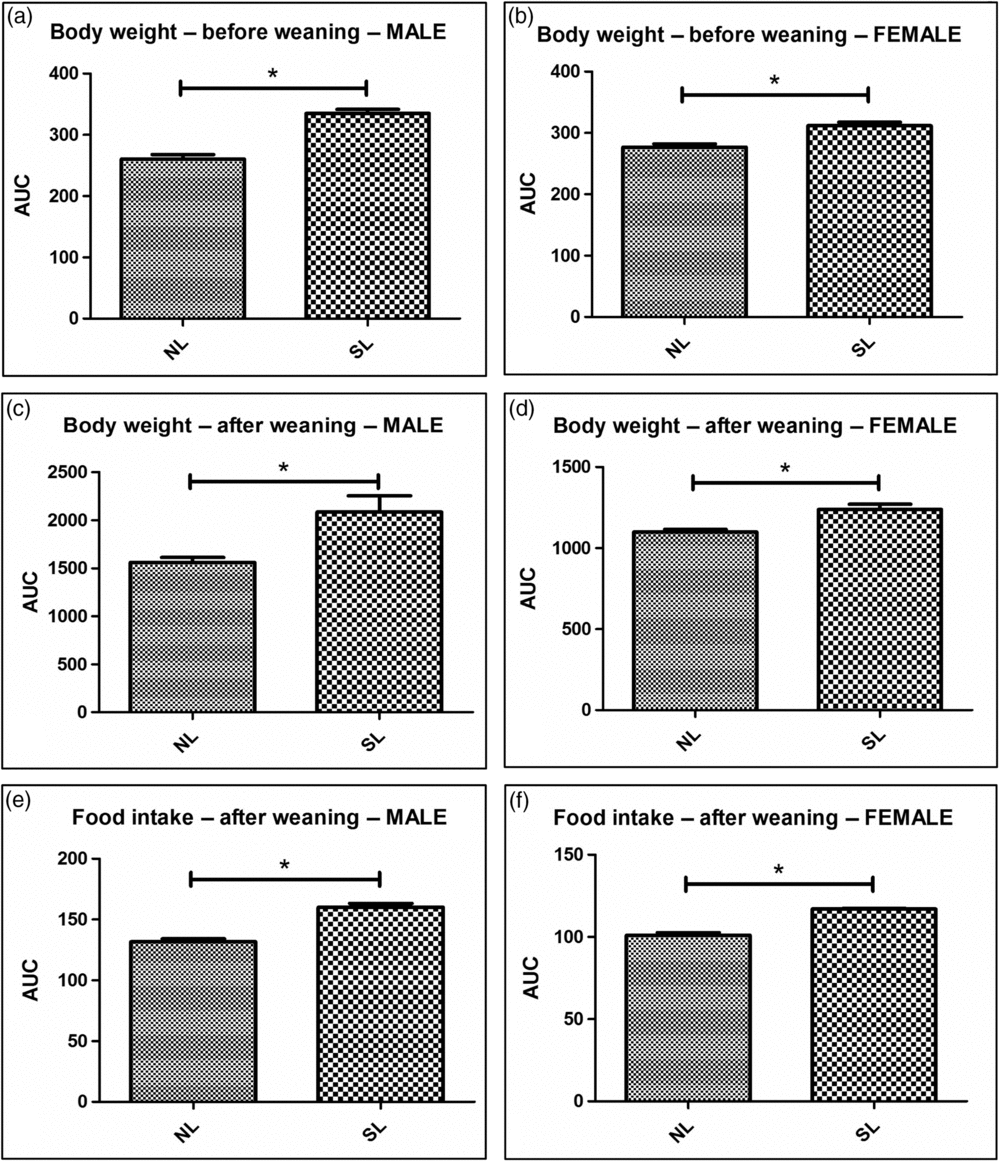
The body weight of SL males prior to weaning was significantly higher from the 4th day of life when compared with NL animals and was maintained after weaning in all evaluated time frames (Fig. 2). In females, this difference was detected from the 10th postnatal day until weaning, also remaining at all evaluated points after time frames (Fig. 2).
Male and female body mass and food intake. Male (a) and female (b) body mass before weaning. NL, SL male (c) and female (d) body mass after weaning. NL, SL male (e) and female (f) food intake after weaning. Results are presented as means and standard deviation. Ten rats were used for both groups for all parameters. *NL and SL intergroup differences. p < 0.05.

As displayed in Fig. 2, SL males presented significantly higher feed intake than NL. Regarding NL and SL female feed intake, a significant increase in the SL group was observed in relation to NL animals.
Regarding body weight after weaning, both SL males and females presented significantly higher values when compared with their respective NL groups (Fig. 2).
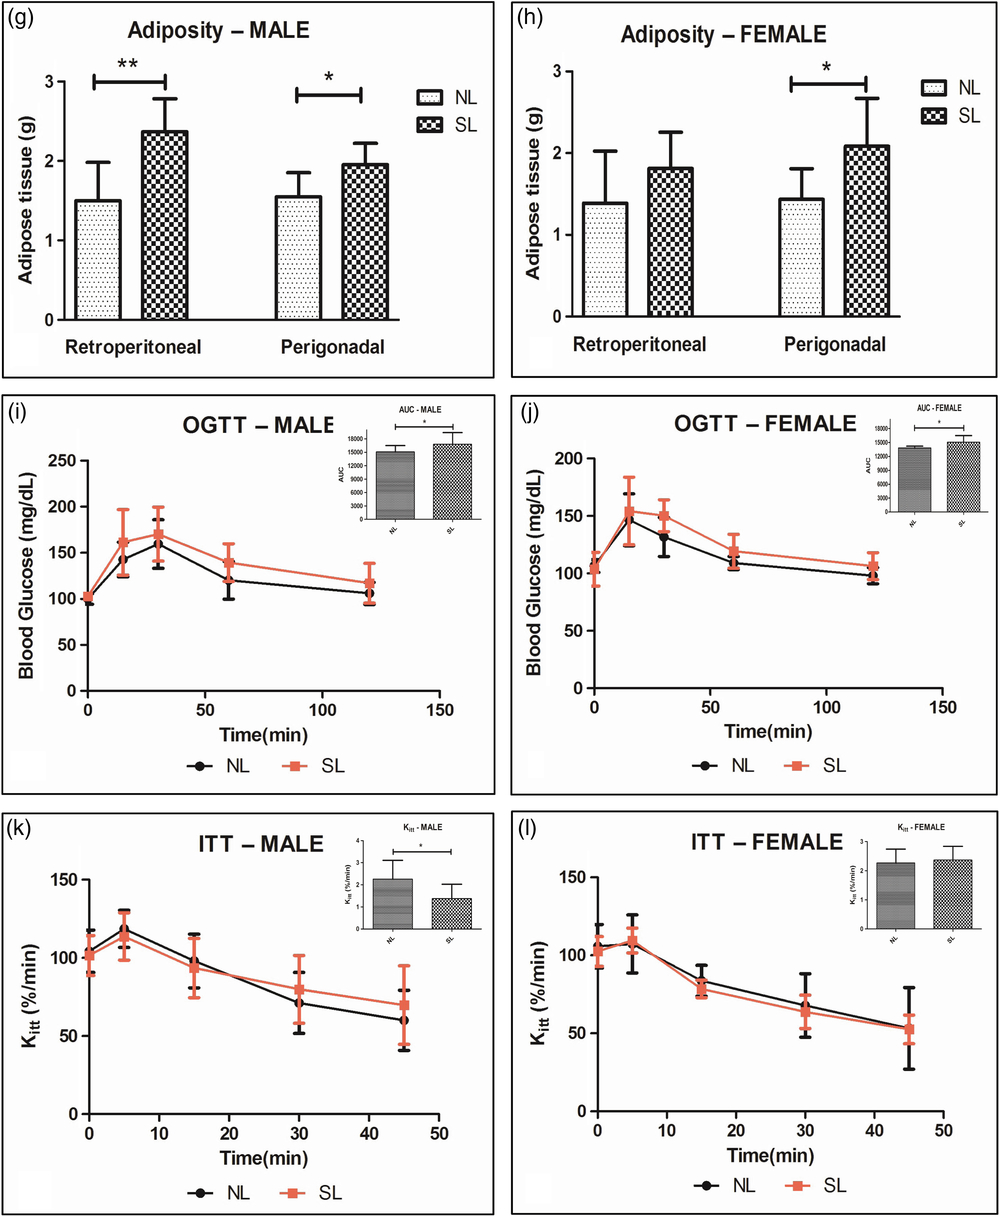
Adiposity was significantly higher in SL males when compared with NL males, with a 26% increase for relative perigonadal fat weight and 58% for retroperitoneal fat. In females, a significant difference in the relative weight of the perigonadal adipose tissue compared with the SL group was noted, with a 45% increase when compared with the NL group. Although no significant difference in the relative weight of retroperitoneal adipose tissue in females was observed, the means of the SL group was 31% higher when compared with the means of the NL group (Fig. 3).
Relative weight of retroperitoneal and perigonadal adipose tissue in males and females. Oral glucose tolerance test (OGTT) and Insulin tolerance test (ITT) in males and females. Male OGTT (i) and respective area under the curve; Female (j) OGTT and respective area under the curve; (k) Male ITT and respective Kitt; (l) Female ITT females and respective Kitt. Results are presented as means and standard deviation. Ten rats were used for both groups for all parameters. *,**NL and SL intergroup differences. p < 0.05.
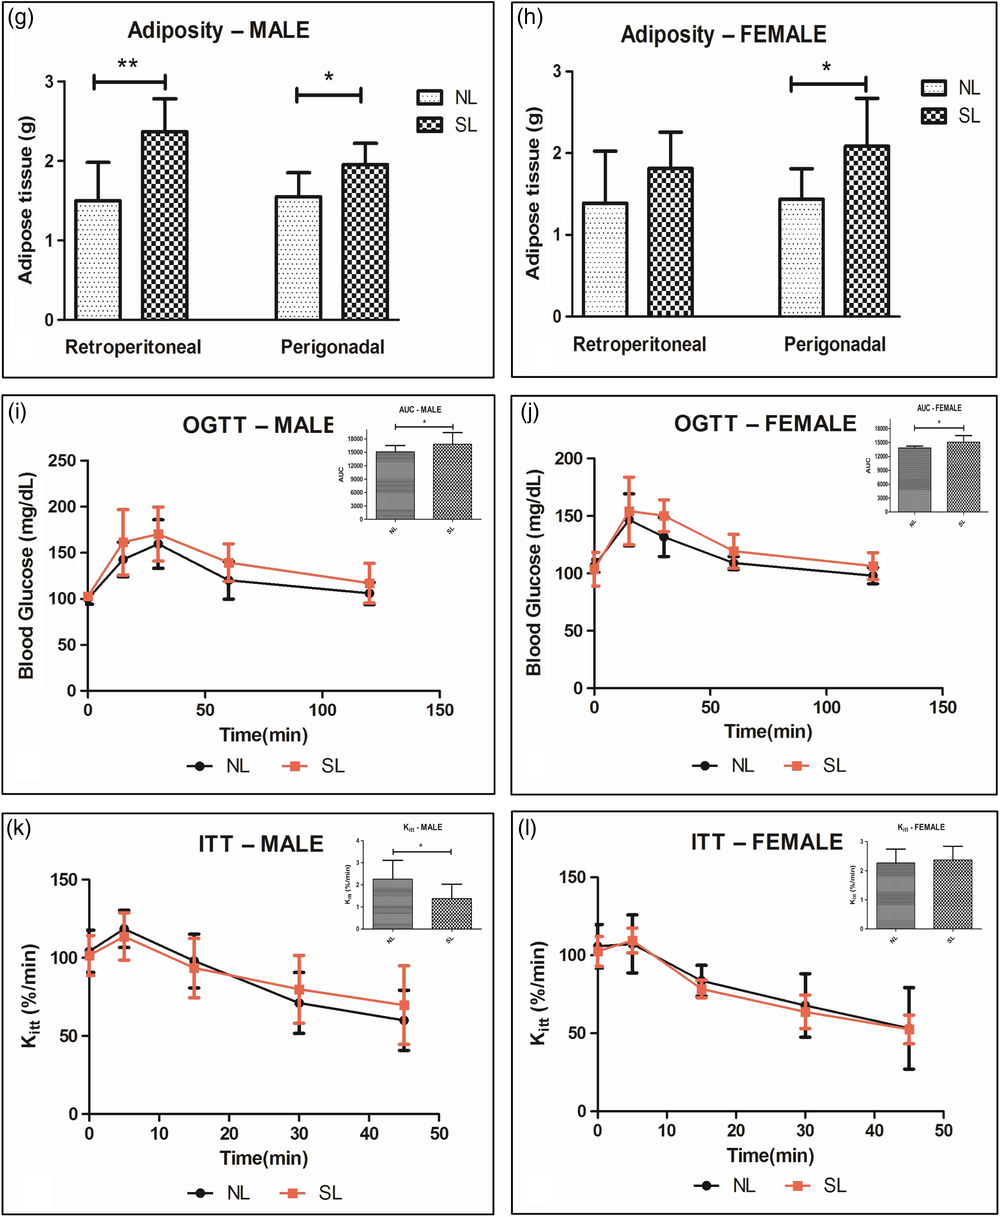
Figure 2 also displays the OGTT results for NL males and females compared with the SL groups. The mean area under the SL males curve was 11.2% higher compared with the NL animal results. A significant difference was also detected for female OGTT results, with the SL group presenting mean area under the curve 9% higher compared with the NL group.
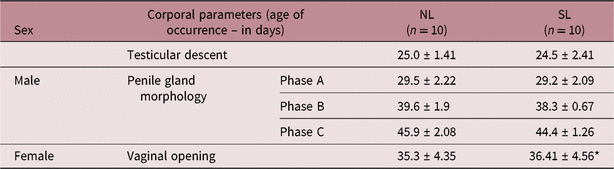
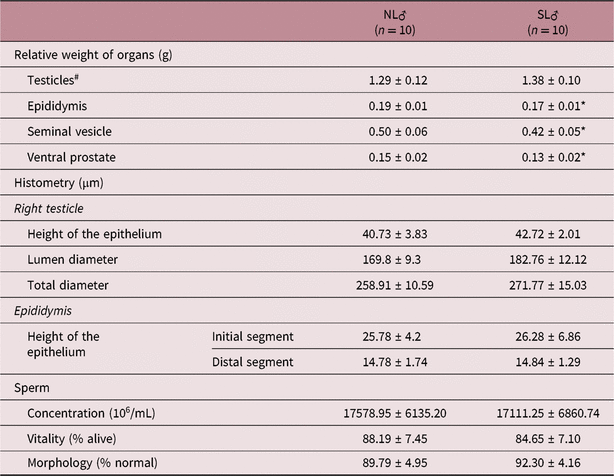
Regarding the male reproductive analyses, no differences were noted for testes descent or gland morphology (Table 1) between the NL and SL groups. Concentration, vitality, and sperm morphology were also not statistically different (Table 2), although SL animals presented a 10.52% reduction in the relative weight of the epididymis, a 12.5% decrease for the seminal vesicle, and a 13.3% decrease in prostate weight compared with the NL animals, and also presents a significant difference on the vaginal opening in period in SL females in comparison with the control group (Table 1).
Evaluation of puberty onset in rats of the normal litter group (NL) compared with the small litter group (SL).

Results are presented as means and standard deviation. *NL and SL intergroup differences. p < 0.05.
Evaluation of organs weight, histometry, and sperm parameters in rats of the normal litter group (NL) compared with the small litter group (SL).

Results are presented as means and standard deviation. #Absolute weight of the testicles. *NL and SL intergroup differences. p < 0.05.
Regarding histometry, no significant alterations of the seminiferous tubule and epididymis were observed between NL and SL animals (Table 2).
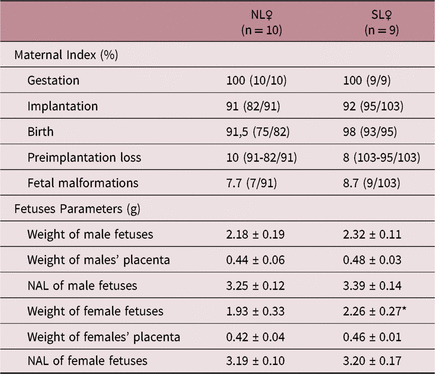
The results of the assessed female reproductive variables are presented in Table 3, where the first sought to evaluate their reproductive capacity through gestational indexes and the second aimed at fetal analyses, with a significant difference in the weight of female fetuses between the SL and NL groups.
Evaluation of gestation, implantation, birth, pre-implantation losses indexes, as well as fetal malformations, naso-anal length (NAL), placental and fetus weights in animals of the normal litter group (NL) compared to the small litter group (SL).

Results are presented as percentage, means and standard deviation. *NL and SL intergroup differences. p < 0.05.
Discussion
Some of the overweight/obesity pathophysiological mechanisms and their complications can be clarified through the litter reduction method in rats, since it is known that the weight gain during the first postnatal weeks is related to the disease development and its comorbidities.Reference Stettler, Stallings and Troxel19
Our findings indicate that males exposed to overfeeding during the lactation period present higher feed intake, body weight, retroperitoneal and perigonadal fat, and glucose intolerance as adults, demonstrating that the litter reduction model for the study of overnutrition effects is effective for long-term overweight/obesity induction, also reported by Plagemann et al.,Reference Plagemann, Harder and Rake5 Boullu-Ciocca et al.,Reference Boullu-Ciocca, Dutour, Guillaume, Achard, Oliver and Grino20 and Collden et al. Reference Collden, Balland and Parkash21
In males, obesity is associated with low levels of total testosterone due to decreased levels of Sexual Hormone Binding Globulin (SHBG), since testosterone binds with high affinity to this globulin with 98% of circulating testosterone bound to SHGB or albumin and 2% is in its free form.Reference Kokkoris and Pi-Sunyer22 As a consequence, the ratio of free testosterone to total testosterone is higher in obesity conditions, and the total dosage of this hormone is subject to fluctuations induced by the quantitative variations of carrier proteins, especially SHBG.Reference Vieira, Nakamura, Ferrer, Tachibana, Endo and Carvalho23
Thus, when analyzing glycemic metabolism in SL males, a lower insulin sensitivity in the ITT test was noted, with insulin resistance being a subnormal response in glucose uptake by cells, especially in muscle and fatty cells. As a consequence of lower glucose uptake, higher insulin synthesis is necessary for the maintenance of normal glycemic levels, thus increasing circulating insulin levels, and therefore accompanied by hyperinsulinemia,Reference Cesaretti and Kohlmann Junior3 a condition present in overweight/obese individuals and related to decreased SHBG,2 consequently decreasing testosterone transport.
In addition, SL males presented decreased epididymis, seminal vesicle, and prostate weights. Circulating testosterone linked to carried proteins (SHGB and albumin), upon entering the cell, can be converted into DHT by the action of 5-alpha-reductase on target tissues (epididymis, seminal vesicles, and prostate). DHT is the primary androgen effector in such tissues; so, decreased tissue weight may be related to DHT formation inhibition or the low circulation of SHBG-bound testosterone due to hyperinsulinemia as a consequence of increased peripheral insulin resistance, as shown in the ITT results for the SL group. Depending on the severity of the response, this may or may not be detectable microscopically.24 Herein, epididymis histomorphometry of overfed animals was unaltered.
Free testosterone is the biologically active hormone necessary for normal spermatogenesis.Reference Kokkoris and Pi-Sunyer22 However, inhibition of DHT formation or decreased SHGB concentrations have morphological effects on spermatogenesis. Testosterone levels were not measured herein. But our findings indicate that overfeeding in infancy does not lead to changes in the spermatogenic process in testicular weight or in the sperm analyses carried out, indicating that free testosterone concentrations would have not been altered.
Data from the literature with respect to obesity associated with spermatogenesis are controversial. A review by Cabler et al. Reference Cabler, Agarwal, Flint and Du Plessis25 in both humans and animals, demonstrated the relationship between obesity and decreased sperm concentration, abnormal morphology, compromised chromatin integrity, and abnormal motility. Studies that correlate BMI and sperm concentrations are discrepant, as some demonstrate associations and others do not.Reference Jensen, Andersson and Jørgensen26–Reference Bakos, Henshaw, Mitchell and Lane29 On the relationship between BMI and sperm morphology, MacDonald et al. Reference MacDonald, Herbison, Showell and Farquhar30 carried out a systematic meta-analysis review and concluded that the evidence that allows a link between concentration parameters and sperm morphology with BMI are insufficient; in our findings, overfed animals showed no alterations in spermatic parameters.
On the other hand, several studies have demonstrated that obesity in females is associated with metabolic alterationsReference Plagemann, Harder and Rake5, Reference Sheng and Balonan31, Reference de Souza, Pereira and dos Santos Pereira32 as well as reproductive disorders,Reference Stothard, Tennant, Bell and Rankin33, Reference Johansson, Villamor, Altman, Bonamy, Granath and Cnattingius34 reducing not only the quality of life of the animals, but also maternal health and that of their descendants,
When analyzing females, overfed precociously significant increases in body weight and in food consumption are noted, corroborating the findings reported by Cunha et al.,Reference de Souza, Pereira and dos Santos Pereira32 who demonstrated an increase in milk consumption in Wistar females from small litter, inducing excess weight in their offspring. In addition, SL females also presented increased perigonadal fat when compared with NL females.
Our findings also indicated that overfed females presented glucose intolerance, corroborating the findings reported by Plagemann et al.,Reference Plagemann, Harder and Rake5 Balonan, Sheng,Reference Sheng and Balonan31 and Cunha et al.,Reference de Souza, Pereira and dos Santos Pereira32 who, when analyzing other maternal overfeeding models, observed that maternal nutritional changes are related not only to the possible modifications in their metabolism, but also to the occurrence of future reproductive alterations, with deleterious effects on offspring development.Reference Bihoreau, Ktorza, Kinebanyan and Picon35
Studies such as those carried out by Stothard et al. Reference Stothard, Tennant, Bell and Rankin33 and Johansson et al. Reference Johansson, Villamor, Altman, Bonamy, Granath and Cnattingius34 demonstrated several negative effects of maternal obesity on fetal development, such as congenital anomalies, asphyxia at birth, and other neonatal morbidities. However, the consequences of nutritional alteration caused by overfeeding in animals from a small litter have not yet been completely elucidated.
With respect to maternal reproductive development, a significant delay in the vaginal opening period was observed in overfed females when compared with the control group, indicating a possible delay in puberty onset, disagreeing with the findings reported by Caron et al.,Reference Caron, Ciofi and Prevot36 who analyzed isogenic mice and observed early vaginal opening onset of obese females, obtained applying the litter reduction process, as well as those reported by Biro et al. Reference Biro, Khoury and Morrison37 and Burt Solorzano and McCartney,Reference Solorzano and Mccartney38 who also observed early puberty onset in obese females. These changes can lead to variations in the reproductive axis, including decreased fertility.Reference Donnelly, Blair, Jakicic, Manore, Rankin and Smith39, Reference Brewer and Balen40
A nonsignificant increase was observed in the reproductive profile of overfed females, in the present study, concerning certain parameters such as weight of male fetuses, placenta, and size (nasoanal length) in both sexes. However, only female fetus weight displayed a significant increase when compared with the control group, evidencing possible maternal metabolic alterations and consequences on the development of their offspring. These consequences may be related to the development of an energetically saturated intrauterine environment in mothers who present body fat accumulation and insulin resistance,Reference Bihoreau, Ktorza, Kinebanyan and Picon35 thus exposing fetuses to high amounts of nutrients and leading to accelerated body development, altering the onset of sexual maturity, the development of early metabolic diseases, and associated comorbidities.Reference Regnault, Gillman, Rifas-Shiman, Eggleston and Oken41, Reference Mandò, Calabrese and Mazzocco42
In addition, female reproductive capacity parameters in the present study such as pregnancy rates, implantation, preimplantation losses, and amounts fetal malformations were not statistically different from the controls.
According to the literature and corroborated by the findings reported herein, the negative influence of overweight/obesity on animal metabolism and reproduction verified by different nutritional alteration models is well established. However, these disorders may vary according to sex; sex hormones play an important role in the morphodynamics of obesity and its comorbidities, potentially capable of influencing the amount of food intake and consequent body weight gains.Reference Wang43 Male rodents present higher food intake and intake of kilocalories per gram of body weight when compared with females.Reference Asarian and Geary44
In addition, it has been observed that females suffer less disturbance than males, which may be related to genetic factors derived from sexual dimorphism, where a more significant and accelerated DNA methylation in paternal pronuclei seems to occur when compared with maternal pronuclei.Reference Santos, Peters, Otte, Reik and Dean45, Reference Sanz, Kota and Feil46
However, in the offspring of obese mothers, it is observed that males may suffer developmental alterations, since they may present decreased placenta sizes and consequently greater susceptibility to maternal organism and intrauterine environment disturbances.Reference Van Abeelen, De Rooij, Osmond, Painter, Veenendaal and Bossuyt47, Reference Kim, Young, Grattan and Jasoni48 Female pups appear to undergo greater changes than males, possibly due to changes in mitochondrial DNA as well as the influence of sex hormones such as estrogen in the dysregulation of the insulin-glucose axis and the presence of mitochondrial dysfunction.Reference Taylor49–Reference Zhou, Ribas and Rajbhandari52
Although the subject that surrounds the relationship between overfeeding and its consequences on reproduction is well studied, the range of studies that approach the litter reduction protocol as a method of child overfeeding is limited, let alone studies involving the relationship between this method and the future reproductive consequences of the Wistar rats, thus making it possible to compare and discuss data found in the present study.
Therefore, further studies are needed so that we can better understand this relationship and consequently fill this knowledge gap in the literature.
Conclusion
Overfeeding generated by litter reduction protocol, applied according to the specificities of the present study, was effective in altering metabolic and reproductive patterns such as the increased body weight, adiposity, and decreased relative weight of the seminal vesicle, prostate, epididymis, and modification in the ITT and OGTT glycemic tests in males Wistar. As well as increased body weight, relative perigonadal fat weight, glucose intolerance and modification the day of vaginal opening in female Wistar, as well as increased weight of your female pup.
Author ORCIDs
Vinícius Costa 0000-0002-3651-3225
Acknowledgments
The authors thank the Centro de Biologia da Reprodução e Laboratório de Fisiologia Universidade Federal de Juiz de Fora, Minas Gerais, Brasil.
Financial Support
Redes Mineiras de Bioterismo (CVZ RED – 00009/14) e Toxicologia e Farmacologia (CBB RED – 00008/14) – Fundação de Amparo à Pesquisa de Minas de Gerais – FAPEMIG – Minas Gerais, Brasil.
Conflicts of Interest
None
Ethical Standards
None