


Introduction
Adult mammals have intrinsic body sizes. Their size is determined in newborn mammals if the mothers are healthy and well fed. In the uterus, embryos are also properly regulated to be a specific size at birth.
Two or even nine aggregated morulae transferred to the uterus result in offspring that are normal in size, even though their blastocysts are larger than normal (Tarkowski, Reference Tarkowski1961; Mintz, Reference Mintz1964, Reference Mintz1965; Markert & Petters, Reference Markert and Petters1978; Petters & Markert, Reference Petters and Markert1980; Snow, Reference Snow1981; Petters & Mettus, Reference Petters and Mettus1984; Rands, Reference Rands1986a). Growth patterns in aggregated embryos have been investigated (Buehr & McLaren, Reference Buehr and McLaren1974; Lewis & Rossant, Reference Lewis and Rossant1982). Buehr & McLaren indicated that the downward regulation of growth in aggregated embryos occurs after implantation between 5.5 and 6.5 days post coitum (d.p.c.) but before primitive streak formation (Buehr & McLaren, Reference Buehr and McLaren1974). Lewis & Rossant proposed that cell-cycle timing could be prolonged in the fetus without apoptosis, but that the developmental schedule is not severely influenced in aggregated embryos (Lewis & Rossant, Reference Lewis and Rossant1982).
Meanwhile, in various mammals, embryos in which one or more blastomeres have been separated or destroyed at cleavage division, can develop into normal fetuses and liveborns (Nicholas & Hall, Reference Nicholas and Hall1942; Tarkowski & Wroblewska, Reference Tarkowski and Wroblewska1967; Moore et al., Reference Moore, Adams and Rowson1968; Willadsen, Reference Willadsen1980, Reference Willadsen1981; Willadsen & Polge, Reference Willadsen and Polge1981; Allen & Pashen, Reference Allen and Pashen1984). The half-sized embryo, with a single blastomere that is produced by separating a 2-cell blastomere, develops a normal morphology despite the fact that the proportions of inner cell mass (ICM) and trophectoderm are disturbed in a half embryo compared with a standard embryo (Rands, Reference Rands1985). By investigating the growth patterns in the embryos of single blastomeres from 2-cell embryos, it has been found that the upward regulation of half-sized embryos occurs later than the downward regulation of aggregated embryos in early development. The half embryos are half the size of the control embryos up to 6.5 d.p.c., but grow to normal size by 12 d.p.c. The half embryo results in normal-sized liveborn offspring after transfer to a pseudopregnant recipient mouse (Tarkowski, Reference Tarkowski1959; Tsunoda & McLaren, Reference Tsunoda and McLaren1983; Rands, Reference Rands1986b).
As mentioned above, early mouse embryos are remarkably homeostatic in cell number and size, but it is not clear whether the homeostatic regulation of size is invoked by the embryo itself or by the uterine environment in artificially modified embryos.
At 4.5 days p.c. (d.p.c.), the blastocyst implants to the uterus and then trophoblast cells derived from trophectoderm start to invade. In previous studies of size regulation in mouse early embryos, the sizes and cell numbers of embryos were analysed histologically with the uterus (Lewis & Rossant, Reference Lewis and Rossant1982; Rands, Reference Rands1986a,Reference Randsb; Power & Tam, Reference Power and Tam1993). It has been difficult to analyse post-implantation embryos properly in vitro, but floating mouse embryos can attach to a dish and differentiate to the ICM-like cells and trophectoderm (TE), and then proliferate and elongate with a RPMI-based culture medium (Hogan et al., Reference Hogan, Beddington, Costantini and Lacy1994). The present study investigated the course of growth and morphogenesis in aggregated and half embryos using an in vitro culture system, which enable simulation and temporal analysis at preimplantation and post-implantation without maternal effect.
The purpose of this study was to determine whether or not embryos have an intrinsic mechanism for size regulation using an in vitro culture system. To study the mechanism underlying embryonic size regulation, embryonic histology and cellular number were analysed in aggregated or half embryos compared with those of control embryos.
The results indicated that the mouse embryo might have various manners and patterns by which to regulate their own size in mouse early development.
Materials and methods
Animals
All mice used in this study were bred at the University of Tokyo. All procedures were approved by the institutional Animal Care and Use Committees. The mice were housed in groups of 2–4 with white pine shavings as bedding under a 12 h:12 h photoperiod (lights on at 07:00), with ad libitum access to water and food.
Collection and production of aggregation embryos
B6C3F1 female mice at 8 weeks of age were superovulated by i.p. injection of 7.5 IU pregnant mare serum gonadotrophin (PMSG; Serotropin, Aska Pharmaceutical Co. Ltd., Tokyo, Japan) and 7.5 IU hCG (Gonatropin 3000, Aska Pharmaceutical Co., Ltd) with a 48 h interval. After human chorionic gonadotrophin (hCG) injection, these females were mated with B6C3F1 males. Noon on the day when a vaginal plug was first detected was counted as 0.5 d.p.c. Eight-cell-stage embryos were collected at 2.5 d.p.c. by flushing the oviducts in M2 medium (Sigma, St. Louis, MO, USA). The zona pellucida was removed by acidic tyrode solution (Nicolson et al., Reference Nicolson, Yanagimachi and Yanagimachi1975). The embryos were washed and cultured in M16 medium (Sigma) in a humidified atmosphere of 5% CO2 in air at 37°C (Hogan et al., Reference Hogan, Beddington, Costantini and Lacy1994). Two or three embryos were aggregated in 0.5% PHA solution (phytohemagglutinin-P; Wako Pure Chemical Industries, Ltd., Osaka, Japan). The embryos were washed and cultured in M16 medium (Sigma) in a humidified atmosphere of 5% CO2 in air at 37°C. After 24 h, embryos were transferred to a RPMI-based culture medium (20% fetal bovine serum (FBS), 0.1 mM 2-mercaptoethanol, 2 mM l-glutamate, 1 mM sodium pyruvate, 50 U penicillin, 50 mg/ml streptomycin in RPMI 1640 (Sigma; Hogan et al., Reference Hogan, Beddington, Costantini and Lacy1994)) on a gelatin-coated tissue culture dish. Gelatin-coated dishes were prepared by distributed a thin layer of 0.2% gelatin solution to cover the bottom of the plate and incubated for 1 h at room temperature. After the gelatin solution was removed, the dish was kept at room temperature for at least 1 h before use.
Production and culture of half embryos
Two-cell-stage embryos were collected at 1.5 d.p.c. by flushing the oviducts in M2 medium (Sigma). The zona pellucida was removed by acidic tyrode solution. The embryos were washed and cultured in M16 medium (Sigma) in a humidified atmosphere of 5% CO2 in air at 37°C (Hogan et al., Reference Hogan, Beddington, Costantini and Lacy1994). Two-cell-stage embryos were separated by pipetting in 0.1% polyvinyl pyrrolidone (PVP), 2% ethylenediaminetetraacetic acid (EDTA), and 2% trypsin in phosphate-buffered saline (PBS). The embryos were washed and cultured in M16 medium (Sigma) in a humidified atmosphere of 5% CO2 in air at 37°C. After 24 h of separation, embryos were transferred to a RPMI-based culture medium on a gelatin-coated dish. Control blastocyst-like embryos were made by aggregation of two separated blastomeres.
Immunohistochemistry
To analyse the localization and expression of Cdx2 and Oct4 in the embryos, polyclonal antibodies to Cdx2 (AM392–5M; BioGenex Laboratories, Inc., Fremont, CA, USA) and Oct4 (sc-5279; Santa Cruz Biotechnology Inc., Santa Cruz, CA, USA) were used. The embryos were washed in PBS with 0.1% PVP and fixed in PBS with 0.1% PVP and 3.5% paraformaldehyde for 40 min. After washing in PBS with 0.1% PVP, they were treated in PBS with 0.1% PVP and 1% Triton-X for 30 min. After washing in PBS with 0.1% PVP and 1% bovine serum albumin (BSA), they were pre-incubated with 10% rabbit serum (R0511; Vector Laboratories Inc., Burlingame, CA, USA) for 45 min at room temperature (RT), followed by overnight with the primary antibody at 4°C, then with FITC-labeled secondary antibody at RT (1:200; Vector Laboratories Inc.) for 45 min. As a negative control, sections were processed without the primary antibody (data not shown).
Morphological analysis
In morphological analysis, after staining with Hoechst 33342 (B2261; Sigma), the embryos were sandwiched between slide glasses and dishes, embedded with white petrolatum and paraffin, and then sealed with EUKITT (O. Kinder, Germany). The embedded embryos were observed under a differential interference microscope (Diaphoto 200, Nikon, Japan), and the number of nuclei and expanding dimensions of embryonic cells were analysed by Image J (National Institutes of Health, USA) (Figs. S1, S2 and S3).
Statistical analysis
To detect significant statistical differences, Mann–Whitney tests were used to compare the experimental groups. Differences were considered significant at P < 0.05 (StatView software, SAS Institute, Cary, NC, USA).
Results
Growth of aggregation embryos
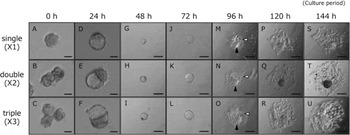
To assess differences in development, the morphology of aggregated embryos was observed. Two or three 8-cell-stage embryos were aggregated at 2.5 d.p.c. (Figs. 1 and 2 A–C) and continued to culture to the blastocyst stage for 72 h (Figs. 1 and 2 B). The aggregation embryos, double and triple embryos, developed normally to larger blastocyst-like embryos before being transferred to a RPMI-based culture medium (Fig. 2 D–F). After the 96 h culture period, aggregated embryos attached and the trophoblast-like cells migrated to the gelatin-coated dish (Fig. 2 M–O). These embryos continued to develop and to sustain their structure until 144 h of culture. (Fig. 2 S–U). There seemed to be no morphological increases in cell death in both double and triple embryos at any stage of development. The newborn mice were indistinguishable from normal newborns after the aggregate embryos were transferred to pseudopregnant recipients (data not shown).
Production of aggregated embryos. Diagram of production of larger blastocyst-like embryos with excess numbers of cells. Two or three embryos were aggregated during the 8-cell stage.

Growth and differentiation of aggregated embryos in vitro culture system. (A–C) Double (×2) and triple (×3) aggregations were completed at 2.5 d.p.c., the same as single (×1) embryos. (D–F) Both control and aggregated embryos developed into blastocyst-like embryos at the 24 h culture period. (D–U) Embryos attached and the trophoblast cells migrated to the surface of the gelatin-coated culture dish after they were transferred to an RPMI-based culture medium at the 24 h culture period. Attachment and outgrowth of the embryos were observed until the 144 h culture period. Scale bars, 50 μm (A–F) and 2 μm (G–U). The white arrowheads indicate giant trophoblast cells, and the solid arrowheads indicate cylindrical structures.
Differentiation of aggregation embryos
To characterize the attached embryos in an in vitro culture system, we performed indirect immunofluorescence for Cdx2 and Oct-4 in the 96 h culture embryos from wild-type mice. Larger cells appeared at the outer circular layer of the embryo (Fig. 3 B,F). Cdx2 was expressed mainly in migrated trophoblast-like cells and some outer-region cells (Fig. 3 C,D). Oct-4 was expressed only in core-region cells (Fig. 3 G,H).
(A–G) Localization of Cdx2 and Oct4 immunofluorescence in embryos cultured for 96 h in an in vitro culture system. Representative images from wild-type embryos are shown. Nuclei were stained with Hoechst 33342 (B, F). Cdx2 was expressed mainly in migrated trophoblast cells (white arrowhead) and some outer-region cells (solid arrowhead) (C). Oct4 was expressed only in the core region of cells (G, white arrow). Scale bars, 50 μm.

Cell number and growth ratio of aggregation embryos
To investigate whether or not the aggregated embryos have an intrinsic ability to regulate their own growth, we investigated the whole cell numbers and growth ratios of the aggregated embryos as growth indices compared with those of the single embryos after attachment to the gelatin-coated dish. We calculated the relative growth ratios of cell numbers at each period in aggregated embryos, double (×2) and triple (×3), and in single embryos (×1) based on cell number at the 72 h culture period. The total numbers of both the double- and triple-aggregated embryos were significantly larger, around two-fold and three-fold, respectively, than that of single embryos (Table 1 and Fig. S2). To analyze the growth ratio of the double and triple embryos, we assessed cell number ratios based on the 72 h culture period embryo. Throughout the culture period, there were no significant differences in the growth ratios of cell numbers between the single and aggregated embryos (Fig. 4). The dimensions of
Number of cells in aggregated and non-aggregated embryos

aP< 0.05; bP< 0.01; cP< 0.001; n = 3–4.
Relative growth ratios of cell numbers at each period in aggregated embryos, double (×2) and triple (×3), and in single embryos (×1) based on the cell number at 72 h culture period. Throughout the culture period, there were no differences in the rate of increase between the aggregates and the control. All data are presented as means ± standard error of the mean (SEM).

the broadening of each embryo on a culture dish were also measured at 96 h, 120 h, and 144 h culture period, and the results indicated that both aggregated embryos spread through a much larger area during all periods compared with the single embryos (Table S1).
Growth of half embryos
To assess differences in development, the morphology of half embryos was observed. For this end, 2-cell-stage embryos were separated and cultured to blastocyst stage (Fig. 5 A). The separated half embryos developed normally to the blastocyst stage, the same as the control embryos, at the 48 h culture period (Fig. 6 F). After 120 h, the half embryos attached and the trophoblast cells migrated to the gelatin-coated dish after they were transferred to a RPMI-based culture medium (Fig. 6 K,L). The half embryos continued to develop and sustain their structure up to the 168 h culture period (Fig. 6 K–P). The half embryos were transferred to the uterus in a manner similar to the transfer of aggregated embryos. The newborns were indistinguishable from those of normal newborns (data not shown).
Production of half embryos. Diagram of production of smaller blastocyst-like embryos with deficient numbers of cells. Blastomeres were separated at the 2-cell stage.

Growth and differentiation of half embryos in vitro culture system. (A, B) The two cells were separated at 1.5 d.p.c. to produce control (×2/2) and half (×1/2) embryos without the zona pellucida. (E, F) Both control and half embryos developed into blastocyst-like embryos at 48 h culture period. (K–P) After being transferred to an RPMI-based culture medium at the 48 h culture period, the embryos attached and the trophoblast-like cells migrated to the surface of the gelatin-coated culture dish at the 120 h culture period. Attachment and outgrowth of the blastocyst-like embryos were observed until the 168 h culture period. Scale bars, 50 μm (A–F) and 2 μm (G–P).

Cell number and growth ratio of half embryos
To investigate whether or not the half embryo has an intrinsic ability to regulate its own development and growth, we investigated the whole cell number, growth ratio, and area of half embryos as growth indices compared with control embryos after attachment to the gelatin-coated dish. The total cell numbers of half embryos were significantly lower at the 96 h and 120 h culture periods, but there were no significant differences between the half embryos and control embryos at the 144 and 168 h culture periods (Table 2 and Fig. S3). To analyse the growth ratios of the half embryos, the cell number ratios based on 96 h culture period were examined. The relative ratio of cell numbers of half embryos was significantly lower at 120 h, but then increased prominently, exceeding that of the control embryos at 168 h (Fig. 7). The dimensions of each embryo broadening on the culture dish were also measured at 120, 144, and 168 h, and the results indicated that the half embryos spread through a much larger area after culture for 168 h (Table S2).
Number of cells in half and control embryos
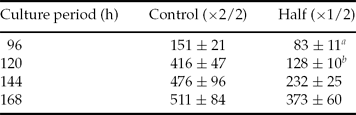
aP< 0.05; bP< 0.01; n = 3–4.
Relative growth ratios of cell numbers at each period of the half embryos (×1/2) and control embryos (×2/2) based on the cell number at the 96 h culture period. The relative ratio of half embryos was significantly lower at the 96 h culture period, but increased prominently towards the 168 h culture period. All data are presented as means ± standard error of the mean (SEM). *Statistically significant difference at P< 0.05.

Discussion
In the present study, we studied the cell numbers of modified mouse embryos and demonstrated that mouse embryos may change their growth rate in early development to compensate for the lack of uterus factors.
Previous studies have estimated cell numbers of total embryos by calculating the number of nuclei in a small area of tissue and multiplying that number by the total tissue area per post-implantation embryo (Lewis & Rossant, Reference Lewis and Rossant1982; Rands, Reference Rands1986a,Reference Randsb; Power & Tam, Reference Power and Tam1993). We used an original method to directly count cells by crushing embryos gently on slide glasses. We consider the method we used here to be reliable because our results for the cell numbers of control embryos were similar to those of previous reports (Lewis & Rossant, Reference Lewis and Rossant1982; Power & Tam, Reference Power and Tam1993).
We cultured blastocyst-like embryos on gelatin-coated dishes with an RPMI-based culture medium, which enabled us to mimic the intrauterine environment around implantation in utero. Cdx2 is expressed in trophectoderm (TE) and Oct4 in ICM at 3.5 d.p.c., but at 4.5 d.p.c. their expression levels were decreased and limited to a few cells after implantation (Beck et al., Reference Beck, Erler, Russell and James1995; Pesce & Scholer, Reference Pesce and Scholer2001). Cdx2 is expressed in the extra-embryonic ectoderm derived form TE but not in the trophoblast giant cells at 6.5 d.p.c (Beck et al., Reference Beck, Erler, Russell and James1995). Oct4 expression is maintained in the embryonic ectoderm at the egg-cylinder stage. The only cells maintaining Oct4 expression after this stage are primordial germ cells (PGCs) arising within the extra-embryonic mesoderm at 7.2 days of mouse embryo development (Pesce & Scholer, Reference Pesce and Scholer2001). Our experiments indicated that both Cdx2 and Oct4 are expressed in attached embryos from wild-type mice at the 96 h culture period (Fig. 3 C,D), but Cdx2 was expressed only in ectoderm-like cells and Oct4 was not expressed in any cells after this stage (data not shown).
As the expression patterns of Cdx2 and Oct4 in the embryo were maintained and the embryo still had the original characteristics of blastocysts, the embryos at the 96 h culture period in vitro culture system might be similar to embryos just after implantation in vivo. In the uterus, the control embryo has already attached to the surface of uterine epithelial cells and started to differentiate into germ layers such as ectoderm at 6.5 d.p.c., but embryos ex uterus showed delayed developmental growth due to artificial manipulation and/or transfer to pseudopregnant recipients at the same time as the control embryos, at the 96 h culture period. Embryonic degradation of Cdx2 and Oct4 at 96 h may imply that the embryo ex uterus may sustain normal differentiation ability in an in vitro culture system. At 96 h, the decreased expression levels of Cdx2 and Oct4 and morphological changes of outer cells into trophoblast-like larger cells also suggested the possibility of embryo differentiation in an in vitro culture system.
The cell numbers and areas of both aggregated embryos (×2 and ×3) were larger than those of control embryos (×1) during all culture periods, and the relative growth ratio of cell numbers did not show any growth inhibition in the aggregated embryos. Lewis & Rossant showed that double embryos had twice as many cells as control embryos around 4.5 d.p.c., but no significant differences were found between double and control embryos until 6.5 d.p.c. in vivo (Lewis & Rossant, Reference Lewis and Rossant1982). This result indicated that size regulation has occurred in the aggregated embryos by 6.5 d.p.c. in vivo. The difference of the growth timing of these embryos between our result and Lewis's is attributable absolutely to the environmental difference between in utero and in vitro culture systems. The reasons why the aggregated embryos had unchanged growth rates in an in vitro culture system are not clear, but it is possible that downward regulation may cause limitations of maternal factors, such as nutrition in utero, and uterine space; on the other hand, stable development was accomplished with ample growth factors from culture medium and open space in aggregated embryos in the in vitro culture system. The dimension analysis suggested that the aggregated embryos grew continuously, which indicated that the total area of cells derived from the aggregated embryos and the growth rate of the dimensions of the aggregated embryos were greater than those of control embryos from the 96 h to the 144 h culture period (Table S1). This dimensional growth indicated that the aggregated embryos originally may have proliferative activity in the natural environment.
It may seem strange that a single blastomere from a 2-cell embryo can give rise to normal post-implantation conceptuses and liveborn offspring after transfer to pseudopregnant recipients (Tarkowski, Reference Tarkowski1959; Hoppe & Whitten, Reference Hoppe and Whitten1972; Tsunoda & McLaren, Reference Tsunoda and McLaren1983; and our unpublished data). Half embryos had fewer cells than control embryos after the 96 and 120 h culture periods, but the two had almost equal cell numbers after 144 h in our experiment using an in vitro culture system. The growth ratio of the half embryos gradually increased, even until the end of the culture period, but that of the control embryos diminished after attachment to the dish. Our results verified the results of ‘catch up’ growth reported by Rands (Reference Rands1986b), in which mouse embryos derived from one blastomere at the 2-cell stage, when compared with control embryos of exactly parallel derivation, reach the same size between 7.5 and 10.5 d.p.c. Our results also verified those reported by Snow that half embryos showed rapid cellular proliferation between 5.5 and 6.5 d.p.c. in vivo (Snow, Reference Snow1981).
It might seem strange that the number of cells of control embryos differ between half and aggregated embryos at the same period (Tables 1 and 2), but it is possible that the preparation method of each control embryo may be different respectively.
It has been unclear whether the regulation of an artificially aggregated or half embryo is activated by the embryo itself or by the uterine environment. The half embryos seemed to recognize their own target size in some way, and to change their growth rate to compensate for their size deficiencies, and never stopped their growth by the end of our experiment, although our protocol is not completely relevant to the in vivo situation. In other words, in mice downward regulation is ‘passive’ and is vulnerable to environmental insults; on the other hand, upward regulation could be ‘positive’, and induced by inner recognition of the embryo's own size in the early embryonic development. Although they caught up to a great extent, the half embryos did not exceed control embryos in total dimensions in the in vitro culture system (Table S2).
Size regulation occurred in aggregated embryos shortly after implantation, around the time of proamniotic cavity formation in vivo (Buehr & McLaren, Reference Buehr and McLaren1974). The timing of downward regulation might indicate that size regulation of aggregated embryos was strongly affected by maternal factors and by the impact of implantation. Our preliminary data showed that the order of the cell cycle might be disturbed in the aggregated mouse embryos. In fact, double embryos show longer cell cycles compared with controls (Lewis & Rossant, Reference Lewis and Rossant1982). It is still a mystery how embryos recognize their own size and how they maintain cell-number homeostasis. Molecular analysis, such as the relationship between the size and the cell cycle, is necessary.
In embryos cultured in an in vitro culture system, morphogenesis seems not to be affected by artificially increasing or decreasing the total cell numbers of early embryos by the appearance of embryonic differentiation. In vivo, quadruple-aggregated embryos are not developmentally advanced when compared with control embryos of the same age (Rands, Reference Rands1986a), and half embryos exhibit slight developmental retardation compared with controls of the same age (Snow, Reference Snow1981; Rands, Reference Rands1986b). Regulation for excess or low cell numbers may be independent of morphological alteration in early development.
Our data suggested that the growth of the aggregated embryos continued in the in vitro culture system, indicating that the embryos can grow continuously; and that the growth of half embryos accelerated in vitro culture system, indicating that the mouse embryo might have some ways by which to regulate its size in early development.
Acknowledgements
This study was supported in part by Grants-in-Aid for Scientific Research (C) (21580344) from JSPS to KK, by Grants-in-aid for Scientific Research (B) (22380147) from JSPS to KN and by Grants-in-Aid for from the Foundation for Growth Science for KK.



