

INTRODUCTION
Interaction of femtosecond laser pulses with solids has recently attracted much attention in the fields of laser micromachining and surface micro-structuring (Gattass & Mazur, Reference Gattass and Mazur2008; McDonald et al., Reference McDonald, Mistry, Ray and Yalisove2006; Reinhardt et al. Reference Reinhardt, Passinger, Zorba, Chichkov and Fotakis2007; Li et al., Reference Li, Feng, Jia, He, Xiong, Hou, Zhou, Sun and Xu2010; Amoruso et al., Reference Amoruso, Ausanio, Bruzzese, Vitiello and Wang2005). On the femtosecond time scale, energy is deposited into a material so fast that it cannot effectively relax by thermal diffusion. As a result, matter is pushed into a state of extreme non-equilibrium and large amounts of material are ejected from the target, i.e., ablation occurs. Ultrafast laser ablation is often accompanied by a series of phenomena including plasma generation (Stoian et al., Reference Stoian, Rosenfeld, Ashkenasi, Hertel, Bulgakova and Campbell2002), ultrafast phase transformation (Von der Linde et al., Reference Von der Linde, Sokolowski-Tinten and Bialkowski1997; Lorazo et al., Reference Lorazo, Lewis and Meunier2003; Dumitrica & Allen, Reference Dumitrica and Allen2002), fast material removal (Amoruso et al., Reference Amoruso, Bruzzese, Pagano and Wang2007), and the formation of surface microstructures (Her et al., Reference Her, Finlay, Wu, Deliwala and Mazur1998; Bonse et al., Reference Bonse, Baudach, Krüger, Kautek and Lenzner2002; Chichkov et al., Reference Chichkov, Momma, Nolte, Von Alvensleben and Tünnermann1996; Huang et al., Reference Huang, Zhao, Cheng, Xu and Xu2009). The ablation process strongly depends on laser fluence, pulse duration, ambient gas pressure and composition. Different surface structures and properties have been noticed on silicon after femtosecond laser ablation in various ambient gases (Younkin et al., Reference Younkin, Carey, Mazur, Levinson and Friend2003).
The process of ultrafast laser ablation has been studied extensively by means of ultrafast time-resolved measurement techniques (Sokolowski et al., Reference Sokolowski-Tinten, Bialkowski, Cavalleri, Von der Linde, Oparin, Meyer-ter-Vehn and Anisimov1998; Amoruso et al., Reference Amoruso, Bruzzese, Wang and Xia2008; Zhang et al., Reference Zhang, Zhu, Yang, Wang and Wang2007), optical emission spectroscopy (Liu et al., Reference Liu, Zhu, Liu and Zhao2008; Ying et al., Reference Ying, Xia, Sun, Zhao, Ma, Liu, Li and Hou2003), molecular dynamics (Lorazo et al., Reference Lorazo, Lewis and Meunier2003; Perez & Lewis, Reference Perez and Lewis2002), hydrodynamic modeling (Colombier et al., Reference Colombier, Combis, Audouard and Stoian2012), Doppler X-ray spectroscopy (Rosmej et al., Reference Rosmej, Renner, Krousky, Wieser, Schollmeier, Krasa, Laska, Kralikova, Skala, Bodnar, Rosmej and Hoffmann2002), etc. In spite of the extensive literature on this subject (Beilis, Reference Beilis2012), the mechanism of femtosecond laser ablation is still not fully understood because of its complexity.
In this paper, we study optical emission spectra of plasma plume induced by femtosecond laser pulses on silicon surfaces in air, N2, SF6, and vacuum, aiming to learn more about the mechanism of plasma generation and evolution at an early stage of the ablation process. Furthermore, the mechanism behind the formation of different microstructures in various ambient gases is investigated. By steady-state spectroscopy, we determine the plasma composition and investigate the relationship between laser fluence and intensity of the emission spectra. Ultrafast dynamic processes in laser-induced plasma are studied by time-resolved spectroscopy. The decay curve of the optical emission turns out to be bi-exponential indicating the presence of a fast and a slow process. The decay process depends on laser fluence and is affected by the confinement effect caused by ambient gases.
EXPERIMENTS
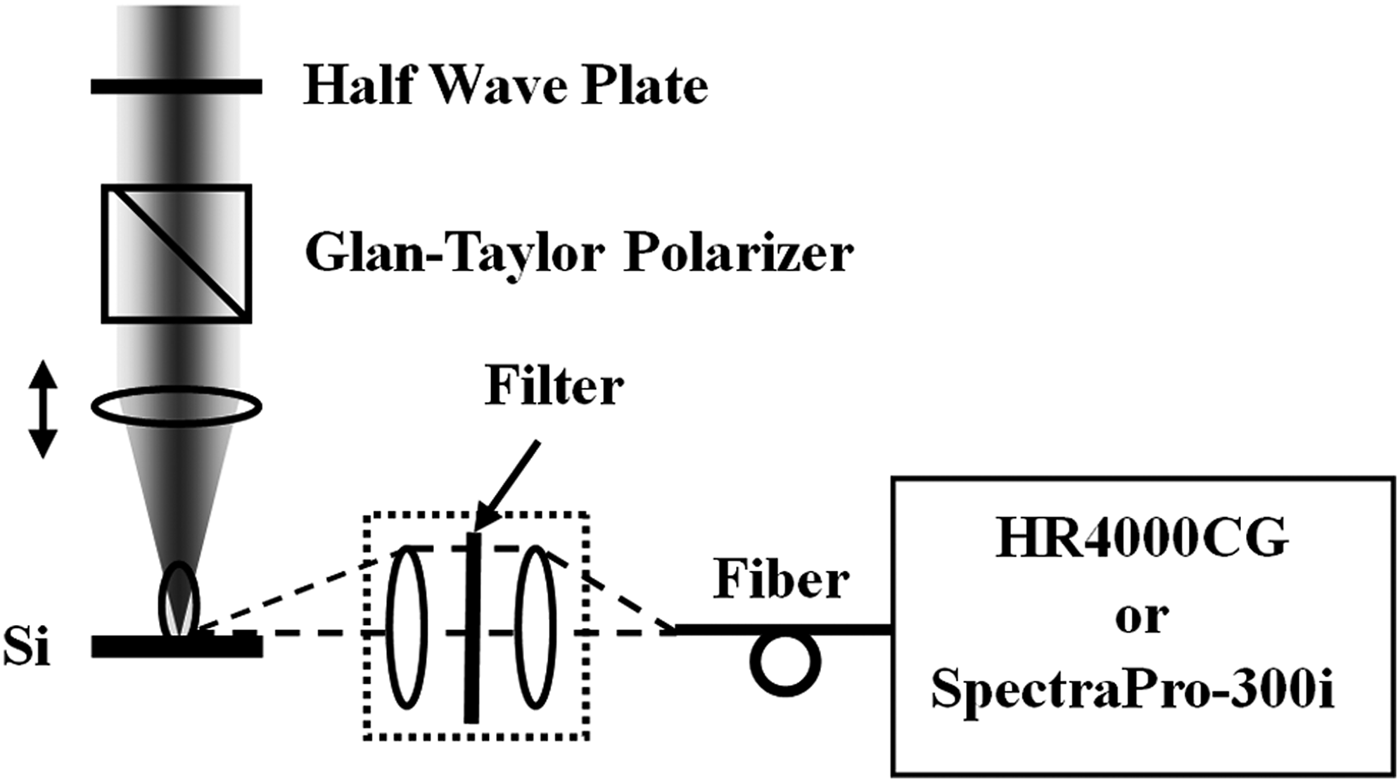
The experiments are carried out with a Ti:sapphire regenerative amplifier, which delivers 120-fs pulses with a repetition rate of 1 kHz at a central wavelength of 800 nm. The laser pulses pass through a half-wave plate and a Glan-Taylor polarizer, so that the laser energy can be adjusted (0–300 µJ per pulse). The pulses are focused with a 0.5-m focal-length lens and hit perpendicularly onto an n-type silicon (111) wafer with a resistivity of more than 1000 Ωcm. The silicon wafers were cleaned with hydrofluoric acid to remove any native oxide, and then rinsed with distilled water. The cleaned wafer is mounted on a three-axis translation stage in a vacuum chamber with a base pressure less than 1 Pa. The chamber can be filled with different ambient gases. We perform the experiments in 100-kPa air, 70-kPa N2, 70-kPa SF6, and in vacuum (<1 Pa).
During femtosecond laser ablation, the wafer is moved at a speed of 1 mm/s. In order to achieve a uniform area, adjacent treatment lines have a distance of 100 µm and thus overlap such that each point on the surface is exposed to an average of 200 pulses. The emission light from the plasma plume is collected by a collection system that contains a set of filters to block light between 750 nm and 850 nm. The detected spot with a diameter of about 200 µm, which is fixed in our experiments, is located on the silicon surface. The collected signal is focused onto an optical fiber, whose output is fed to a high-resolution spectrometer (HR4000CG, Ocean Optics) or a spectrograph (SpectraPro-300i, Acton Research Corporation) coupled to an ICCD camera (PicoStar HR 12, LaVision). The ICCD is synchronized with the femtosecond laser system, and a programmable timing generator is used to control the delay between the laser pulse and the gate signal of the ICCD. The precision of synchronization between laser system and ICCD is better than 10 ps and the minimum width of the gate signal of the ICCD is 30 ps. The spectrum of the emission light of plasma plume is measured by ICCD at different delay time. The experimental setup is shown in Figure 1.
Schematic of the experimental setup.

RESULTS AND DISCUSSION
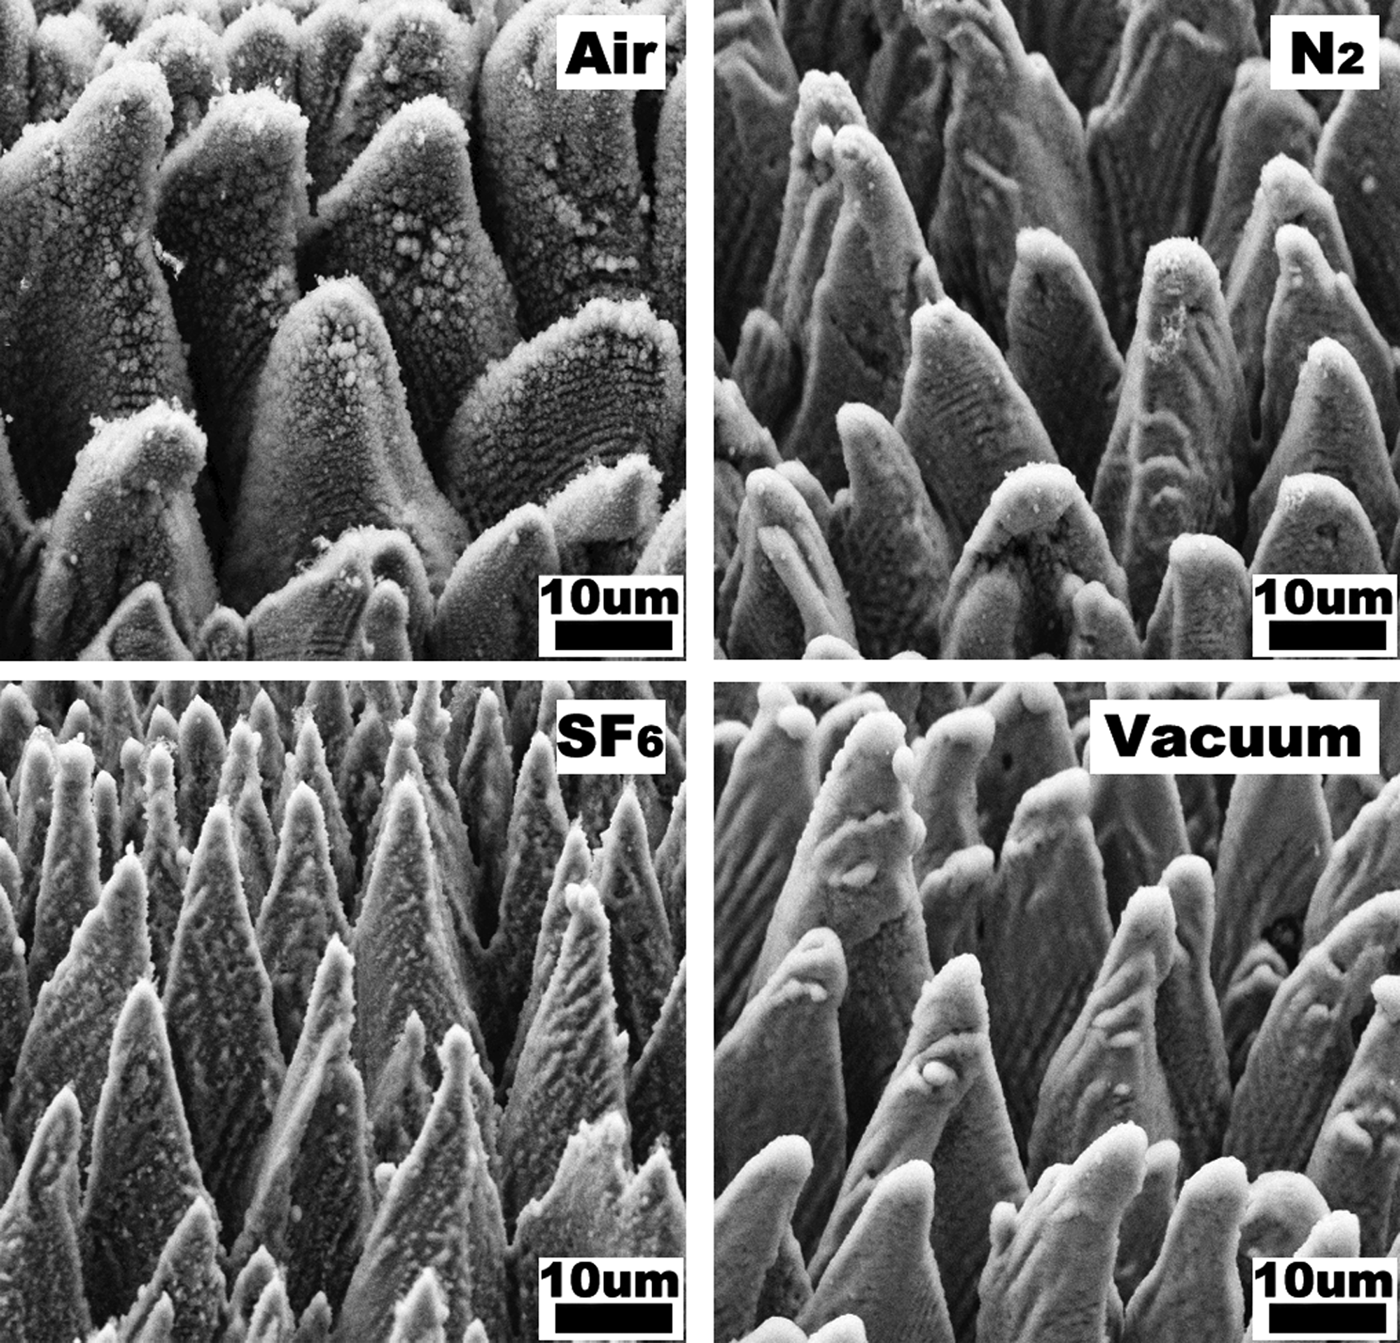
During femtosecond laser ablation, a large amount of material is ejected from the silicon surface and bright light is emitted from the plume that contains ions, atoms, clusters, and nanoparticles (Amoruso et al., Reference Amoruso, Bruzzese, Spinelli, Velotta, Vitiello, Wang, Ausanio, Iannotti and Lanotte2004a). After ablation, microstructures are found on the silicon surface. Figure 2 compares SEM (scanning electron microscopy) images of micro-structured silicon resulting from pulses with a fluence of 10 kJ/m2 in air, N2, SF6, and vacuum, respectively. Arrays of spikes have formed on the silicon surface that differs for various ambient gases. It suggests that the ablation processes are different. To identify them, we measure steady-state and time-resolved spectra of the plasma plume by using a high-resolution spectrometer (HR4000CG, Ocean Optics) coupled to an ICCD camera, respectively.
SEM images of micro-structured silicon produced by a femtosecond laser with a fluence of 10 kJ/m2 in 100-kPa air, 70-kPa N2, 70-kPa SF6, and in vacuum (<1 Pa).
Figure 3 shows steady-state emission spectra. Beneath some spectral lines of atoms and ions there is a continuous spectrum which is due to bremsstrahlung and recombination radiation. In all four ambient gases, no spectral line of silicon ions is observed at a laser fluence of 3.5 kJ/m2. The silicon ion lines come out when the laser fluence becomes larger than 10 kJ/m2. It indicates a kind of ion formation threshold at about 10 kJ/m2. Above this threshold, a large amount of silicon ions are ejected, leading to plasma generation. The silicon spectral lines indicate that the plasma plume mainly contains silicon atoms (Si I) and monovalent ions (Si II). Furthermore, signals of N and O are observed for air, N for nitrogen and S and F for SF6 atmosphere in Figure 3. Their presence suggests that ambient gas molecules are dissociated during laser ablation. Since the laser intensities applied here are not high enough to directly ionize the ambient gas by multi-photon absorption, the dissociation of the ambient gas molecules is caused by drastic collisions between the expanded plasma and the ambient gas. The 441.5 nm S II line occurs already at a laser fluence of 3.5 kJ/m2 in SF6, which confirms that SF6 molecules dissociate more easily than other ambient gas molecules. This may be explained by the larger collision cross-section of SF6 molecules.
(Color online) Emission spectra of a plasma induced by femtosecond laser pulses with different fluences on a silicon surface in (a) 100-kPa air, (b) 70-kPa N2, (c) 70-kPa SF6, and in (d) vacuum (<1 Pa).
As seen in Figure 3, the spectral lines are more remarkably broadened in air, N2, and SF6, due to the Stark broadening in plasma plume. It is also observed that the intensity of the spectral lines increases with laser fluence. To determine the fluence dependence, the 413.1 nm Si II line is corrected by subtracting the baseline and its integral intensity is plotted as the function of laser fluence, as shown in Figure 4. Regardless of the ambient gas, the intensity of this line is almost zero at 3.5 kJ/m2 that is below the ion generation threshold, and it increases approximately linearly with laser fluence above 10 kJ/m2. However, the slopes differ for the ambient gases. This can be explained by the confinement of the plasma plume (Amoruso et al., Reference Amoruso, Toftmann, Schou, Velotta and Wang2004b), which is due to the high pressure of the ambient gas. In ambient gas with high pressure, the plasma plume is decelerated very rapidly during the early stage of plasma expansion and is confined above the silicon surface (Harilal et al., Reference Harilal, Bindhu, Tillack, Najmabadi and Gaeris2003; Wu et al., Reference Wu, Zhang, Wang and Zhu2011). In a confined plasma plume, the slow expansion and the impact excitation are more efficient and thus enhance optical emission from silicon ions in the detected area. So the slopes in N2 and air are steeper than in vacuum. In SF6, however, the larger collision cross-section of SF6 molecules causes a stronger confinement of the plasma plume, leading to the highest spectral intensity and the steepest slope. We also plotted the integral intensity of the whole spectrum without subtracting the baseline as a function of the laser fluence, as shown in the inset of Figure 4. It exhibits a similar dependence on the laser fluence. This suggests that the total optical emission of plasma plume is affected by the confinement effect in a similar way.
(Color online) The fluence dependence of emission intensity of the 413.1 nm Si II line for different ambient gases. The inset shows the fluence dependence of the integral intensity of the whole spectrum. The straight lines represent linear fits.
In order to understand the ultrafast dynamic process of plasma generation and evolution, we measured time-resolved spectra in various ambient gases and under different laser fluence. The results of SEM and steady-state spectroscopy indicate that the ablation process in SF6 is very different and interesting. In addition, the micro-structured silicon made in SF6 has a surprising optical property and is regarded as a new promising photoelectric material (Carey et al., Reference Carey, Crouch, Shen and Mazur2005; Wu et al., Reference Wu, Crouch, Zhao and Mazur2002). Therefore, we paid more attention to time-resolved spectra measured in SF6. The pseudo-color maps of the time-resolved spectra are obtained by combining the spectrum at different delay time and normalized with respect to the maximum of itself, as shown in Figure 5. The zero time is set at the arrival time of the maximum of the laser pulse.
(Color online) Time-resolved spectra of the plasma on the silicon surface measured in SF6 under different laser fluences: (a) 3.5 kJ/m2, (b) 10 kJ/m2, (c) 20 kJ/m2, and (d) 40 kJ/m2.
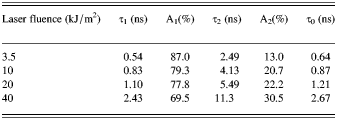
To determine the dynamics of atoms and ions of silicon in the plasma plume, we extract the time evolution data of the 390.5 nm Si I line (silicon atoms) and the 505.6 nm Si II line (monovalent silicon ions) from the time-resolved spectra, as shown in Figure 6. These data are optimally fit by the bi-exponential function I(t) = A 1e −t/τ1 + A 2e −t/τ2, where τ1, τ2, A 1, and A 2 represent the time constants and the proportions of two different exponential decay processes, respectively. Hence there is a fast and a slow decay process, as shown in the inset table of the Figure 6.
(Color online) The decay curves of the 505.6 nm Si II line and of the 390.5 nm Si II line under a laser fluence of 10 kJ/m2 in SF6. The solid curves represent bi-exponential fits.
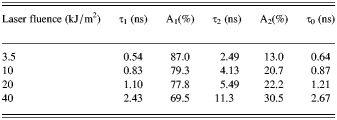
To understand the two different decay processes, we compare the lifetimes of the two decay components of the 505.6 nm Si II line obtained under various laser fluences in SF6. Moreover, the lifetime τ0 of the continuum radiation is obtained by optimally fitting the data of the continuum spectrum at 700 nm with a single exponential function: I(t) = I 0e −t/τ0. Table 1 lists the fitting results of the 505.6 nm Si II line as well as τ0 at different laser fluences in SF6. As seen in Table 1, τ1 is on the same scale with τ0. This indicates that the fast component represents the decay of the bremsstrahlung and the recombination radiation. A1 decreases and A2 increases with laser fluence, which is consistent with the fact that the silicon ion density in the plume increases with laser fluence. Therefore, we conclude that the slow component represents the decay of the excited silicon ions. It is notable that the excited ions decay in several ways: optical emission, recombination, collision, and escape from the detected area (Nedanovska et al., Reference Nedanovska, Nersisyan, Lewis and Riley2012). The spectral lifetime is determined by these factors that can be changed by choosing the experimental settings accordingly.
Lifetimes of the two decay components of the 505.6 nm line and the lifetime of the continuum spectrum at 700 nm in SF6.
In Figure 6, another interesting phenomenon is that the intensity peaks of the 505.6 nm Si II line and the 390.5 nm Si I line appear at 0.2 ns and 0.4 ns, respectively. In fact, this phenomenon also happens in other ambient gases, which indicates that it is a natural characteristic of plasma generation during femtosecond laser ablation of silicon. It means that the plasma is formed within 200 µm above the silicon surface earlier than 200 ps (200 ps is just the upper limit due to the overall temporal resolution of 200 ps) and that the silicon ions are ejected faster from the sample surface than the silicon atoms. The faster silicon ions are possible due to the coulomb repulsion and the local electric field. When a femtosecond laser pulse impacts on the silicon surface, electrons are excited first. Many of them are ejected from the surface (Hebeisen et al., Reference Hebeisen, Sciaini, Harb, Ernstorfer, Kruglik and Miller2008; Wendelen et al., Reference Wendelen, Mueller, Autrique, Rethfeld and Bogaerts2012). As a result, the positive charge density on the silicon surface increases and a local electric field is formed between the surface charges and the ejected electrons.
The ambient gas has little influence on the generation of the silicon plasma, which mainly depends on the femtosecond laser fluence. However, the evolution of the plasma plume is strongly affected by the species and pressure of the ambient gas which can influence the lifetime of the optical emission. By fitting the decay profiles with the bi-exponential function, the lifetimes of two exponential decay components of the 505.6 nm Si II line are obtained for various ambient gases under different laser fluences, as shown in Figure 7. Both, τ1 and τ2 increase with laser fluence in different ambient gases. This can be explained by the fact that the density of plasma increases with laser fluence, which enhances the continuum radiation as well as the radiation from silicon ions. The fluence dependences of τ1 and τ2 are similar in air and N2, while they are weaker in vacuum. In air and N2, the expansion of the plasma plume is inhibited due to the confinement effect, leading to prolonged optical emission compared to that in vacuum. However, at the same pressure, τ1 and τ2 are both larger in SF6 than that in N2. This can be explained by a stronger confinement caused by the larger collision cross-section of SF6 molecules.
(Color online) The dependence of the lifetime of the 505.6 nm Si II line on laser fluence for different ambient gases. (a) lifetime τ1 of the fast process; (b) lifetime τ2 of the slow process.
Because of the confinement effect, removed material can redeposit on the silicon surface more efficiently in air and N2. However, in the very hot confined plasma plume, the active F atoms generated by dissociation of SF6 can react with silicon atoms to form volatile SiF4 in SF6 (Chuang, Reference Chuang1981), which can increase the efficiency of material removal and decrease re-deposition. It leads to the sharp spikes in SF6. It is also noticeable that the spikes formed in air are rougher. This may be due to the formation of oxide layer on silicon surface during the femtosecond laser ablation. It hints that the chemical reaction between the silicon and the ambient gas also affects the appearance of the microstructure. These effects cause different surface conditions after every laser pulse in the various ambient gases. As a result, different microstructures form on the silicon surface by a feedback mechanism after several hundred laser pulses, as shown in Figure 2.
SUMMARY
In summary, we have studied generation and evolution of plasmas produced during femtosecond laser ablation of silicon in air, N2, SF6, and vacuum by steady-state and time-resolved spectroscopy. During femtosecond laser pulse ablation, silicon plasma, whose generation threshold is about 10 kJ/m2, is formed within 200 µm above the surface earlier than 200 ps after femtosecond laser excitation. During plasma plume ejection, silicon ions are faster than silicon atoms. This process takes place in all four ambient gases, which confirms that it is a characteristic of femtosecond laser ablation of silicon.
The ambient gas has little influence on the generation of the silicon plasma. During plasma evolution, however, the ambient gas plays an important role. The molecules of the ambient gas are dissociated due to the collisions during plasma expansion. The collisions cause a confinement effect, which inhibits expansion of the plasma and which becomes stronger with increasing pressure. It increases intensity and lifetime of the optical emission, and enhances the re-deposition of the ejected material. In SF6, a chemical reaction decreases re-deposition and increases the efficiency of material removal. The different processes of the plasma evolution, maybe as well as the chemical reaction between the silicon and the ambient gas, cause different surface conditions after every laser pulse in various ambient gases. Finally, different microstructures form on the silicon surface after several hundred pulses by a feedback mechanism.
Based on a better understanding about the femtosecond laser ablation, a controllable ablation may be achieved, which enables us to obtain specific microstructures with desired properties.
ACKNOWLEDGMENTS
This work has been supported by the National Basic Research Program of China (2012CB934201), the 111 Project (B07013), the National Natural Science Foundation of China (11074129), and the Fundamental Research Funds for the Central Universities.