Introduction
Bicarbonate is the dominant natural ruminal buffer and sodium bicarbonate (BICARB) is the buffer traditionally added to diets in ruminant nutrition to moderate ruminal pH. In the literature, however, there are contradictory responses of variables measured to the addition of buffers, and confusion in the interpretation of results (Russell and Chow, Reference Russell and Chow1993). For instance, the addition of up to 5% bicarbonate in high-concentrate rations improved dry matter intake (DMI) in growing cattle (Nicholson et al., Reference Nicholson, Cunningham and Friend1963; Wise et al., Reference Wise, Blumer, Craig and Barrick1965; Zinn, Reference Zinn1991) but 5% bicarbonate depressed DMI in dairy cows (Emery et al., Reference Emery, Brown and Thomas1964). Ruminal pH has also been ameliorated in some studies (Nicholson et al., Reference Nicholson, Cunningham and Friend1963; Okeke et al., Reference Okeke, Buchanan-Smith and Grovum1983; Zinn, Reference Zinn1991), but no effects have been reported in many others (e.g. Thomas and Hall, Reference Thomas and Hall1984; Leventini et al., Reference Leventini, Hunt, Roffler and Casebolt1990). This fact could be the result of the different variables affected by buffer addition and interactions between them, such as intake level, ruminal fermentation and passage rates, water consumption and blood biochemistry (Erdman, Reference Erdman1988). Therefore, different approaches to avoid confounding factors have been used: fixing the forage-to-concentrate ratio (Okeke et al., Reference Okeke, Buchanan-Smith and Grovum1983; Hart and Polan, Reference Hart and Polan1984); restricting the daily roughage intake (Emery et al., Reference Emery, Brown and Thomas1964) or the total ration daily intake (Nicholson et al., Reference Nicholson, Cunningham and Friend1963; Okeke et al., Reference Okeke, Buchanan-Smith and Grovum1983; Quigley et al., Reference Quigley, Wallis, Dowlen and Heitmann1992); withholding feed on the day before sampling (Thomas and Hall, Reference Thomas and Hall1984); intra-ruminal infusions of BICARB (Rogers and Davis, Reference Rogers and Davis1982b); or even training the calves during the adaptation period to eat meals by removing feed shortly after feeding to facilitate pulse dosing of BICARB (Hart and Polan, Reference Hart and Polan1984). However, there is little information on the effects of buffer addition on intake and ruminal fermentation when animals have ad libitum access to concentrate and roughage in intensive beef production systems. The objective of this experiment was to determine the effects of increasing BICARB level added to high-concentrate diets on feed intake, water consumption and ruminal fermentation on finishing beef heifers fed ad libitum.
Material and methods
Animals, experimental design and housing
Four Holstein heifers (average initial BW of 264 ± 12 kg) fitted with 1-cm i.d. permanent ruminal plastic trocars (Divasa Farmavic S. A., Gurb – Vic, Spain) were used. Heifers were randomly assigned to one of the four experimental diets in a 4 × 4 Latin Square design. The four 3-week periods consisted of 2 weeks of adaptation and 1 week of sampling and data collection. The experiment was conducted from March to June 2002. Animals were individually housed in tiestalls on rubber comfort mats on the Experimental Farm of the Universitat Autònoma de Barcelona. Surgery was performed several months before the beginning of the experiment, following standard surgical procedures and conducted under local anesthesia with full aseptic precautions. The research protocol was approved by the Institutional Animal Care and Use Committee of the Universitat Autònoma de Barcelona.
Feed, water supply and data collection
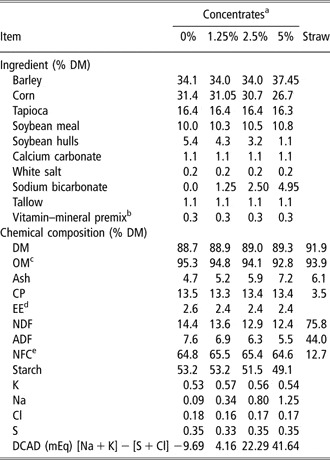
Heifers were offered concentrate and barley straw on an ad libitum basis. The concentrates were formulated according to the National Research Council (1996) for a 325-kg heifer with an average daily gain (ADG) of 1.57 kg/day, and contained 0% (control diet), 1.25%, 2.5% and 5% of added BICARB, on a dry matter (DM) basis (Table 1). Soybean hulls were added to ensure the same level of highly fermentable non-structural carbohydrates and crude protein (CP) among the experimental diets. All ingredients of the concentrate were ground through a 3-mm screen, mixed and pelleted to 5 mm diameter. The particle size of barley straw was determined by dry sieving with the Penn State Particle Separator (Lammers et al., Reference Lammers, Buckmaster and Heinrichs1996). The percentages of DM retained in each sieve were 47.3%, 27.0% and 25.7%, for the 19-mm screen, 8-mm screen and bottom pan, respectively, with a geometric average particle size of 9.58 ± 4.31 mm. Feeders were cleaned and orts collected at 0800 h each morning, and feed offered once daily at 0830 h. Concentrate and straw-mixed orts were weighed before feeding, sub-sampled for later chemical analysis and then both components were manually separated by using a screen to calculate the amount to be offered. Concentrate and straw were offered at 115% of the previous day’s intake. Intake of straw was recalculated through the NDF and ADF content of feed offered and refusals to check the accuracy of the measure and there was excellent agreement. Diet was changed gradually during the first 3 days of each period (33%, 66% and 100% of the new treatment diet for days 1, 2 and 3, respectively). To register water consumption, individual water bowls with direct reading flow meters were used (B98.32.50, Invensys model 510 C; Tashia SL, Artesa de Segre, Spain), which allowed a minimum water measurement of 20 ml. Water was available at all times and consumption was read three times on each day of the sampling period at 0830, 1230 and 2030 h. The water consumption-to-DMI ratio for these intervals was calculated because continuous recording of feed intake was available (González et al., 2008).
Ingredients and chemical composition of concentrates

DM = dry matter; OM = organic matter; EE = ether extract; NFC = non-fiber carbohydrates; DCAD = dietary cation–anion difference.
aTreatments were 0%, 1.25%, 2.5% and 5% of sodium bicarbonate concentration in the concentrate.
bKarimix® Terneros (Laboratorios Karizoo S.A., Barcelona, Spain): vitamin and mineral premix contained per kg DM premix: 3333 kIU vitamin A, 666 kIU vitamin D3, 2166 IU vitamin E, 0.66 g vitamin B1, 0.66 g vitamin B2, 2 mg vitamin B12, 26 g choline chloride, 13.4 g Zn, 3.3 g Fe, 83.3 g S, 166.6 mg Co, 3.3 g Cu, 16.6 g Mn, 16.6 g Mg, 116.6 mg I, 66.6 mg Se, 100 mg ethoxiquine and 100 mg butylhydroxytoluene.
cOrganic matter: calculated as DM minus ash content.
dEE content.
eNFC is calculated as 100 − (CP + ash + NDF + EE).
Sample collection and analyses
BW was recorded before feeding and after withdrawal of refusals on 3 consecutive days at the start and at the conclusion of the experiment. Intermediate weights were taken every 3 weeks.
Concentrate and barley straw refusals for each heifer were removed before feeding, weighed, sub-sampled and analyzed for DM content to record daily feed DMI. DM content of the offered feed and refusals was determined by drying samples for 24 h at 103°C in a forced-air oven according to AOAC (1990); ID 950.01. Feed offered and refusal samples were collected daily for 5 consecutive days from days 15 to 19, composited for each heifer and period, mixed and dried in a forced-air oven at 65°C for 48 h for later chemical analysis. Feeds and refusals were ground in a hammer mill through a 1-mm screen (P. PRAT SA, Sabadell, Spain) and retained for analysis of DM and ash (AOAC, 1990; ID 950.05). Nitrogen content was determined by the Kjeldahl procedure (AOAC, 1990; ID 976.05). Organic matter (OM) was calculated as the difference between DM and ash content. Ether extract was performed according to AOAC (1990); ID 920.39. The NDF and ADF contents were determined sequentially by the procedure of Van Soest et al. (Reference Van Soest, Robertson and Lewis1991) using thermostable α-amylase and sodium sulfite. Starch was analyzed by a modified method of Theander et al. (Reference Theander, Aman, Westerlund, Andersson and Pettersson1995) for non-starch polysaccharides through enzymatic hydrolysis with α-amylase and amyloglucosydase, and later determination of glucose was by spectrophotometry. Sodium (Na) (AOAC, 1990; ID 985.35) and potassium (K) levels were determined by atomic emission spectrophotometry (model 410; Sherwood SCI, Cambridge, UK), previous digestion of the sample was with HCl. Chloride was determined by flow photometry (modelo AA3; Bran Luebbe, Nordestedt, Germany) and sulfur through the BaSO4 gravimetric method. DMI and daily nutrient intake were calculated as the difference between amounts offered and refused based on chemical analysis of the composited sample within heifer and period.
On day 18 of each period, ruminal samples (0.25 l) were taken with an electric vacuum pump connected to a 1-m iron tube that was introduced through the ruminal trocar to reach different locations within the rumen and obtain a representative sample. Times of sampling were as follows: immediately before feeding and at 2, 4, 8, 12, 16 and 24 h after feeding. The ruminal fluid was squeezed through four layers of cheesecloth and pH was measured immediately with a glass electrode pH meter (model 507; Crisson Instruments SA, Barcelona, Spain). Two sub-samples were taken for NH3 N and volatile fatty acids (VFA) analysis as described elsewhere (Rotger et al., Reference Rotger, Ferret, Calsamiglia and Manteca2005). First, a 4-ml sample of filtered fluid was acidified with 4 ml of 0.2 N HCl and frozen at −20°C. Samples were later thawed, centrifuged at 25 000 × g for 20 min and the supernatant analyzed for NH3 N by spectrophotometry (model Libra S21; Biochrom Ltd, Cambridge, UK). Second, 4 ml of filtered ruminal fluid was added to 1 ml of a solution made up of 1% (wt/wt) solution of mercuric chloride, to prevent microbial growth, 2% (vol/vol) orthophosphoric acid and 0.2% (wt/wt) 4-methylvaleric acid as an internal standard in distilled water and frozen at −20°C. Samples for VFA analyses were thawed and centrifuged at 15 000 × g for 20 min, and diluted 1 : 1 in distilled water for subsequent analysis using gas chromatography (model 6890; Hewlett Packard, Palo Alto, CA, USA). A capillary column treated with polyethylene glycol TPA (BP21; SGE Europe Ltd, Buckinghamshire, UK) at 275°C in the injector and a 29.9 ml/min total gas flow rate were used in the chromatograph.
The daily average of ruminal fluid pH, NH3 N and VFA concentrations was calculated with the area under the ruminal data v. time curve and dividing by the total time (Pitt and Pell, Reference Pitt and Pell1997). The area under the pH curve and the number of hours during which ruminal pH remained below 5.8 were calculated assuming that the change in pH between two consecutive measures was linear.
Statistical analyses
The individual animal fed a given treatment diet at each period was considered the experimental unit in all the analyses, which were conducted by mixed-effects regression model analysis of variance (ANOVA) using the MIXED procedure of SAS (v. 8.2; SAS Institute Inc., Cary, NC, USA, 1999). All variables were averaged to generate period means on a daily basis for each heifer and treatment prior to the statistical analysis. Therefore, there was one daily mean value of feed intake, water consumption, ruminal pH and VFA for each experimental unit. The effect of increasing BICARB levels on water consumption and ruminal fermentation at any point in time within the day was also investigated. The average of 5-day water consumption during each interval of time (from 0 to 4, from 4 to 12 and from 12 to 24 h post-feeding) was calculated but it was not the case for ruminal pH (1 sampling day per heifer period). The regression approach is appropriate for assessing relationships among BICARB levels and response. Therefore, the main focus of the present trial was to assess the trends in the response variables as BICARB level increased. The model contained the fixed linear, quadratic and cubic effect of BICARB level (continuous variable), the categorical effect of time of the day as repeated measure subjected to heifer by the period nested within treatment, the interactions between both fixed effects (linear × time, quadratic × time and cubic × time) and period and heifer as random effects. The linear, quadratic and cubic terms tested for the significance of overall or average regression coefficients of the BICARB level regardless of sampling time. The linear quadratic and cubic terms × time interaction tested for the null hypothesis that regression coefficients were equal among all sampling times. Under a significant interaction, the next step was to test the null hypothesis that all regression coefficients were equal among them and equal to zero at all sampling times. Then, linear, quadratic and cubic regression coefficients at each point in time were calculated and tested for their difference from zero using the SOLUTION statement (SAS/STAT, 2004). For those variables expressed on a daily basis, the same model was used but the main effect of time and its interactions were taken out from the model, and, therefore, the main linear, quadratic and cubic effects were considered as fixed effects plus the random effects of heifer and period. The choice of the best covariance structure was based on biological meaning and fit statistics, where the model that minimized either Akaike Information Criteria Corrected or Schwarz’s Bayesian Information Criteria was preferable (Littell et al., Reference Littell, Henry and Ammerman1998). In most of the ruminal variables with repeated measures, Heterogeneous Toeplitz covariance structure provided the best fit because it yielded a cyclic (circadian) correlation matrix where the 0 h sampling time was more correlated to 24 h than to any other sampling time. It also allowed different variances among the repeated measures, and sampling time at unequal intervals. Significance was declared at P < 0.05 and tendencies are discussed at 0.05 < P ⩽ 0.10. Multiple equations of regression were developed using the REG (STEPWISE) procedure of SAS taking all the variables available on the ruminal sampling day. Variables selected were tested for tolerance and collinearity (SAS/STAT, 2004).
Results
Intake and water consumption
ADG during the experiment and final BW of the heifers were 1.1 ± 0.23 kg/day and 361 ± 22.9 kg, respectively. The experiment was not designed to evaluate the treatment effect on animal performance. However, it should be noted that ADG for 0%, 1.25%, 2.5% and 5% treatments were 1.46, 1.44, 0.98 and 0.52 kg/day, respectively.
Intake and water consumption
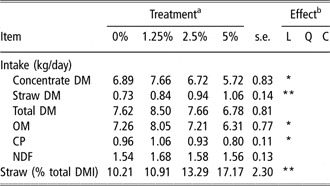
Concentrate DMI decreased linearly (P = 0.03; Table 2) with increasing BICARB level in the diet. In contrast, straw DMI increased linearly (P < 0.01), resulting in a tendency to a linear decrease in the total DMI (P < 0.10) and a linear increase (P < 0.01) in the roughage proportion of the total intake. The intake of OM and CP followed the same pattern as concentrate DMI, both decreasing linearly (P ⩽ 0.05) as the BICARB level increased. Total NDF intake was not affected by treatments, because it was counterbalanced by NDF intakes of both dietary components. However, the proportion of both NDF and ADF of the total intake increased linearly (P < 0.05; data not shown).
Effect of increasing sodium bicarbonate level in high-concentrate diets on intake

DM = dry matter; OM = organic matter; DMI = dry matter intake.
aTreatments were 0%, 1.25%, 2.5% and 5% of sodium bicarbonate concentration in the concentrate.
bEffect of sodium bicarbonate level was significant at **P ⩽ 0.01, or at *P ⩽ 0.05: L = linear, Q = quadratic and C = cubic.
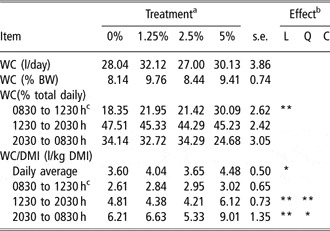
Daily water consumption, in l/day or in percentage of BW, was not affected by treatments (Table 3). However, the water consumption-to-DMI ratio (l/kg DMI) increased linearly (P = 0.03) when the buffer level increased. Moreover, heifers modified their drinking behavior pattern. There was a linear increase (P = 0.01) in the proportion of total daily water drunk in the morning and a tendency (P < 0.10) to decrease the proportion of water drunk at night, when the BICARB level was increased. Nevertheless, linear and quadratic effects of treatment (P < 0.05) on the water consumption-to-DMI ratio were observed during the intervals of time between 1230 to 2030 h and 2030 to 0830 h (Table 3).
Effect of increasing sodium bicarbonate level in high-concentrate diets on water consumption (WC), WC-to-dry matter intake ratio and pattern of daily WC

WC = water consumption; DMI = dry matter intake.
aTreatments were 0%, 1.25%, 2.5% and 5% of sodium bicarbonate concentration in the concentrate.
bEffect of sodium bicarbonate level was significant at **P ⩽ 0.01, or at *P ⩽ 0.05: L = linear, Q = quadratic and C = cubic.
cWC, as percentage of total daily, and the WC-to-DMI ratio during the morning (0830 to 1230 h), afternoon (1230 to 2030 h) and at night (2030 to 0830 h).
Ruminal pH
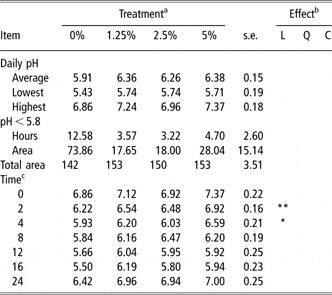
Although the control diet resulted in 0.42 pH units lower daily average ruminal pH compared with the buffer treatments (5.91 v. 6.33, respectively; Table 4), no effect was found (linear P = 0.11). No trends were found in either the lowest (5.65 ± 0.09) or the highest (7.11 ± 0.09) daily pH. The number of hours and area under the curve in which pH remained under 5.8 tended to a quadratic effect (P ⩽ 0.10). Analyzing the pH patterns, the linear BICARB level × time interaction tended to be significant (P = 0.06). Increasing BICARB levels resulted in linear increases of ruminal pH at 2 and 4 h post-feeding (P < 0.05). The linear coefficient of regression indicated that the increase of one percentage unit of BICARB in the concentrate resulted in 0.13 pH units greater ruminal pH at 2 h post-feeding (b = 0.13 ± 0.04; P = 0.004), and 0.12 pH units greater at 4 h post-feeding (b = 0.12 ± 0.06; P = 0.04), and, quadratic (P = 0.06) and cubic (P = 0.09) tendencies were observed at 8 and 16 h post-feeding, respectively. When comparisons were made within treatment, the pH at 0% BICARB level fell (P < 0.05) at 4 h after feeding, whereas in the 1.25% diet no significant decrease was observed at any time during the after-feeding cycle. The average lowest pH was found at 16 h after feeding for the 0% and 2.5%, and at 12 h for the 1.25% and 5% BICARB treatment. In all diets, ruminal pH decreased from 0 to 2 h and then from 2 to 4 h after feeding (P < 0.05). Thereafter, it remained low until 16 h after feeding. Nevertheless, ruminal pH continued to decrease numerically to reach the lowest daily pH at 16 h, and then it increased at 24 h sampling (24 h; P < 0.05).
Effect of increasing sodium bicarbonate level in high-concentrate diets on ruminal pH

aTreatments were 0%, 1.25%, 2.5% and 5% of sodium bicarbonate concentration in the concentrate.
bEffect of sodium bicarbonate level was significant at **P ⩽ 0.01, or at *P ⩽ 0.05: L = linear, Q = quadratic and C = cubic.
cTime after feeding in hours.
Ruminal fermentation
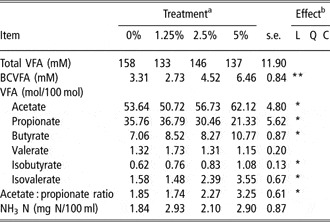
Daily average total VFA concentration (mM) was not affected (P > 0.10) by treatments (Table 5). Daily average acetate molar proportion (mol/100 mol) increased linearly (P = 0.05) with increasing BICARB concentration. Contrarily, the daily average propionate molar proportion decreased linearly (P = 0.02) with BICARB addition. As a result, the daily average ratio of acetate to propionate increased linearly (P = 0.05) as the BICARB level increased. As the buffer level increased, the daily average of n-butyrate increased linearly (P = 0.02). No effects of BICARB addition were observed on the daily average valerate molar proportion. Daily average branched-chain VFA (BCVFA) molar concentration (mM) increased linearly (P = 0.01) with increasing buffer level in the diet. The daily averages of isobutyrate and isovalerate molar proportions also increased linearly (P < 0.05) with BICARB level and were observed to be uniformly affected by treatments throughout the feeding cycle (data not shown). Daily average NH3 N concentration was highly variable and not affected by treatments (Table 5).
Effect of increasing sodium bicarbonate level in high-concentrate diets on rumen volatile fatty acids and ammonia nitrogen concentration (NH3 N)

VFA = volatile fatty acids; BCVFA = branched-chain VFA.
aTreatments were 0%, 1.25%, 2.5% and 5% of sodium bicarbonate concentration in the concentrate.
bEffect of sodium bicarbonate level was significant at **P ⩽ 0.01, or at *P ⩽ 0.05: L = linear, Q = quadratic and C = cubic.
Discussion
Intake and water consumption
Increasing buffer level resulted in a linear decrease of concentrate DMI. However, the 1.25% BICARB diet showed the highest concentrate and the total DMI and the lowest was found with heifers fed the 5% BICARB diet. Hart and Polan (Reference Hart and Polan1984) and Thomas and Hall (Reference Thomas and Hall1984) did not observe differences in DMI with levels of up to 4.5% BICARB in growing calves fed high-concentrate diets. However, they reported an intake pattern very similar to that found in the present trial as the level of buffer increased. However, Jackson et al. (Reference Jackson, Hopkins, Xin and Hemken1992) observed a quadratic trend with the highest intake when 1.88% of BICARB was added to calves’ starter diet. Leventini et al. (Reference Leventini, Hunt, Roffler and Casebolt1990) hypothesized that increases in liquid passage rate caused by BICARB addition lead to an increase in ruminal wash-out of particles with the corresponding increase in feed intake. The reduction in DMI observed at the highest level of BICARB is in agreement with the results of Emery et al. (Reference Emery, Brown and Thomas1964) in dairy cows fed high-concentrate diets but contrary to those of Nicholson et al. (Reference Nicholson, Cunningham and Friend1963) and Wise et al. (Reference Wise, Blumer, Craig and Barrick1965) in growing cattle fed all-concentrate diets. The negative effects of high BICARB levels on intake could be attributed to reduced palatability, increased ruminal osmolality or dietary cation–anion difference (DCAD). Under the present experimental diets, heifers consumed an average of 286, 168 and 96 g/day of BICARB for the 5%, 2.5% and 1.25% BICARB treatments, respectively. When dairy cows were given BICARB at free choice, they did not eat more than 40 g/day, and the authors suggested that it would have adverse organoleptic properties (Keunen et al., Reference Keunen, Plaizier, Kyriazakis, Duffield, Widowski, Lindinger and McBride2003). On the other hand, osmolality of ruminal liquid and plasma is considered a triggering factor in feed intake regulation (Carter and Grovum, Reference Carter and Grovum1990), although the effect of DCAD per se on intake is difficult to isolate from that of osmolality or dietary Na with the literature available because BICARB has been usually used to increase the DCAD (Jackson et al., Reference Jackson, Hopkins, Xin and Hemken1992). Hu and Murphy (Reference Hu and Murphy2004) calculated that DMI peaked at a DCAD of 40 mEq/100 g of DM in a meta-analysis with dairy rations. The animal has to maintain an osmotic pressure balance of body fluids, which may be achieved by increasing the water consumption and the rumen influx of water from plasma, or by decreasing feed intake (Langhans et al., 1995). In the present experiment, we hypothesize that concentrate DMI was decreased by the addition of buffer in an attempt to avoid ruminal osmolality increases. Thus, heifers consumed more straw DMI in an attempt to maximize feed intake. Cooper et al. (Reference Cooper, Kyriazakis and Oldham1996) proposed that diet selection in ruminants is an attempt to promote high levels of feed intake while maintaining ruminal conditions within certain physiological limits. Those authors offered free choice of pelleted barley-based concentrates containing BICARB at 0%, 1%, 2% and 4% to sheep together with one of the two forage sources, long-chopped or pelleted alfalfa. Total feed consumed was not affected and diet selection was not dependent on the concentration of BICARB in the pellets. However, the proportion of long-chopped alfalfa selected by sheep increased from 15.6% to 28.8% of the total intake, and the selection of pelleted alfalfa increased from 34% to 51%, when the proportion of BICARB in the concentrate increased from 0% to 4%, respectively. In addition, when Cooper et al. (Reference Cooper, Kyriazakis and Oldham1996) offered free choice of the 0% paired with the 4% BICARB, sheep selected against the latter. We speculate that animals under high-BICARB diets of our study had a lower physiological limit in the level of feed intake, likely set by BICARB in order to avoid increases in ruminal osmolality.
The BICARB level had no effect on water consumption though the reason is unclear. Warner and Stacy (Reference Warner and Stacy1968) observed an increase in rumen volume and in outflow and dilution rates during and shortly after eating and drinking in sheep, and concluded that there is a physiological limit on those variables beyond a certain point. However, these limiting variables were not identified. Daily water consumption was positively correlated (P ⩽ 0.01; data not shown) with concentrate, total DM, NDF and ADF intakes, and with BW but not with straw DMI or BICARB level. This shows the close and positive relationship between DMI and water consumption. Surprisingly, water consumption was not correlated with buffer level. Water consumption decreases by 4.4 l/day for each one-percentage unit increase of dietary salt in feedlot cattle (NRC, 1996), and increases by 0.05 kg water per each g Na ingested in dairy cattle (Murphy, Reference Murphy1992). Hoffman and Self (Reference Hoffman and Self1972) observed values similar to the present study for the water consumption of feedlot cattle. In agreement with our results, Rogers et al. (Reference Rogers, Davis and Clark1982) found no effect of BICARB in high-concentrate diets on daily water consumption. Water consumption increased linearly in the morning but decreased at night as the BICARB level increased, whether expressed as the percentage of daily water consumption or as the total amount (l). When water consumption was expressed as l/kg DMI, a linear increase with the buffer level was observed. Wheeler et al. (Reference Wheeler, Wangsness, Muller and Griel1980) also observed an increase in the water consumption-to-DMI ratio when adding 5% BICARB, without affecting the total water consumption. Because the water consumption-to-DMI ratio is a response to the need to maintain body water and electrolyte balances, under high mineral addition an increase of osmolality was prevented by decreasing electrolyte intake, rather than by increasing water consumption (Carter and Grovum, Reference Carter and Grovum1990; Langhans et al., 1995). Treatment effects on this ratio were observed during the afternoon (1230 to 2030 h) and at night (2030 to 0830 h), and were explained by a linear decrease in DMI during the afternoon period (P < 0.10) and a quadratic decrease at night (P < 0.05; data not shown). This ratio was lowest between 0830 and 1230 h (2.85 ± 0.32 l/kgDMI), in the medium range from 1230 to 2030 h (4.88 ± 0.36) and highest from 2030 to 0830 h (6.80 ± 0.67). Ruminal osmolality kinetics follows a pattern related to the contribution of dietary minerals (rapidly dissolved) and the accumulation of fermentation products, which depend on diet type (Bennink et al., Reference Bennink, Tyler, Ward and Johnson1978) and intake patterns. This may explain the patterns of water consumption but, unfortunately, ruminal osmolality was not measured in the present trial.
Ruminal pH
The increase observed in the roughage intake and decrease in the concentrate intake may confound the interpretation of results on ruminal fermentation. We decided ad libitum straw allowance because it is the common feeding management in many commercial facilities around the world, as it is in Spain. The proportion of straw consumed increased from 10.2% to 17.2% as the level of BICARB increased from 0% to 5% of concentrate DM. However, this range of roughage intake variation is thought to have little effect on the measured parameters. Even higher increases in the forage-to-concentrate ratio of beef cattle did not show consistent effects on intake, ruminal pH or VFA (White et al., Reference White, Reynolds and Hembry1971; Rotger et al., Reference Rotger, Ferret, Calsamiglia and Manteca2005).
An increase of rumen fluid and solid passage rates, which results from increased water consumption (Rogers and Davis, Reference Rogers and Davis1982a and Reference Rogers and Davis1982b), is thought to be the main factor increasing ruminal pH when using mineral buffers, because of reduced substrate availability for fermentation (Russell and Chow, Reference Russell and Chow1993). More recently, however, there has been renewed support for the BICARB effect on ruminal pH through hydrogen neutralization (Kohn and Dunlap, Reference Kohn and Dunlap1998). In the present experiment, water consumption was not consistently affected by BICARB addition, this being a possible reason for the lack of buffer effect on daily average ruminal pH. Indeed>, even a decrease in ruminal acid load could be expected as the level of BICARB increased, due to decreased concentrate intake and increased forage intake, and this did not affect ruminal pH. Erdman (Reference Erdman1988) reported a mean increase of 0.26 pH units when BICARB was added to dairy cow diets containing less than 30% forage, at a mean rate of 2.5% of BICARB. Nicholson et al. (Reference Nicholson, Cunningham and Friend1963) observed an increase of 0.46 pH units in the mean 8-h post-prandial pH when adding 3% BICARB to all-concentrate rations. The regression coefficients of the buffer concentration on ruminal pH at 2 and 4 h post-feeding were similar (0.13 and 0.12, respectively). These results indicate that BICARB alleviated the after-feeding pH depression. In fact, pH fell by 0.64, 0.58, 0.44 and 0.45 pH units at 2 h after feeding, for the 0%, 1.25%, 2.5% and 5% BICARB treatments, respectively. Higher ruminal pH in single rumen samples taken at 4 h after feeding high-concentrate rations were reported by Zinn (Reference Zinn1991) when feeding 0.75% BICARB diets to finishing steers and by Quigley et al. (Reference Quigley, Wallis, Dowlen and Heitmann1992) when feeding 3% BICARB diets to calves. The effect of BICARB on post-feeding ruminal pH plus the large differences observed for the number of hours and area under the pH curve in which pH remained under 5.8, not previously reported, could be the most beneficial effect of the buffer on rumen environment.
Ruminal fermentation
Values found for total VFA concentrations are typically high for concentrate finishing rations (Rumsey et al., Reference Rumsey, Putnam, Bond and Oltjen1970; Rotger et al., Reference Rotger, Ferret, Calsamiglia and Manteca2005). Although the daily average total VFA concentration of the control diet was 12% higher than the other treatments, no effect was observed. This is in agreement with other reports (Nicholson et al., Reference Nicholson, Cunningham and Friend1963; Rogers et al., Reference Rogers, Davis and Clark1982). However, decreases in total VFA concentration caused by increased water consumption and passage rate were suggested as the main mechanism for this result when using mineral buffers (Rogers and Davis, Reference Rogers and Davis1982a and Reference Rogers and Davis1982b; Russell and Chow, Reference Russell and Chow1993). We expected an effect of BICARB level on total VFA concentrations at 2 and 4 h after feeding because of previously observed effects on ruminal pH (Table 3) and water consumption (Table 4). Although total VFA concentration at 2 h was 21% higher in the control diet compared with the 5% BICARB treatment, the differences were not significant. Regardless of diet, VFA concentration increased from 0 to 2 h and further to 4 h after feeding (P < 0.05; data not shown), as opposed to ruminal pH. Thereafter, it remained high until 16 h after feeding, and decreased again until 24 h (P < 0.05).
Whereas the average molar proportion of propionate decreased linearly with BICARB addition, the molar proportion of acetate increased linearly, resulting in a linear increase in the acetate-to-propionate ratio (Table 5). When the multiple regression of acetate and propionate molar proportion and their ratio were calculated against all the preceding variables, all three were mostly explained by the level of concentrate intake, in g DM/kg BW0.75, which yielded an r 2 ⩾ 0.75. The number of hours in which ruminal pH remained under 5.8 explained a smaller proportion of the variation, with an r 2 ⩽ 0.08. These results are consistent with Rumsey et al. (Reference Rumsey, Putnam, Bond and Oltjen1970), who demonstrated the necessity of recognizing the effect of feed intake level when interpreting ruminal data. Moreover, they pointed out that changes in ruminal acids due to the feed intake level were greater when an all-concentrate diet was fed compared with a roughage diet, probably due to the inherently low liquid and solid ruminal passage rates. In the present experiment, however, confounding factors may be hidden by the level of concentrate intake because linear effects were observed for many variables. The effect of the number of hours at suboptimal pH on the VFA molar proportions was previously demonstrated in vitro in our laboratory (Cerrato-Sanchéz et al., Reference Cerrato-Sanchéz, Calsamiglia and Ferret2007). The treatment effect on daily average propionate and acetate molar proportion is in agreement with Thomas and Hall (Reference Thomas and Hall1984), Zinn (Reference Zinn1991) and Quigley et al. (Reference Quigley, Wallis, Dowlen and Heitmann1992) with BICARB levels of 0.75%, 3% and 5%, respectively, in growing cattle fed high-concentrate diets. However, Hart and Polan (Reference Hart and Polan1984) and Nicholson et al. (Reference Nicholson, Cunningham and Friend1963) did not observe any difference in propionate at BICARB levels between 0.75% and 4.5%.
The increase in daily average n-butyrate is in agreement with Nicholson et al. (Reference Nicholson, Cunningham and Friend1963) and Rogers et al. (Reference Rogers, Davis and Clark1982). In contrast, Thomas and Hall (Reference Thomas and Hall1984) did not observe any effect of adding 1% and 2.5% of BICARB on n-butyrate. Ruminal BCVFA originate primarily from dietary true protein degradation, although microbial protein recycling within the rumen also increases BCVFA (Miura et al., Reference Miura, Horiguchi and Matsumoto1980). In the present experiment, there is no evidence of different dietary protein degradation, because there were no differences in ruminal NH3 N concentration among diets. However, the linear increase of BCVFA as the BICARB level increased could be due to the greater protein recycling or degradability, or both, caused by the decrease in CP intake as the BICARB level increased. In fact, when stepwise regression was performed, the selected variables affecting daily average BCVFA concentration were CP intake, BICARB level, and the water consumption-to-DMI ratio (adjusted R 2 = 0.66; P < 0.01). The CP intake contributed to the model with a negative coefficient of regression (b = − 0.62), explaining 47% of the total variation in the BCVFA concentration. In contrast, Hart and Polan (Reference Hart and Polan1984) did not find any effect of linear increases of BICARB level on isobutyric or isovaleric acids at 3 h post-feeding.
In conclusion, the addition of BICARB to high-concentrate diets for growing heifers reduced the intake of concentrate that included bicarbonate whereas straw intake decreased. Therefore, animal performance may be affected. Total daily water consumption was not affected but the amount drunk per unit of feed intake increased as sodium bicarbonate increased. No consistent effects on daily ruminal pH were observed, perhaps because the buffer did not affect total daily water consumption. However, alleviation in the post-prandial ruminal pH depression was observed shortly after feeding. All the ruminal VFA proportions were affected by the bicarbonate level, except for n-valerate.
Acknowledgments
This research was supported by CICYT (Project AGL2000-0352). The studentship of the first author from MECD (FPU AP20023344) is acknowledged.