INTRODUCTION
Understanding environmental and geographic factors that determine species composition is crucial for our understanding of current and future patterns of biological communities (Ricklefs, Reference Ricklefs2004). Species composition of communities varies over space and time and is shaped by both evolutionary and ecological mechanisms (Ricklefs, Reference Ricklefs1987; Wiens, Reference Wiens1989). It is thus not surprising that biologists have been trying for decades to understand factors involved in shaping communities. One of the approaches to understand variation in species composition of communities is to compare patterns of compositional community dissimilarity across different regions or taxa by comparing the rate at which this dissimilarity (or species turnover) increases as a function of geographic and/or environmental distances (e.g. Ferrier et al. Reference Ferrier, Gray, Cassis, Wilkie, Ponder and Lunney1999; Poulin and Morand, Reference Poulin and Morand1999; Vinarski et al. Reference Vinarski, Korallo, Krasnov, Shenbrot and Poulin2007). Unfortunately, this method does not provide much insight into evolutionary processes that assemble biological communities. However, this limitation could be overcome by studying patterns of phylogenetic dissimilarity of communities across regions or taxa to highlight phylogenetic relationships (Cavender-Bares et al. Reference Cavender-Bares, Kozak, Fine and Kembel2009; Rosauer et al. Reference Rosauer, Ferrier, Williams, Manion, Keogh and Laffan2014).
Phylogenetic dissimilarity is especially informative when investigating patterns at regional scales because regional communities are shaped not only by broad scale ecological but also evolutionary processes (Gaston, Reference Gaston2000). Although it can provide additional information on factors responsible for broad-scale spatial patterns in species composition of communities, phylogenetic dissimilarity has received less attention than compositional dissimilarity (Cavender-Bares et al. Reference Cavender-Bares, Kozak, Fine and Kembel2009; Rosauer et al. Reference Rosauer, Ferrier, Williams, Manion, Keogh and Laffan2014). In particular, metrics of phylogenetic community dissimilarity allow comparison between localities that share no species (Rosauer et al. Reference Rosauer, Ferrier, Williams, Manion, Keogh and Laffan2014). For example, similarity between two communities with no shared species will increase if the community from which a given species is absent nevertheless contains species that are phylogenetically related to it. Thus, utilizing phylogenetic dissimilarity can be a key tool in understanding evolutionary processes behind community assembly.
Several studies applied measurements of both phylogenetic and compositional dissimilarity across regions to determine, which factors played most important roles in shaping community composition of various plant and animal taxa (e.g. Bell et al. Reference Bell, Heard, Manion, Ferrier and Klinken2013; Fitzpatrick et al. Reference Fitzpatrick, Sanders, Normand, Svenning, Ferrier, Gove and Dunn2013; Jones et al. Reference Jones, Ferrier, Condit, Manion, Aguilar and Perez2013). Results of these studies strongly suggested that including both measures of dissimilarity allows a better understanding of all factors involved. However, only a few studies have been conducted on parasites (e.g. Krasnov et al. Reference Krasnov, Mouillot, Shenbrot, Khokhlova, Vinarski, Korallo-Vinarskaya and Poulin2010), although parasites are convenient models for these types of questions because they rely heavily on hosts that act as both resource patch and habitat (Combes, Reference Combes2001; Poulin, Reference Poulin2007). The reason for calling the mammals ‘hosts’ is that, in this study, we considered their main role as a source of resources for parasites and tested if and how their spatial variation affects spatial variation in parasite communities. To emphasize this role, we prefer to use the term ‘host’ throughout the paper. In fact, parasite community composition is often structured by interplay of ecological, evolutionary and biogeographic factors that shape host assemblages (Hoberg and Brooks, Reference Hoberg, Brooks, Morand and Krasnov2010).
Parasite community structure is well-studied at the levels of individual hosts (infracommunities) and host populations (component communities); thus, factors shaping these communities are relatively well-known and documented (see Poulin, Reference Poulin2007 for review). In contrast, communities comprising all parasites in all hosts in a given locality (compound communities) are somewhat overlooked and our knowledge of predominant patterns and processes in these communities is limited. For example, Vinarski et al. (Reference Vinarski, Korallo, Krasnov, Shenbrot and Poulin2007) found that compositional dissimilarity of gamasid mite compound communities exploiting small mammal hosts in the Palearctic was mainly affected by compositional dissimilarity of their hosts. However, the pattern of the relationships between parasite and host dissimilarities could differ for phylogenetic component of dissimilarity and/or in other biogeographic realms. This is due to differences in evolutionary history of host–parasite associations and a variety of historical and biogeographic events and processes such as plate tectonics and glaciation. To overcome these shortcomings, Krasnov et al. (Reference Krasnov, Mouillot, Khokhlova, Shenbrot and Poulin2012) compared the relationship between flea compositional and phylogenetic dissimilarity and host compositional and phylogenetic dissimilarity among four biogeographical realms. Krasnov et al. (Reference Krasnov, Mouillot, Khokhlova, Shenbrot and Poulin2012) demonstrated that compositional dissimilarity in host assemblages strongly affected compositional dissimilarity in flea assemblages in all realms, whereas the effect of phylogenetic dissimilarity of hosts on phylogenetic dissimilarity of flea assemblages varied among realms. Moreover, the effect of geographical distance on compositional and phylogenetic dissimilarity of flea assemblages was only found in some, but not all, realms. However, the authors implemented a linear approach, which could influence the results. This linear approach could obscure real spatial patterns in species turnover due to two, likely erroneous, assumptions, namely that: (a) the relationship between ecological separation (environmental and/or spatial) and observed dissimilarity is linear and (b) rate of species turnover along a gradient (spatial, environmental or host turnover) is constant (Ferrier et al. Reference Ferrier, Manion, Elith and Richardson2007).
Recently, a non-linear approach to study species turnover (Generalized Dissimilarity Modelling, GDM; Ferrier, Reference Ferrier2002; Ferrier et al. Reference Ferrier, Drielsma, Manion and Watson2002) has been developed as an extension of matrix regression designed to accommodate these limitations through generalized linear models (Ferrier et al. Reference Ferrier, Manion, Elith and Richardson2007). In fact, when applying a non-linear vs linear approach to ecological data substantial differences result from the two approaches (Fitzpatrick et al. Reference Fitzpatrick, Sanders, Normand, Svenning, Ferrier, Gove and Dunn2013) with the former revealing patterns unnoticed by the latter.
Here, we revisited the results of Krasnov et al. (Reference Krasnov, Mouillot, Khokhlova, Shenbrot and Poulin2012) by applying a non-linear approach to the original dataset and examining relationships between compositional and phylogenetic dissimilarity of flea communities and the communities of their small mammalian hosts across distinct regions in four biogeographic realms (Afrotropics, Palaearctic, Neotropics, Nearctic) as well as within the Old World (combined Afrotropical and Palaearctic realms) and the New World (combined Neotropical and Nearctic realms). Similarly to Krasnov et al. (Reference Krasnov, Mouillot, Khokhlova, Shenbrot and Poulin2012), we included geographic distance between communities to control for its possible confounding effect due to distance decay of similarity in our models. Although not universal, this process wherein similarity in species composition between any two localities decreases with increasing geographical distance between them (Nekola and White, Reference Nekola and White1999) is ubiquitous enough to warrant caution when analysing these types of datasets. GDM is able to accommodate differences in rate of species turnover along and between gradients (see Ferrier et al. Reference Ferrier, Manion, Elith and Richardson2007). Thus, we predicted that overall model performance would be better and the effects of geographic distance and host phylogenetic/compositional turnover on that of fleas would differ depending on utilization of the non-linear or the linear approach. To identify differences in the rate of flea turnover within realms and hemispheres we compared variation in this rate along geographic distances and host phylogenetic/compositional dissimilarity gradients between realms. We expected to find these differences because communities in different realms have experienced different evolutionary histories.
MATERIALS AND METHODS
Distribution of fleas and small mammals
Data on fleas that parasitize small mammal hosts were obtained from 63 published studies (7 from Afrotropics, 28 from Palaearctic, 8 from Neotropics and 20 from Nearctic; for details, see Supplementary Material in Krasnov et al. Reference Krasnov, Mouillot, Khokhlova, Shenbrot and Poulin2012, Reference Krasnov, Kiefer, Warburton and Khokhlova2016a , Reference Krasnov, Shenbrot, Khokhlova and Degen b ). In total, the dataset included 433 flea species collected from 392 small mammal species (Didelphimorphia, Paucituberculata, Macroscelidea, Erinaceomorpha, Soricomorpha, Lagomorpha and Rodentia). From these data, we constructed matrices for flea and host occurrence for each realm (Afrotropics, Palearctic, Neotropics and Nearctic) and hemisphere (Old World and New World).
Phylogenetic dissimilarity
We used the most recent molecular phylogeny of fleas (Zhu et al. Reference Zhu, Hastriter, Whiting and Dittmar2015) as the backbone for the phylogenetic tree of fleas. This tree, published by Zhu et al. (Reference Zhu, Hastriter, Whiting and Dittmar2015), comprised 205 species and 110 genera of fleas (approximately 10 and 46% of the total numbers of species and genera, respectively, of the order; Medvedev, Reference Medvedev2005). The positions of genera and species absent from Zhu et al.’s (Reference Zhu, Hastriter, Whiting and Dittmar2015) tree were determined according to their morphologically based taxonomy (see Krasnov et al. Reference Krasnov, Poulin and Mouillot2011). The global phylogenetic supertree of Bininda-Emonds et al. (Reference Bininda-Emonds, Cardillo, Jones, MacPhee, Beck, Grenyer, Price, Vos, Gittleman and Purvis2007, corrigendum 2008) was used as the backbone for the phylogenetic tree for mammals. The topology of branches within clades (orders, families, genera) was modified using various sources (see references in online Supplementary Materials in Krasnov et al. Reference Krasnov, Kiefer, Warburton and Khokhlova2016a , Reference Krasnov, Shenbrot, Khokhlova and Degen b ). Phylogenetic trees for fleas and hosts in four biogeographic realms are presented in Appendix 1 of Supplementary Materials. We calculated matrices of Sørensen phylogenetic and compositional dissimilarity for flea and host communities separately for each realm and hemisphere. Sorensen's index of phylogenetic dissimilarity was calculated using the PhyloSor index (Bryant et al. Reference Bryant, Lamanna, Morlon, Kerkhoff, Enquist and Green2008) implemented in package ‘picante’ (Kembel et al. Reference Kembel, Cowan, Helmus, Cornwell, Morlon, Ackerly, Blomberg and Webb2010), whereas compositional dissimilarity was calculated as the Bray–Curtis index (Bray and Curtis, Reference Bray and Curtis1957) using package ‘vegan’ (Oksanen et al. Reference Oksanen, Blanchet, Friendly, Kindt, Legendre, McGlinn, Minchin, O'Hara, Simpson, Solymos, Stevens, Szoecs and Wagner2016) in R v3.3.2 (R Development Core Team, 2015). Phylogenetic dissimilarity reflects the influence of lineages shared between two communities, which either lead to shared taxa or result in unshared taxa. PhyloSor calculates the fraction of branch lengths shared between each pair of communities (Bryant et al. Reference Bryant, Lamanna, Morlon, Kerkhoff, Enquist and Green2008). Close-to-zero values of PhyloSor represent pairs of communities that have species which only share a very small root, while close-to-one values represent pairs of communities, which are composed by the same taxa. Data on phylogenetic and compositional dissimilarity were analysed separately.
Data analyses
We used GDM to investigate the relationship between flea compositional and phylogenetic dissimilarity and host compositional and phylogenetic dissimilarity, respectively, within realms and hemispheres. GDM was originally designed to study turnover in species composition along environmental gradients or geographic distance (Ferrier, Reference Ferrier2002; Ferrier et al. Reference Ferrier, Drielsma, Manion and Watson2002, Reference Ferrier, Manion, Elith and Richardson2007). Recently this approach was extended to investigate relationships in spatial turnover along gradients (a) between more than one taxon (Jones et al. Reference Jones, Ferrier, Condit, Manion, Aguilar and Perez2013) and (b) of phylogenetic composition (i.e. phylo-GDM; Rosauer et al. Reference Rosauer, Ferrier, Williams, Manion, Keogh and Laffan2014).
GDM is an extension of matrix regression designed to overcome non-linear constraints (Ferrier, Reference Ferrier2002; Ferrier et al. Reference Ferrier, Drielsma, Manion and Watson2002, Reference Ferrier, Manion, Elith and Richardson2007). Linear regression on distance matrices (e.g. MRM; see Manly, Reference Manly1986; Legendre and Legendre, Reference Legendre and Legendre1998; Lichstein, Reference Lichstein2007 for details) that measure the effect of explanatory matrices (e.g. environmental gradient or geographic distance) on a single response matrix (e.g. compositional dissimilarity) was commonly used to analyse community composition. However, a linear approach could obscure patterns in species composition via two forms of non-linearity frequently encountered in ecological data (see Ferrier et al. Reference Ferrier, Manion, Elith and Richardson2007 for detail). Firstly, most measures of dissimilarity are constrained between 0 and 1. Therefore, the relationship between pairwise dissimilarity among sites and environmental or geographic distance between pairs is necessarily curvilinear when at high values of dissimilarity, although this relationship could be treated as linear when at low dissimilarity (Ferrier et al. Reference Ferrier, Manion, Elith and Richardson2007). Secondly, the rate of species turnover along an environmental gradient or geographic distance is assumed to be constant in a linear approach, although in reality it could vary along the gradient (Ferrier et al. Reference Ferrier, Manion, Elith and Richardson2007). GDM overcomes the problem of a curvilinear relationship between ecological separation and dissimilarity by changing the approach to a generalized linear model. It uses a link function to define the relationship between pairwise between-site dissimilarity and a scaled combination of environmental or geographic distances between sites (Ferrier et al. Reference Ferrier, Manion, Elith and Richardson2007). In order to overcome the problem of non-constant turnover along environmental gradient or geographic distance, GDM transforms each predictor variable through iterative maximum-likelihood estimation and I-splines (Ferrier et al. Reference Ferrier, Manion, Elith and Richardson2007). I-splines are partial regression fits that show the importance of the effect of each predictor variable on dissimilarity when all other variables are held constant. Two critical characteristics can be derived from I-spline plots, (1) maximum height of the plot, which describes total amount of turnover along a given gradient, and (2) slope and shape of the plot, which describes the rate of turnover and its variation along the gradient (Ferrier et al. Reference Ferrier, Manion, Elith and Richardson2007).
We ran GDMs using the ‘gdm’ package (Manion et al. Reference Manion, Lisk, Ferrier, Nieto-Lugilde and Fitzpatrick2016) of R by fitting models with the default setting of three I-splines. Two main GDMs were fitted to each realm, namely (1) a response matrix of pairwise compositional dissimilarity of fleas with predictors being pairwise compositional dissimilarity of hosts and geographic distance, and (2) a response matrix of pairwise phylogenetic dissimilarity of fleas with predictors being pairwise phylogenetic dissimilarity of hosts and geographic distance. In addition, we fitted the GDMs to relationships between flea dissimilarity and host dissimilarity for each hemisphere, but we did not include geographic distance as a predictor in these models due to large oceanic gaps and/or narrow terrestrial bridges between realms belonging to the Old or to the New World. To assess uncertainty in I-spline functions, we simulated 100 bootstrap iterations of each GDM model leaving out 30% of species using function plotUncertainty of ‘gdm’ package and produced the rug plots indicating distribution of regions used in model fitting along gradients of compositional and phylogenetic host dissimilarity. Significance of each model was assessed through matrix permutation procedure using function ‘gdm.varImp’ of the ‘gdm’ package (100 permutations).
To estimate the ‘pure’ effect of each predictor matrix we recorded deviance explained by separate GDMs excluding one of the predictor matrices (i.e. the matrix of interest). Then, we calculated the ‘pure’ effect of this matrix of interest following the decomposition of Legendre and Legendre (Reference Legendre and Legendre1998) for multiple fractions of explanations (see also Borcard et al. Reference Borcard, Legendre and Drapeau1992; Lichstein, Reference Lichstein2007) and expressing the fraction of variation explained by each ‘pure effect’ as a percentage of total explained deviance of the full model. Detailed explanations of this method can be found in Borcard et al. (Reference Borcard, Legendre and Drapeau1992), Legendre and Legendre (Reference Legendre and Legendre1998), Legendrè et al. (Reference Legendrè, Borcard and Peres-Neto2005), Tuomisto and Roukolainen (Reference Tuomisto and Roukolainen2006), and Krasnov et al. (Reference Krasnov, Mouillot, Shenbrot, Khokhlova, Vinarski, Korallo-Vinarskaya and Poulin2010).
Finally, we compared our results with that of Krasnov et al. (Reference Krasnov, Mouillot, Khokhlova, Shenbrot and Poulin2012) to see if there were differences between the results produced by the non-linear and the linear approach. We assessed improvement in explanatory power of non-linear models by comparing the percentage deviance explained by the model to coefficients of determination of linear models. Thereafter, we assessed the differences in predictor variable contribution between non-linear and linear models. Then, we visually inspected the shape of plots of spatial turnover across gradients of the non-linear models, evaluated their slopes (via coefficients of I-splines) and compared them with those of the linear models.
RESULTS
Compositional dissimilarity
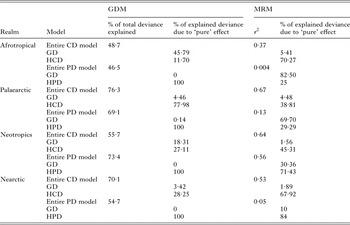
GDMs of the relationships between compositional dissimilarity of flea assemblages and geographic distance and host compositional dissimilarity resulted in more than 70% of deviance explained in the Palaearctic and the Nearctic and about 50% of deviance explained in the two remaining realms (Table 1). Host compositional dissimilarity was the best predictor of flea dissimilarity in the Palaearctic, the Nearctic and the Neotropics, whereas geographic distance was the best predictor of flea dissimilarity in the Afrotropical realm. Furthermore, the ‘pure’ effect of host compositional dissimilarity was lower in the Neotropics and the Nearctic than in the Palaearctic realm (Table 1). GDMs resulted in a larger amount of deviance explained in all realms compared with linear models, except for in the Neotropics, which resulted in a marginally lower percentage deviance explained. Moreover, geographic distance appeared to be the best predictor in the Afrotropics, contrary to the linear model, while host compositional dissimilarity remained the best predictor in the other realms independently of whether linear or non-linear approach was implemented (Table 1). At the scale of hemispheres, GDMs of the relationships between compositional dissimilarity of flea assemblages and host compositional dissimilarity resulted in 74·5 and 66·2% of the deviance (P < 0·0001 for both) explained for the Old and the New World, respectively. This was similar to the proportion of variation explained by the linear models [Krasnov et al. (Reference Krasnov, Mouillot, Khokhlova, Shenbrot and Poulin2012); R 2 = 0·80 for the Old World and R 2 = 0·63 for the New World].
Results of non-linear (GDM) and linear analyses (MRM) of the effect of geographic distance (GD) and host compositional or phylogenetic (HCD or HPD, respectively) dissimilarity on flea compositional or phylogenetic (CD or PD, respectively) dissimilarity in four biogeographic realms

See text for explanation of ‘pure’ effect of a predictor. Results of linear analyses are from Krasnov et al. (Reference Krasnov, Mouillot, Khokhlova, Shenbrot and Poulin2012). All entire GDMs were significant (P < 0·0001). See text for explanation on significance testing.
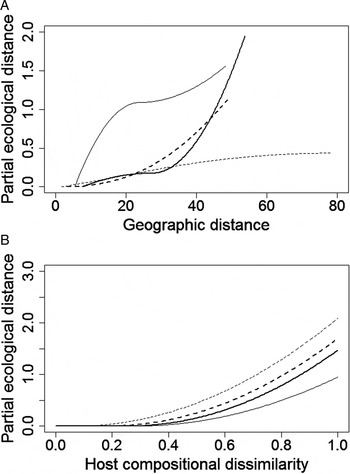
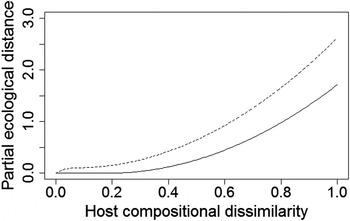
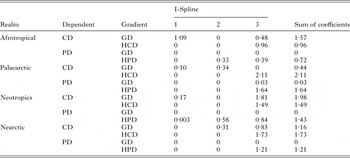
The shape of the relationships between flea turnover and geographic distance differed among realms (Table 2, Fig. 1A). In the Afrotropics, it increased sharply until reaching a threshold, then remained constant at short geographic distances, but then increased moderately with increasing geographic distance. In the Palaearctic, the rate of flea turnover was high up to a point and then reached an asymptote (Fig. 1A). Flea turnover was low and steady in the Neotropics, but then, increased sharply at medium to high geographic distances. In the Nearctic, flea turnover increased parabolically with an increasing geographic distance (Fig. 1A). The shape of the relationships between flea and host turnover was similar in all realms being steady at low values of host turnover, but then, increasing sharply at medium to high values of host turnover (Table 2, Fig. 1B). At the scale of hemispheres, the shape of the relationship between flea and host turnover was similar, although the rate of flea turnover along the host turnover was higher in the Old than in the New World (coefficients of the three I-splines for the Old World were 0, 0 and 3·24 and for the New World were 0, 0 and 2·86) (Fig. 2). Rug plots of I-splines are presented in Figs S1 and S2 of Appendix 2 of Supplementary Materials. Greater uncertainty in I-spline functions was associated with (a) smaller sampling effort and data availability (Afrotropical and Neotropical realms versus Nearctic and Palearctic realms) and (b) smaller spatial scale (realms vs hemispheres).
Generalized dissimilarity model-fitted I-spline (partial regression fit) of (A) geographic distance and (B) host compositional dissimilarity as a predictor of flea compositional dissimilarity in four biogeographic realms. Solid line, the Afrotropics; dashed line, the Palearctic; bold solid line, the Neotropics; bold dashed line, the Nearctic.

Generalized dissimilarity model-fitted I-spline (partial regression fit) of geographic distance as a predictor of flea compositional dissimilarity in two hemispheres. Solid line, the New World; dashed line, the Old World.

Coefficients of I-splines from the GDMs of the dependence of flea compositional or phylogenetic (CD or PD, respectively) dissimilarity on geographic distance (GD) and host compositional or phylogenetic dissimilarity (HCD or HPD, respectively) in four biogeographic realms

Phylogenetic dissimilarity
The GDMs of the relationships between phylogenetic dissimilarity of flea assemblages and geographic distance and host phylogenetic dissimilarity resulted in about 70% of deviance explained in the Palaearctic and the Neotropics and about 50% of deviance explained in the Afrotropics and the Nearctic (Table 1). Host phylogenetic dissimilarity was the best predictor of flea turnover, whereas flea turnover was constant along geographic distance in all realms (Table 1). The GDMs explained a substantially larger percentage of the deviance in all realms compared with the linear models. However and contrary to linear models, host phylogenetic dissimilarity was the best predictor of flea phylogenetic turnover in all realms and not only in the Neotropics and the Nearctic as in Krasnov et al. (Reference Krasnov, Mouillot, Khokhlova, Shenbrot and Poulin2012) (Table 1). At the scale of hemispheres, the GDMs of the relationships between flea and host phylogenetic turnover resulted in 78·4 and 76·4% of deviance (P < 0·0001 for both) explained in the Old and the New World, respectively, explaining thus substantially greater proportion of variation than linear models [Krasnov et al. (Reference Krasnov, Mouillot, Khokhlova, Shenbrot and Poulin2012); R 2 = 0·31 for the Old World and R 2 = 0·47 for the New World].
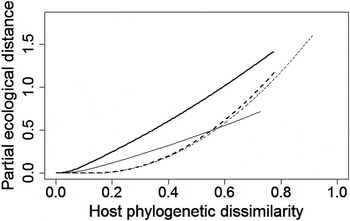
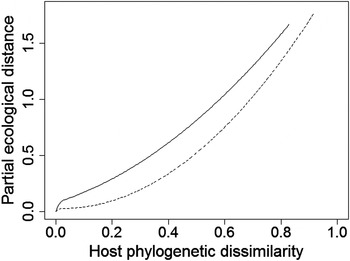
The rate of flea phylogenetic turnover was almost constant along the gradient of host phylogenetic turnover in the Afrotropical and Neotropical realms as well as across the entire New World (coefficients of the three I-splines for the New World were 0·09, 0·36 and 1·23) (Table 2, Figs 3 and 4). In the Palaearctic and Nearctic realms as well as across the Old World, the rate of flea turnover was steady at low values of host turnover, and then it sharply increased (Table 2, Figs 3 and 4) (coefficients of the three I-splines for the Old World were 0·01, 0 and 1·79). Similarly to compositional dissimilarity, greater uncertainty in I-spline functions was associated with smaller sampling effort/data availability and smaller spatial scale (Figs S3 and S4 in Appendix 2 of Supplementary Materials).
Generalized dissimilarity model-fitted I-spline (partial regression fit) of host phylogenetic dissimilarity as a predictor of flea phylogenetic dissimilarity in four biogeographic realms. Solid line, the Afrotropics; dashed line, the Palearctic; bold solid line, the Neotropics; bold dashed line, the Nearctic.

Generalized dissimilarity model-fitted I-spline (partial regression fit) of host phylogenetic dissimilarity as a predictor of flea phylogenetic dissimilarity in two hemispheres. Solid line, the New World; dashed line, the Old World.

DISCUSSION
We found that, in general, GDMs explained a larger percentage of variation in flea turnover in all realms and both hemispheres as compared with linear models. Furthermore, the GDMs demonstrated that both compositional and phylogenetic dissimilarity of hosts were the best predictors of compositional and phylogenetic dissimilarity of fleas, respectively, at both scales. Nevertheless, the rate of flea compositional turnover along gradients of geographic distance differed among realms, whereas it was similar among realms along gradients of host compositional turnover. In sharp contrast, the rate of flea phylogenetic turnover along gradients of host phylogenetic turnover differed among realms, whereas it did not depend on geographic distance.
The improvement of model fit with the application of a non-linear approach is expected because GDMs can accommodate curvilinear relationship between flea turnover and gradients of geographic distance and/or host turnover as well as non-constant rates of flea species turnover along these gradients (Ferrier, Reference Ferrier2002; Ferrier et al. Reference Ferrier, Drielsma, Manion and Watson2002, Reference Ferrier, Manion, Elith and Richardson2007; see above). In contrast, linear models assume constant rates of flea turnover along gradients. Our study demonstrates non-constant rates of flea turnover along gradients and between different gradients within and among realms. Non-constant rates in species turnover along environmental gradients and geographic distance exist in other systems where GDMs result in better model fit than linear models (Fitzpatrick et al. Reference Fitzpatrick, Sanders, Normand, Svenning, Ferrier, Gove and Dunn2013; Rosauer et al. Reference Rosauer, Ferrier, Williams, Manion, Keogh and Laffan2014). For example, Fitzpatrick et al. (Reference Fitzpatrick, Sanders, Normand, Svenning, Ferrier, Gove and Dunn2013) found better model fit for GDMs in European flora that demonstrated variation in the rate of species turnover along gradients of climate, soil and geographic distance across regions and taxa. Moreover, rates of turnover differed among regions, which experienced different evolutionary and climatic histories (Fitzpatrick et al. Reference Fitzpatrick, Sanders, Normand, Svenning, Ferrier, Gove and Dunn2013).
Nevertheless, GDMs based on compositional turnover are limited in one key aspect: species turnover generally increases with increasing difference among environments, but once no species are shared among communities, species-based dissimilarity indices become saturated (Stegen and Hurlbert, Reference Stegen and Hurlbert2011). In contrast, phylogeny-based dissimilarity indices can demonstrate lineage turnover among sites even when no species are shared (Rosauer et al. Reference Rosauer, Ferrier, Williams, Manion, Keogh and Laffan2014). Consequently, from a methodological perspective, the GDM is expected to demonstrate greater improvement in model fit than linear models for phylogenetic as compared with compositional turnover along gradients. Moreover, from an evolutionary perspective, better model fit is expected when closely related lineages occur in similar environments (Rosauer et al. Reference Rosauer, Ferrier, Williams, Manion, Keogh and Laffan2014). The main environment of a flea is the host, which acts as both a resource patch and habitat. Thus, substantially improved model fit is expected if closely related flea lineages occur on closely related host lineages, which is generally the case for fleas (Hadfield et al. Reference Hadfield, Krasnov, Poulin and Nakagawa2014; Krasnov et al. Reference Krasnov, Kiefer, Warburton and Khokhlova2016a ). Moreover, in our study, the Palearctic realm demonstrated the best model fit and is known to have relatively specialized flea-host associations as compared with other realms (Medvedev, Reference Medvedev2005, Reference Medvedev2014; Krasnov et al. Reference Krasnov, Shenbrot, Khokhlova and Poulin2007, Reference Krasnov, Shenbrot, Khokhlova and Degen2016b ).
Fleas originated and diversified with mammals (Traub, Reference Traub, Traub and Starke1980, Reference Traub and Kim1985; Medvedev, Reference Medvedev2005; Whiting et al. Reference Whiting, Whiting, Hastriter and Dittmar2008; Zhu et al. Reference Zhu, Hastriter, Whiting and Dittmar2015). It is thus not surprising that host compositional and phylogenetic dissimilarity was the best predictors of flea compositional and phylogenetic dissimilarity in most realms (except for the Afrotropics) and both hemispheres when fitting the GDMs. Nevertheless, the weaker relationship between compositional dissimilarity in flea and host assemblages and the concomitantly stronger association between phylogenetic dissimilarity in flea and host assemblages within realms suggest that flea-host co-evolutionary relationships are stronger than indicated by the linear models (Krasnov et al. Reference Krasnov, Mouillot, Khokhlova, Shenbrot and Poulin2012). However, the relative strength of the relationships between compositional and phylogenetic dissimilarity of flea and host assemblages at the scale of hemispheres also suggest that these co-evolutionary relationships are greater at deeper levels of flea and mammal phylogenies (Krasnov and Shenbrot, Reference Krasnov and Shenbrot2002; Lu and Wu, Reference Lu and Wu2005; Zhu et al. Reference Zhu, Hastriter, Whiting and Dittmar2015; Krasnov et al. Reference Krasnov, Kiefer, Warburton and Khokhlova2016a ). Conversely, flea-host associations within realms are to a great extent shaped by the processes of host switching and ecological fitting (Janzen, Reference Janzen1985; Brooks et al. Reference Brooks, León-Règagnon, McLennan and Zelmer2006).
In the Palearctic, the relationships between compositional and phylogenetic dissimilarity of flea and host assemblages were very strong. This is likely because the flea fauna in this realm is the most diverse (approximately 38% of all fleas) in the world, whereas it is lower in other realms (Medvedev, Reference Medvedev2005). Moreover, host diversity controls flea diversity in the Palaearctic (but not in the Nearctic, for example), so that each flea species interacts with relatively fewer host species (Krasnov et al. Reference Krasnov, Shenbrot, Khokhlova and Poulin2007, Reference Krasnov, Shenbrot, Khokhlova and Degen2016b ). The formation of Palearctic flea fauna was mainly triggered by terrestrial connections between adjacent areas at the end of the Neogene, which allowed colonization by hosts from surrounding areas and subsequently shaped by glacial-interglacial cycles during the Pleistocene (Medvedev and Kotti, Reference Medvedev and Kotti2012, Reference Medvedev and Kotti2013; Medvedev, Reference Medvedev2014). This suggests that flea and host communities in the Palearctic were shaped by similar historical events.
Contrary to linear models (Krasnov et al. Reference Krasnov, Mouillot, Khokhlova, Shenbrot and Poulin2012), we found a stronger effect of geographic distance on flea compositional dissimilarity within realms, especially in the Neotropics and the Afrotropics. However, the Afrotropics was the only realm where geographic distance was the best predictor of flea compositional dissimilarity. Distance decay of similarity can be the result of (1) a decrease in environmental similarity with increasing geographic distance, (2) action of hard geographic barriers that more likely prevent dispersal with increasing geographic distance, and/or (3) limited dispersal ability of species (Soininen et al. Reference Soininen, McDonald and Hillebrand2007). In our study, it is likely as a result of the former mechanism. The Afrotropical realm, which includes Madagascar, is unique in its absolute location compared with other realms, which results in a higher climatic diversity (see Kottek et al. Reference Kottek, Grieser, Beck, Rudolf and Rubel2006). Thus, a greater decrease in environmental similarity with increasing geographic distance between locations is more likely. In addition, the strong effect of geographic distance on flea compositional dissimilarity found in this study for the Afrotropics might be somehow associated with the scarcity of data on flea-host associations in this realm. However, this is unlikely because the data for the Neotropics were also rather deficient, but the patterns revealed were similar to those in the Palearctic and the Nearctic.
Interestingly, the shape of flea compositional turnover along geographic distance differed among realms, whereas it was similar along host compositional turnover in all realms. This is likely because of geographic invariance in the relationships between fleas and their hosts (e.g. obligatory haematophagy, pre-imaginal development off the host), whereas flea-environment relationships may differ among realms. Indeed, flea turnover along geographic distance reflects not only changes in host composition, but also changes in the off-host environment. For example, annual cycles of closely-related species of the genus Nosopsyllus vary geographically (Krasnov et al. Reference Krasnov, Burdelova, Shenbrot and Khokhlova2002a ). The off-host environment is especially important for the pre-imaginal development of fleas (Krasnov et al. Reference Krasnov, Khokhlova, Fielden and Burdelova2001, Reference Krasnov, Khokhlova, Fielden and Burdelova2002b ). As a result, flea species composition in a given locality can be determined not only by host species composition but also environmental factors (Krasnov et al. Reference Krasnov, Shenbrot, Medvedev, Vatschenok and Khokhlova1997). At the scale of hemispheres, the rate of flea compositional turnover along host compositional turnover was greater in the Old World compared with the New World. This pattern is likely driven by processes in the Palearctic (see above).
In sharp contrast, the rate of flea phylogenetic turnover along host phylogenetic turnover differed among realms. This hints at among-realm differences in the history of flea-host associations. Indeed, earlier studies suggested flea-host associations in the Old World might have had longer evolutionary time to develop the relationships between the two taxa as compared with the New World. For example, Krasnov et al. (Reference Krasnov, Shenbrot, Khokhlova and Poulin2007) found that host diversity controls flea diversity in the Palearctic, but not in the Nearctic and explained this between-realm difference with historical events, such as climate oscillations. However, we found that the rate of flea phylogenetic turnover along host turnover did not differ between Old World and New World realms, but rather between realms of the Northern and the Southern hemispheres. The almost linear trends of flea-host phylogenetic turnover in the southern realms could be caused by (a) their long isolation from one another (since the Latest Cretaceous until the Middle Eocene) and (b) similar and stable climatic conditions during the Pleistocene (Medvedev, Reference Medvedev1996). As a result of isolation, there are a greater number of endemic flea genera in the Neotropics and the Afrotropics than in the northern realms (Medvedev, Reference Medvedev2005). In contrast, realms of the Northern Hemisphere have been isolated from one another for a shorter time and experienced less stable climatic conditions with glaciation covering most of the hemisphere during the Pleistocene. Therefore, past glaciation and glacial-interglacial cycles as well as greater colonization potential experienced in Northern Hemisphere realms, but not in Southern Hemisphere realms, likely disrupted flea–host associations despite a longer evolutionary history (Medvedev, Reference Medvedev1996).
In conclusion, GDMs appeared to be substantially better at explaining patterns of dissimilarity in flea and host assemblages than linear models, irrespective of scale, because the rate of turnover can vary along gradients and between gradients of environmental variables and geographic distance. Our results differed quite substantially from those obtained earlier using a linear approach, especially in terms of the relationship between compositional and phylogenetic dissimilarity of flea and host assemblages. Thus, future studies aimed at better understanding of spatial variation in community organisation could greatly benefit by including both phylogenetic and compositional components and using non-linear approaches.
SUPPLEMENTARY MATERIALS
The supplementary materials for this article can be found at https://doi.org/10.1017/S003118201700066X.
ACKNOWLEDGEMENTS
We thank three anonymous reviewers for very helpful comments on the earlier version of the manuscript. This is publication no. 927 of the Mitrani Department of Desert Ecology.
FINANCIAL SUPPORT
This study was partly supported by the Israel Science Foundation (Grant no. 26/12 to BRK and ISK). LVDM received financial support from the Blaustein Center for Scientific Cooperation and the French Associates Institute for Agriculture and Biotechnology of Drylands. EMW received financial support from the United States-Israel Educational Foundation (USIEF Fulbright Post-Doctoral Fellowship) and the Swiss Institute for Dryland Environmental and Energy Research.