1 Introduction
The high skin friction experienced in turbulent flows represents a problem for several engineering applications, such as pipelines and transportation vehicles. The need is therefore to develop new technologies that reduce turbulent drag, preferably passive, since in contrast with active technologies, these do not require an energy input and have generally lower manufacturing costs. In this paper we present the potential of anisotropic permeable substrates, a passive technology, to reduce turbulent skin friction, aimed particularly at external-flow applications, as has recently been proposed by Abderrahaman-Elena & García-Mayoral (Reference Abderrahaman-Elena and García-Mayoral2017).
Most of the literature in turbulent flows over permeable substrates has focused on isotropic materials, observing a substantial increase in drag with respect to a smooth wall (Breugem, Boersma & Uittenbogaard Reference Breugem, Boersma and Uittenbogaard2006; Rosti, Cortelezzi & Quadrio Reference Rosti, Cortelezzi and Quadrio2015; Kuwata & Suga Reference Kuwata and Suga2016). This increase has often been attributed to the onset of large spanwise-coherent structures, which increase the momentum transfer and thus the Reynolds stresses near the wall. Here, we study the effect of anisotropy. We show that a substrate with streamwise-preferential permeability, that is, a substrate where the permeability is higher in the streamwise than in the cross-directions, can reduce turbulent drag, and we provide physical insight into this phenomenon. Recent studies have also covered anisotropic substrates, albeit not considering the case of streamwise-preferential permeability (Kuwata & Suga Reference Kuwata and Suga2017; Suga et al. Reference Suga, Okazaki, Ho and Kuwata2018).
Previous studies have shown that streamwise-preferential complex surfaces can reduce drag in turbulent flows (Luchini, Manzo & Pozzi Reference Luchini, Manzo and Pozzi1991; Jiménez Reference Jiménez1994; Bechert et al. Reference Bechert, Bruse, Hage, Van der Hoeven and Hoppe1997; Gómez-de-Segura, Sharma & García-Mayoral Reference Gómez-de-Segura, Sharma and García-Mayoral2018b ). This is indeed the case for some of the most common passive technologies for drag reduction, such as riblets or superhydrophobic surfaces. Recently, Abderrahaman-Elena & García-Mayoral (Reference Abderrahaman-Elena and García-Mayoral2017) suggested that the drag-reduction ability of anisotropic permeable substrates is based on the same mechanism. The general idea is that complex surfaces can reduce drag if they offer more resistance to the cross-flow than to the streamwise mean flow (Luchini et al. Reference Luchini, Manzo and Pozzi1991). When the surface texture is vanishingly small compared to the near-wall turbulent structures, the effect of complex surfaces can be reduced to an apparent slip in the tangential directions. Luchini et al. (Reference Luchini, Manzo and Pozzi1991), Jiménez (Reference Jiménez1994) and Luchini (Reference Luchini1996) showed that the change in drag is proportional to the difference between the streamwise and spanwise slips. This behaviour was, for instance, observed by Hahn, Je & Choi (Reference Hahn, Je and Choi2002), who performed simulations of turbulent flows over idealised substrates that were permeable in the streamwise and/or spanwise directions only. They observed that the streamwise slip is beneficial for drag reduction, while the spanwise slip is deleterious. Their substrates, however, were ideal in the sense that they were impermeable in the wall-normal direction. Hence, the work by Hahn et al. (Reference Hahn, Je and Choi2002) is more connected to studies where only tangential slips are allowed, such as those carried out by Min & Kim (Reference Min and Kim2004) or Busse & Sandham (Reference Busse and Sandham2012), than to realistic permeable substrates, where any significant tangential slip at the surface would be accompanied by some degree of wall-normal transpiration. Recently, Rosti, Brandt & Pinelli (Reference Rosti, Brandt and Pinelli2018) have studied permeable substrates with very low wall-normal permeability, which would also fall under this category. The analysis by Gómez-de-Segura et al. (Reference Gómez-de-Segura, Fairhall, MacDonald, Chung and García-Mayoral2018a ) shows that the deleterious effect of the spanwise slip saturates if this is not accompanied by a corresponding wall-normal transpiration. Therefore, surfaces with isotropic slip, such as those considered by Rosti et al. (Reference Rosti, Brandt and Pinelli2018), can also reduce drag, although suboptimally.
The linear theory of Luchini et al. (Reference Luchini, Manzo and Pozzi1991) and Jiménez (Reference Jiménez1994) is valid only as long as the texture length scales are small compared to the characteristic length scales of near-wall turbulence. As the texture size increases, additional deleterious effects set in, breaking down the drag-reducing performance and eventually leading to an increase of drag. The mechanisms behind these deleterious effects vary from one technology to another. In riblets, for instance, the degradation of performance is due to the appearance of spanwise-coherent rollers, which arise from a Kelvin–Helmholtz instability (García-Mayoral & Jiménez Reference García-Mayoral and Jiménez2011). These structures are in fact a prevalent feature to a variety of obstructed flows (Ghisalberti Reference Ghisalberti2009) and they have also been observed to form over permeable substrates (Breugem et al. Reference Breugem, Boersma and Uittenbogaard2006; Kuwata & Suga Reference Kuwata and Suga2016; Zampogna & Bottaro Reference Zampogna and Bottaro2016; Suga, Nakagawa & Kaneda Reference Suga, Nakagawa and Kaneda2017). In these studies, the large increase of the Reynolds stresses and the subsequent increase in drag was associated with the presence of Kelvin–Helmholtz rollers. Abderrahaman-Elena & García-Mayoral (Reference Abderrahaman-Elena and García-Mayoral2017) suggested the appearance of these rollers as a possible drag-degrading mechanism for anisotropic permeable substrates. They proposed a model to bound the maximum achievable drag reduction based on the onset of the Kelvin–Helmholtz-like instability. Gómez-de-Segura et al. (Reference Gómez-de-Segura, Sharma and García-Mayoral2018b ) extended the analysis and identified the wall-normal permeability as the governing parameter in this instability. This result agrees with the work performed by Jiménez et al. (Reference Jiménez, Uhlmann, Pinelli and Kawahara2001), who observed the formation of Kelvin–Helmholtz rollers over substrates that were permeable in the wall-normal direction only, and inferred that the relaxation of the impermeability condition at the wall was sufficient to elicit the rollers.
Several drag-reducing surfaces show a linear regime, where the drag reduction increases linearly with a certain characteristic length of the texture, followed by a saturation and an eventual increase of drag (García-Mayoral & Jiménez Reference García-Mayoral and Jiménez2011). Although the same has not been shown for anisotropic permeable substrates, the similarities between the drag reduction curves of riblets and those of seal fur by Itoh et al. (Reference Itoh, Tamano, Iguchi, Yokota, Akino, Hino and Kubo2006) suggest a similar behaviour (Abderrahaman-Elena & García-Mayoral Reference Abderrahaman-Elena and García-Mayoral2017). The effect of the seal fur studied by Itoh et al. (Reference Itoh, Tamano, Iguchi, Yokota, Akino, Hino and Kubo2006) would be to some extent that of an anisotropic permeable material, since it is a layer of hairs preferentially aligned in the streamwise direction.
In the current work, we investigate the drag-reduction ability of anisotropic permeable substrates. The aim of this work is to understand how the overlying turbulent flow is modified by the presence of such substrates and build predictive models to estimate their drag-reducing behaviour. For that, we perform a series of direct numerical simulations (DNSs) of channel flows bounded by permeable substrates. The flow within the substrates is modelled using a continuum approach and solved analytically to provide boundary conditions for the DNS. The substrate configurations studied are selected using the information obtained from a linear stability theory and the linearised theory of Luchini et al. (Reference Luchini, Manzo and Pozzi1991) and Jiménez (Reference Jiménez1994) for drag reduction.
The paper is organised as follows. In § 2, we discuss several models to characterise the flow within the permeable substrates and present the analytic solution to the model subsequently used, Brinkman’s model. How streamwise-preferential permeable substrates can reduce drag is explained in § 3, where we also discuss the theoretical models derived by Abderrahaman-Elena & García-Mayoral (Reference Abderrahaman-Elena and García-Mayoral2017) and Gómez-de-Segura et al. (Reference Gómez-de-Segura, Sharma and García-Mayoral2018b ). The former provides estimates for the expected drag reduction in the linear regime, while the latter bounds the achievable drag reduction based on linear stability theory. These models allow us to select particular permeable substrates for the subsequent DNS study. Details for the DNS setup are presented in § 4. In § 5, we present the DNS results for the permeable substrates selected and assess the validity of the theoretical models. Drag-reduction curves for different anisotropic permeable substrates are also included, allowing to define design guidelines for optimal substrate configurations. Finally, conclusions are summarised in § 6.
2 Flow within the permeable substrate
Following Abderrahaman-Elena & García-Mayoral (Reference Abderrahaman-Elena and García-Mayoral2017) and Gómez-de-Segura et al. (Reference Gómez-de-Segura, Sharma and García-Mayoral2018b ), we focus on permeable materials where the pores are much smaller than any near-wall turbulent length scale. We therefore opt for a macroscopic, homogenised approach to model the flow within the permeable medium, due to the high resolution required otherwise to explicitly resolve the flow within the pores. The permeable medium is modelled as homogeneous, by defining a local, instantaneous average solution of the flow within the fluid–solid matrix.
A classical approach to characterise the homogenised flow within a permeable medium is Darcy’s equation (Darcy Reference Darcy1856). This is the simplest model amongst the continuum approaches, and results from a volume average of the Stokes equation over many pores/particulate obstacles. Note that under the assumption of vanishingly small pore size, such averages could still be conducted in small volumes compared to the scales of the overlying flow. Darcy’s equation is a balance between the driving pressure gradient across the permeable medium and the resistance to the flow exerted by the solid matrix. More sophisticated continuum approaches used in the literature include homogenisation techniques (Zampogna & Bottaro Reference Zampogna and Bottaro2016; Lācis & Bagheri Reference Lācis and Bagheri2017; Bottaro Reference Bottaro2019) or the volume averaged Navier–Stokes equations (VANS) (Ochoa-Tapia & Whitaker Reference Ochoa-Tapia and Whitaker1995a ,Reference Ochoa-Tapia and Whitaker b ; Whitaker Reference Whitaker1996). Several authors have recently used the latter to study flows over permeable substrates (Breugem et al. Reference Breugem, Boersma and Uittenbogaard2006; Tilton & Cortelezzi Reference Tilton and Cortelezzi2008; Rosti et al. Reference Rosti, Cortelezzi and Quadrio2015).
(a) General layout throughout the present work. (b) Detail of the macroscale flow within the substrate. (c) Detail of the microscale flow within the substrate.

The volume average implicit in Darcy’s equation accounts for the viscous stresses caused by velocity gradients over lengths smaller than the averaging one. This effectively filters out diffusive effects acting over larger length scales. If the latter are relevant, they can be accounted for by including a macroscopic diffusive term, yielding Brinkman’s equation (Brinkman Reference Brinkman1947),
 $$\begin{eqnarray}\unicode[STIX]{x1D735}p=-\unicode[STIX]{x1D708}\unicode[STIX]{x1D646}^{-1}\boldsymbol{u}+\tilde{\unicode[STIX]{x1D708}}\unicode[STIX]{x1D6FB}^{2}\boldsymbol{u}.\end{eqnarray}$$
The first two terms in (2.1) constitute Darcy’s equation, and the last term,
 $\tilde{\unicode[STIX]{x1D708}}\unicode[STIX]{x1D6FB}^{2}\boldsymbol{u}$
, is the Brinkman term, with
 $\boldsymbol{u}$
the velocity vector averaged over the total averaging volume,
 $p$
the kinematic pressure averaged over the fluid phase in the volume and
 $\unicode[STIX]{x1D708}$
and
 $\tilde{\unicode[STIX]{x1D708}}$
the molecular and the effective macroscopic viscosity, respectively. This approach has been used by several authors to model the flow within permeable substrates and canopies (James & Davis Reference James and Davis2001; Battiato Reference Battiato2012, Reference Battiato2014; Battiato & Rubol Reference Battiato and Rubol2014; Rubol, Ling & Battiato Reference Rubol, Ling and Battiato2018). The homogenised flow within the permeable substrate and the different length scales accounted for by the various terms in (2.1) are illustrated in figure 1. Panel (c) portrays the flow between the obstacles, which results in Darcy’s equation when averaged, while panel (b) portrays the large scale diffusion missed by the volume averaging and captured by the Brinkman term. Brinkman’s model is suitable for substrates made up of open matrices of obstacles, such as that sketched in figure 2(a), where fluid regions are significantly interconnected and diffusion can act efficiently over large scales. However, it does not represent correctly substrates made up of microducts essentially isolated from each other, such as that sketched in figure 2(b), where diffusion cannot act over scales larger than the pores (Lévy Reference Lévy1983; Auriault Reference Auriault2009). Abderrahaman-Elena & García-Mayoral (Reference Abderrahaman-Elena and García-Mayoral2017) used this distinction to characterise substrates as ‘highly connected’ or ‘poorly connected’, and argued that the former offered better properties for drag reduction. Furthermore, for the small values of permeabilities considered in this study, the flow within the substrate would be dominantly viscous. In this scenario, Brinkman’s model provides a simple but reasonable approximation. We therefore follow Abderrahaman-Elena & García-Mayoral (Reference Abderrahaman-Elena and García-Mayoral2017) and Gómez-de-Segura et al. (Reference Gómez-de-Segura, Sharma and García-Mayoral2018b
) and use Brinkman’s equation to model the flow within the substrate. For larger permeabilities, the advective effects would also become important, giving rise to form drag around the obstacles in the permeable matrix. These effects could be considered through the addition of a Forchheimer term (Forchheimer Reference Forchheimer1901; Joseph, Nield & Papanicolaou Reference Joseph, Nield and Papanicolaou1982; Whitaker Reference Whitaker1996).
In highly connected substrates, under certain assumptions Brinkman’s model allows us to capture the interfacial region that forms immediately below the substrate–fluid interface. This equation is also a volume averaging model, so it implicitly assumes that any small volume within the substrate contains a large number of obstacles. However, as the averaging volume approaches the interface with the free flow, this assumption would eventually cease to hold. The specialised literature shows no general agreement regarding the treatment of the substrate–fluid interface (Ochoa-Tapia & Whitaker Reference Ochoa-Tapia and Whitaker1995a ; Le Bars & Worster Reference Le Bars and Worster2006; Zampogna & Bottaro Reference Zampogna and Bottaro2016; Lācis & Bagheri Reference Lācis and Bagheri2017). Some studies impose jump conditions of different types, such as a jump in velocity (Beavers & Joseph Reference Beavers and Joseph1967), a jump in shear stress (Ochoa-Tapia & Whitaker Reference Ochoa-Tapia and Whitaker1995a ) or continuity of both velocity and shear stress (Neale & Nader Reference Neale and Nader1974; Vafai & Kim Reference Vafai and Kim1990; Battiato Reference Battiato2012, Reference Battiato2014). Other studies define an adaptation region where the permeability transitions smoothly from its value within the substrate to infinity in the free flow (Breugem et al. Reference Breugem, Boersma and Uittenbogaard2006; Le Bars & Worster Reference Le Bars and Worster2006). For simplicity, here we assume that pores are infinitely small, so the continuum hypothesis would hold for any vanishingly small volume, and Brinkman’s equation remains valid near the interface (Vafai & Kim Reference Vafai and Kim1990).
Conceptual sketches of (a) a highly connected material, where the interstitial flow is well interconnected and diffusion effects can propagate throughout, and (b) a poorly connected permeable material, where no diffusive effects connect different pores. The red arrow represents the direction of the overlying flow.

2.1 Analytic solution of Brinkman’s equation
In the present work we consider channels of height
 $2\unicode[STIX]{x1D6FF}$
delimited by two identical anisotropic permeable substrates of thickness
 $h$
, as sketched in figure 1. The substrate–channel interfaces are located at
 $y=0$
and
 $y=2\unicode[STIX]{x1D6FF}$
, and the substrates are bounded by impermeable walls at
 $y=-h$
and
 $y=2\unicode[STIX]{x1D6FF}+h$
. Throughout the paper we will refer to the free-flow region between
 $y=0$
and
 $y=2\unicode[STIX]{x1D6FF}$
as the ‘channel’ and to the permeable regions below
 $y=0$
and above
 $y=2\unicode[STIX]{x1D6FF}$
as the ‘substrates’. The flow within the permeable substrates is modelled using (2.1), where the fluid density
 $\unicode[STIX]{x1D70C}$
is assumed to be unity for convenience. The simplicity of Brinkman’s equation allows to solve it analytically, and the particularised solution at the substrate–channel interfaces can be implemented as boundary conditions for the DNS of the channel flow, fully coupling the flow in both regions. The procedure to solve Brinkman’s equation is detailed in appendix A. Here, only the problem formulation and its solution are presented.
As discussed above, poorly connected substrates have negligible macroscale viscous effects, which in (2.1) can be interpreted as having
 $\tilde{\unicode[STIX]{x1D708}}=0$
, recovering Darcy’s equation. Highly connected substrates, in turn, would asymptotically tend to a macroscale diffusion as efficient as in a free flow,
 $\tilde{\unicode[STIX]{x1D708}}\approx \unicode[STIX]{x1D708}$
(Tam Reference Tam1969; Neale & Nader Reference Neale and Nader1974; Lévy Reference Lévy1983; Abderrahaman-Elena & García-Mayoral Reference Abderrahaman-Elena and García-Mayoral2017). Abderrahaman-Elena & García-Mayoral (Reference Abderrahaman-Elena and García-Mayoral2017) and Gómez-de-Segura et al. (Reference Gómez-de-Segura, Sharma and García-Mayoral2018b
) suggested that such materials would have a better potential for drag reduction, as it will be discussed in § 3. Here we follow them and assume
 $\tilde{\unicode[STIX]{x1D708}}=\unicode[STIX]{x1D708}$
. The permeable substrates are characterised then by their thickness,
 $h$
, and their permeabilities
 $K_{x}$
,
 $K_{y}$
and
 $K_{z}$
in the streamwise,
 $x$
, wall-normal,
 $y$
, and spanwise,
 $z$
, directions, respectively, which are assumed to be the principal directions of the permeability tensor
 $\unicode[STIX]{x1D646}$
in (2.1). The tensor has dimensions of length squared, and is a measure of the ability of the fluid to flow through the permeable medium. When
 $\unicode[STIX]{x1D646}\rightarrow \infty$
the medium offers no resistance to the flow, and when
 $\unicode[STIX]{x1D646}=0$
an impermeable medium is recovered.
Let us consider the lower substrate between
 $y=-h$
and
 $y=0$
. To solve (2.1), we impose no slip and impermeability at
 $y=-h$
, and continuity of the tangential and normal stresses at the substrate–channel interface, i.e. at
 $y=0$
. The solution within the substrate is coupled to the flow within the channel by imposing the continuity of the three velocity components. The resulting boundary conditions at
 $y=0$
are then
 $$\begin{eqnarray}\displaystyle & \displaystyle \unicode[STIX]{x1D708}\left[\frac{\unicode[STIX]{x2202}u}{\unicode[STIX]{x2202}y}+\frac{\unicode[STIX]{x2202}v}{\unicode[STIX]{x2202}x}\right]_{y=0^{+}} & \displaystyle =\tilde{\unicode[STIX]{x1D708}}\left[\frac{\unicode[STIX]{x2202}u}{\unicode[STIX]{x2202}y}+\frac{\unicode[STIX]{x2202}v}{\unicode[STIX]{x2202}x}\right]_{y=0^{-}},\end{eqnarray}$$
 $$\begin{eqnarray}\displaystyle & \displaystyle \unicode[STIX]{x1D708}\left[\frac{\unicode[STIX]{x2202}w}{\unicode[STIX]{x2202}y}+\frac{\unicode[STIX]{x2202}v}{\unicode[STIX]{x2202}z}\right]_{y=0^{+}} & \displaystyle =\tilde{\unicode[STIX]{x1D708}}\left[\frac{\unicode[STIX]{x2202}w}{\unicode[STIX]{x2202}y}+\frac{\unicode[STIX]{x2202}v}{\unicode[STIX]{x2202}z}\right]_{y=0^{-}},\end{eqnarray}$$
 $$\begin{eqnarray}\displaystyle & \displaystyle \left[-p+2\unicode[STIX]{x1D708}\frac{\unicode[STIX]{x2202}v}{\unicode[STIX]{x2202}y}\right]_{y=0^{+}} & \displaystyle =\left[-p+2\tilde{\unicode[STIX]{x1D708}}\frac{\unicode[STIX]{x2202}v}{\unicode[STIX]{x2202}y}\right]_{y=0^{-}},\end{eqnarray}$$
 $y=0^{+}$
and
 $y=0^{-}$
correspond to the channel and the substrate sides of the interface, respectively. Under the above assumptions, the boundary conditions (2.2) can be further simplified. The continuity of tangential stresses becomes that of
 $\unicode[STIX]{x2202}u/\unicode[STIX]{x2202}y$
and
 $\unicode[STIX]{x2202}w/\unicode[STIX]{x2202}y$
, and the continuity of normal stresses that of
 $p$
. Equation (2.1) is then solved by taking Fourier transforms in the tangential directions
 $(x,z)$
. Following the derivations presented in appendix A, the analytic solution particularised at
 $y=0$
provides the following expressions for the velocities,
 $$\begin{eqnarray}\displaystyle & \displaystyle \hat{u} |_{y=0^{+}} & \displaystyle =\hat{u} |_{y=0^{-}}=\left.{\mathcal{C}}_{uu}\frac{\text{d}\hat{u} }{\text{d}y}\right|_{y=0^{+}}+\left.{\mathcal{C}}_{uw}\frac{\text{d}{\hat{w}}}{\text{d}y}\right|_{y=0^{+}}+{\mathcal{C}}_{up}\hat{p}|_{y=0^{+}},\end{eqnarray}$$
 $$\begin{eqnarray}\displaystyle & \displaystyle {\hat{w}}|_{y=0^{+}} & \displaystyle ={\hat{w}}|_{y=0^{-}}=\left.{\mathcal{C}}_{wu}\frac{\text{d}\hat{u} }{\text{d}y}\right|_{y=0^{+}}+\left.{\mathcal{C}}_{ww}\frac{\text{d}{\hat{w}}}{\text{d}y}\right|_{y=0^{+}}+{\mathcal{C}}_{wp}\hat{p}|_{y=0^{+}},\end{eqnarray}$$
 $$\begin{eqnarray}\displaystyle & \displaystyle \hat{v}|_{y=0^{+}} & \displaystyle =\hat{v}|_{y=0^{-}}=\left.{\mathcal{C}}_{vu}\frac{\text{d}\hat{u} }{\text{d}y}\right|_{y=0^{+}}+\left.{\mathcal{C}}_{vw}\frac{\text{d}{\hat{w}}}{\text{d}y}\right|_{y=0^{+}}+{\mathcal{C}}_{vp}\hat{p}|_{y=0^{+}},\end{eqnarray}$$
 ${\mathcal{C}}_{ij}$
are complex and depend on the structure of the permeable substrate through
 $K_{x}$
,
 $K_{y}$
,
 $K_{z}$
and
 $h$
, as well as on the overlying flow through the streamwise and spanwise wavenumbers,
 $\unicode[STIX]{x1D6FC}_{x}$
and
 $\unicode[STIX]{x1D6FC}_{z}$
, or the corresponding wavelengths,
 $\unicode[STIX]{x1D706}_{x}=2\unicode[STIX]{x03C0}/\unicode[STIX]{x1D6FC}_{x}$
and
 $\unicode[STIX]{x1D706}_{z}=2\unicode[STIX]{x03C0}/\unicode[STIX]{x1D6FC}_{z}$
. The same procedure can be used to obtain a symmetric solution for the upper substrate, and the resulting expressions for the interface at
 $y=2\unicode[STIX]{x1D6FF}$
can be found in appendix A. The effect of the permeable substrates on the channel flow is introduced through equations (2.3) and the corresponding equations at
 $y=2\unicode[STIX]{x1D6FF}$
, which serve as boundary conditions.


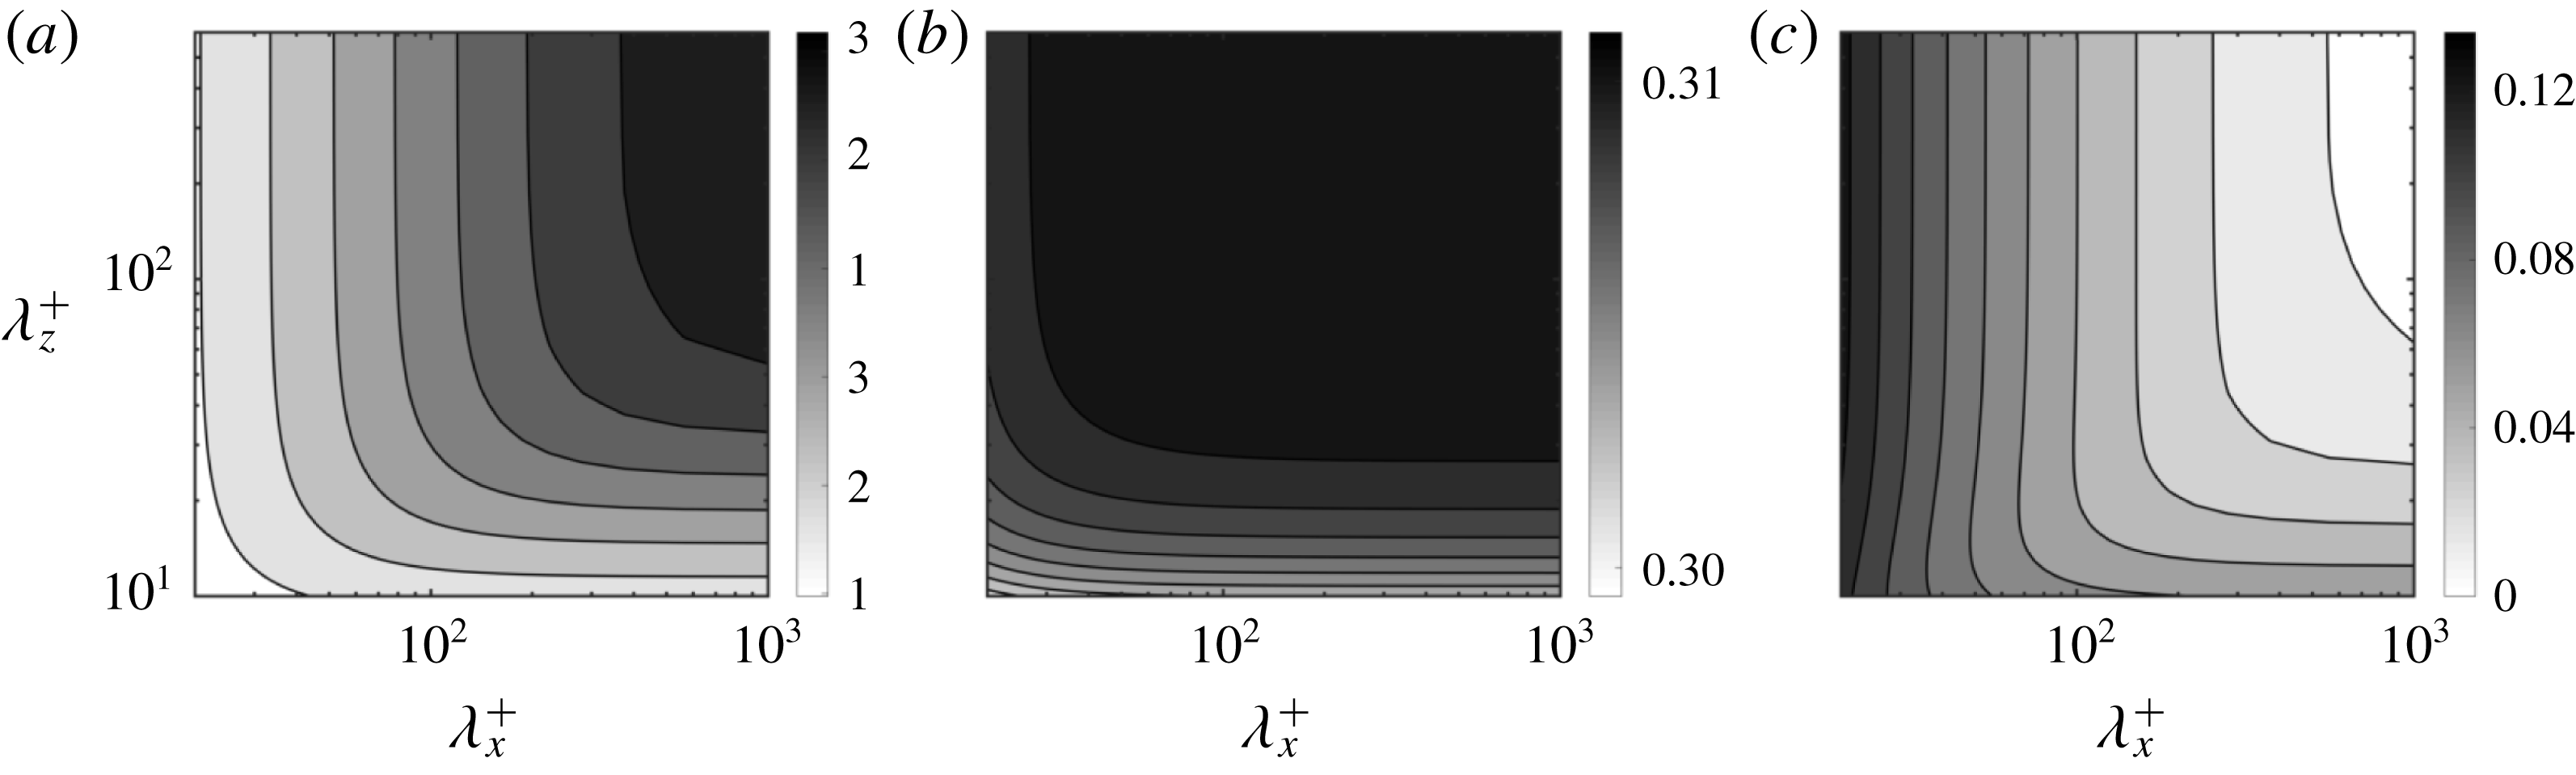
To illustrate how the coefficients in (2.3) vary with the wavelengths, figure 3 shows maps of
 ${\mathcal{C}}_{uu}^{+}$
,
 ${\mathcal{C}}_{ww}^{+}$
and
 ${\mathcal{C}}_{vp}^{+}$
, which have zero imaginary part, as a function of
 $\unicode[STIX]{x1D706}_{x}^{+}$
and
 $\unicode[STIX]{x1D706}_{z}^{+}$
for a particular substrate. The superscript ‘
 $+$
’ denotes viscous units, where magnitudes are normalised using the kinematic viscosity,
 $\unicode[STIX]{x1D708}$
, and the friction velocity at the substrate–channel interface,
 $u_{\unicode[STIX]{x1D70F}}=\sqrt{\unicode[STIX]{x1D70F}_{w}}$
. Note that the stress
 $\unicode[STIX]{x1D70F}_{w}$
includes both the viscous and the Reynolds stresses. The coefficients
 ${\mathcal{C}}_{uu}^{+}$
and
 ${\mathcal{C}}_{ww}^{+}$
relate the streamwise and spanwise velocities with their corresponding wall-normal gradients, respectively, and are connected to the slip boundary conditions typically used in slip-only simulations (Hahn et al.
Reference Hahn, Je and Choi2002; Min & Kim Reference Min and Kim2004; Busse & Sandham Reference Busse and Sandham2012);
 ${\mathcal{C}}_{vp}^{+}$
represents an impedance relating the wall-normal velocity and the pressure (Jiménez et al.
Reference Jiménez, Uhlmann, Pinelli and Kawahara2001). The slip coefficients
 ${\mathcal{C}}_{uu}^{+}$
and
 ${\mathcal{C}}_{ww}^{+}$
are purely real, so the tangential velocity is in phase with the tangential shear. The transpiration coefficient
 ${\mathcal{C}}_{vp}^{+}$
is also real but negative, so the wall-normal velocity is in anti-phase with the pressure. For the mean flow, i.e.
 $\unicode[STIX]{x1D6FC}_{x}^{+}=0$
and
 $\unicode[STIX]{x1D6FC}_{z}^{+}=0$
(or alternatively
 $\unicode[STIX]{x1D706}_{x}^{+}\rightarrow \infty$
and
 $\unicode[STIX]{x1D706}_{z}^{+}\rightarrow \infty$
), out of the 9 coefficients from (2.3) only
 ${\mathcal{C}}_{uu}^{+}$
and
 ${\mathcal{C}}_{ww}^{+}$
are non-zero. Their value decreases as the wavelengths decrease, as shown in figure 3. In contrast, the transpiration coefficient
 ${\mathcal{C}}_{vp}^{+}$
is zero for the mean flow and becomes increasingly negative as the wavelengths decrease, as smaller eddies penetrate more easily through the substrate. In Gómez-de-Segura et al. (Reference Gómez-de-Segura, Sharma and García-Mayoral2018b
), we conducted preliminary DNSs where only these three coefficients from (2.3) were included. This could, however, not capture the complete physics. The DNSs presented here in § 5 show that the other coefficients modulate the results, and this modulation can become significant as permeabilities increase.
3 Theoretical models
In this section, we use the theoretical models introduced by Abderrahaman-Elena & García-Mayoral (Reference Abderrahaman-Elena and García-Mayoral2017) and Gómez-de-Segura et al. (Reference Gómez-de-Segura, Sharma and García-Mayoral2018b ) to estimate the drag reduction that permeable substrates can achieve, and based on that, select the substrate configurations for the subsequent DNSs. We also discuss the effect on internal and external flows, and how they relate.
3.1 Drag reduction from surface manipulations
The friction coefficient,
 $c_{f}$
, can be defined as
 $$\begin{eqnarray}c_{f}=2\frac{\unicode[STIX]{x1D70F}_{w}}{U_{\unicode[STIX]{x1D6FF}}^{2}}=2\frac{1}{U_{\unicode[STIX]{x1D6FF}}^{+2}},\end{eqnarray}$$
where the density is assumed to be unity. The choice of the reference velocity
 $U_{\unicode[STIX]{x1D6FF}}$
depends on the type of flow studied. In external flows, the free stream velocity is typically used, while in internal flows the bulk velocity is more common. The substrates studied here would mainly be aimed at external-flow applications, for instance, as coatings in vehicle surfaces. The simulations, however, have been conducted in channels for simplicity. In this framework, García-Mayoral & Jiménez (Reference García-Mayoral and Jiménez2011) argued that choosing the centreline velocity as the reference for
 $c_{f}$
permitted a closer comparison with external-flow friction coefficients.
In the case of small surface textures, their effect is confined to the near-wall region. According to the classical theory of wall turbulence, sufficiently far away from the wall, the only effect of any surface manipulation is to modify the intercept of the logarithmic law, while the Kármán constant and the wake function remain unaltered (Clauser Reference Clauser1956). The centreline velocity is then
 $U_{\unicode[STIX]{x1D6FF}}^{+}=U_{\unicode[STIX]{x1D6FF}0}^{+}+\unicode[STIX]{x0394}U^{+}$
, where the subscript ‘
 $0$
’ indicates values for a reference smooth channel and
 $\unicode[STIX]{x0394}U^{+}$
is the shift of the velocity profile in the logarithmic region and above with respect to the smooth wall. The drag reduction (
 $DR$
) can then be expressed in terms of
 $\unicode[STIX]{x0394}U^{+}$
,
 $$\begin{eqnarray}DR=-\frac{c_{f}-c_{f0}}{c_{f0}}=1-\frac{1}{(1+\unicode[STIX]{x0394}U^{+}/U_{\unicode[STIX]{x1D6FF}0}^{+})^{2}}.\end{eqnarray}$$
If
 $\unicode[STIX]{x0394}U^{+}>0$
, the logarithmic region is shifted upwards and drag is reduced. Conversely, if
 $\unicode[STIX]{x0394}U^{+}<0$
, the logarithmic region is shifted downwards and drag is increased. Note that
 $DR$
depends weakly on the friction Reynolds number,
 $\unicode[STIX]{x1D6FF}^{+}$
, through
 $U_{\unicode[STIX]{x1D6FF}0}^{+}$
, while
 $\unicode[STIX]{x0394}U^{+}$
does not. Thus, a fixed surface texture in viscous units (with fixed
 $K_{x}^{+}$
,
 $K_{y}^{+}$
,
 $K_{z}^{+}$
and
 $h^{+}$
in our case) would result in the same
 $\unicode[STIX]{x0394}U^{+}$
independently of
 $\unicode[STIX]{x1D6FF}^{+}$
;
 $\unicode[STIX]{x0394}U^{+}$
provides therefore a more universal measure, as it can be extrapolated to higher
 $\unicode[STIX]{x1D6FF}^{+}$
(García-Mayoral & Jiménez Reference García-Mayoral and Jiménez2011; Spalart & McLean Reference Spalart and McLean2011; Gatti & Quadrio Reference Gatti and Quadrio2016; García-Mayoral, Gómez-de-Segura & Fairhall Reference García-Mayoral, Gómez-de-Segura and Fairhall2019). The change of
 $DR$
with
 $\unicode[STIX]{x0394}U^{+}$
given by (3.2) and its dependence with
 $\unicode[STIX]{x1D6FF}^{+}$
are depicted in figure 4. This figure shows a decrease of
 $DR$
with the Reynolds number, due to larger values of
 $U_{\unicode[STIX]{x1D6FF}0}^{+}$
. This can be expected to lead to discrepancies in
 $DR$
between simulations and experiments at low Reynolds numbers, and industrial applications at high Reynolds numbers. To circumvent this, in the present paper we quantify drag reduction in terms of
 $\unicode[STIX]{x0394}U^{+}$
.
Drag reduction,
 $DR$
, as a function of
 $\unicode[STIX]{x0394}U^{+}$
, as given by (3.2), for different friction Reynolds numbers.
 $DR$
has been calculated using the centreline velocities of the smooth channels in Hoyas & Jiménez (Reference Hoyas and Jiménez2006) and Lozano-Durán & Jiménez (Reference Lozano-Durán and Jiménez2014), Lee & Moser (Reference Lee and Moser2015). Blue to red,
 $\unicode[STIX]{x1D6FF}^{+}\approx 180$
,
 $540$
,
 $1000$
,
 $1990$
,
 $5180$
. The arrow indicates increasing friction Reynolds number.

3.2 Drag reduction from virtual origins
Drag reduction from non-smooth, passive surfaces has recently been reviewed in García-Mayoral et al. (Reference García-Mayoral, Gómez-de-Segura and Fairhall2019) as a virtual–origin effect for vanishingly small surface textures. The reduction of drag is essentially caused by an offset between the positions of the virtual, equivalent smooth walls perceived by the mean flow and the overlying turbulence, which remains otherwise smooth-wall-like (Luchini et al.
Reference Luchini, Manzo and Pozzi1991; Jiménez Reference Jiménez1994; Luchini Reference Luchini1996; Gómez-de-Segura et al.
Reference Gómez-de-Segura, Sharma and García-Mayoral2018b
);
 $\unicode[STIX]{x0394}U^{+}$
is then
 $$\begin{eqnarray}\unicode[STIX]{x0394}U^{+}\approx \ell _{U}^{+}-\ell _{T}^{+}.\end{eqnarray}$$
The coefficient
 $\ell _{U}^{+}$
refers to the depth of the virtual origin perceived by the mean flow, i.e. the depth below a reference plane where the mean flow perceives an apparent non-slipping wall,
 $y^{+}=-\ell _{U}^{+}$
. Conversely,
 $\ell _{T}^{+}$
refers to the depth of the virtual origin perceived by turbulence,
 $y^{+}=-\ell _{T}^{+}$
. Note that these virtual origins are measured from a reference plane, which for the permeable substrates studied here is taken at the substrate–fluid interface plane,
 $y=0$
. Luchini (Reference Luchini1996) suggested that the virtual origin for turbulence could be identified as the origin experienced by the quasi-streamwise vortices. If
 $\ell _{T}^{+}<\ell _{U}^{+}$
, quasi-streamwise vortices are, compared to a smooth wall, shifted farther away from the origin of the mean flow,
 $y^{+}=-\ell _{U}^{+}$
. As a result, the local momentum flux close to the surface decreases, thereby reducing the shear and the skin friction. Conversely, if
 $\ell _{U}^{+}<\ell _{T}^{+}$
, the vortices perceive a deeper origin than the mean flow and friction drag increases.
Luchini et al. (Reference Luchini, Manzo and Pozzi1991) and Luchini (Reference Luchini1996) proposed that the virtual origins of the mean flow and that of turbulence are set by those for the streamwise and spanwise velocities, respectively, i.e.
 $\ell _{U}^{+}\approx \ell _{x}^{+}$
and
 $\ell _{T}^{+}\approx \ell _{z}^{+}$
. Given that for small surface textures the velocity profile near the surface is linear, the effect of complex surfaces on the overlying flow is generally characterised by tangential Robin boundary conditions at the reference plane,
 $u^{+}|_{y^{+}=0}=\ell _{x}^{+}\unicode[STIX]{x2202}u/\unicode[STIX]{x2202}y^{+}|_{y^{+}=0}$
and
 $w^{+}|_{y^{+}=0}=\ell _{x}^{+}\unicode[STIX]{x2202}w/\unicode[STIX]{x2202}y^{+}|_{y^{+}=0}$
, where the Robin coefficients
 $\ell _{x}^{+}$
and
 $\ell _{z}^{+}$
are typically referred to as the streamwise and spanwise slip lengths and are roughly equal to the depths of the virtual origins. In addition, the mean streamwise shear is
 $\text{d}U^{+}/\text{d}y^{+}|_{y^{+}=0}\approx 1$
and the slip length,
 $\ell _{x}^{+}$
, is interchangeable with the slip velocity,
 $U_{slip}^{+}$
.
The above Robin boundary conditions are generally used in slip-only simulations, such as in Min & Kim (Reference Min and Kim2004) or Busse & Sandham (Reference Busse and Sandham2012). In these simulations, however, the adverse effect of
 $\ell _{z}^{+}$
on
 $\unicode[STIX]{x0394}U^{+}$
saturates for relatively small values of
 $\ell _{z}^{+}$
, and the linear expression
 $\unicode[STIX]{x0394}U^{+}\approx \ell _{x}^{+}-\ell _{z}^{+}$
is valid only for
 $\ell _{z}^{+}\lesssim 1$
. Gómez-de-Segura et al. (Reference Gómez-de-Segura, Fairhall, MacDonald, Chung and García-Mayoral2018a
) noted that this saturation effect is a result of the impermeability condition imposed at the interface,
 $v=0$
, as the imposed impermeability impedes the displacement of the quasi-streamwise vortices further towards the interface. This effect would be present in the drag-reducing simulations of Hahn et al. (Reference Hahn, Je and Choi2002) and Rosti et al. (Reference Rosti, Brandt and Pinelli2018), which considered zero or very low values of wall-normal permeabilities, so that
 $v\approx 0$
at the interface. This would not be the case for the permeable substrates in general, or for those studied in this paper in particular. For the DNSs presented in § 5, we consider equal wall-normal and spanwise permeabilities,
 $K_{y}^{+}=K_{z}^{+}$
. The slip in the spanwise direction is then always accompanied by a corresponding wall-normal transpiration, and the virtual origin perceived by turbulence is roughly given by
 $\ell _{T}^{+}\approx \ell _{z}^{+}$
, with no saturation effect. For a more general case where
 $K_{z}^{+}\neq K_{y}^{+}$
, however, we can expect
 $\ell _{T}^{+}\neq \ell _{z}^{+}$
(Gómez-de-Segura et al.
Reference Gómez-de-Segura, Fairhall, MacDonald, Chung and García-Mayoral2018a
; García-Mayoral et al.
Reference García-Mayoral, Gómez-de-Segura and Fairhall2019).
Abderrahaman-Elena & García-Mayoral (Reference Abderrahaman-Elena and García-Mayoral2017) derived analytical expressions for the streamwise and spanwise slip lengths caused by a permeable substrate. The authors calculated
 $\ell _{x}^{+}$
and
 $\ell _{z}^{+}$
by solving Brinkman’s equation (2.1) in response to an overlying homogeneous shear. This is the solution for mode zero (
 $\unicode[STIX]{x1D6FC}_{x}=0$
,
 $\unicode[STIX]{x1D6FC}_{z}=0$
) in appendix A, with
 $\ell _{x}^{+}$
and
 $\ell _{z}^{+}$
being the coefficients
 ${\mathcal{C}}_{uu}^{+}$
and
 ${\mathcal{C}}_{ww}^{+}$
. The slip lengths are then
 $$\begin{eqnarray}\ell _{x}^{+}=\unicode[STIX]{x1D709}\sqrt{K_{x}^{+}}\tanh \left(\frac{h^{+}}{\sqrt{K_{x}^{+}}}\right),\quad \ell _{z}^{+}=\unicode[STIX]{x1D709}\sqrt{K_{z}^{+}}\tanh \left(\frac{h^{+}}{\sqrt{K_{z}^{+}}}\right),\end{eqnarray}$$
where
 $\unicode[STIX]{x1D709}$
is the ratio between the molecular and effective viscosities of the permeable substrate. The expression for
 $\unicode[STIX]{x0394}U^{+}$
can be obtained by introducing these slip lengths into (3.3). The microstructure of the substrate, represented by
 $\unicode[STIX]{x1D709}$
, has therefore an important effect on the drag-reducing performance. The optimum configuration would be obtained for highly connected materials with
 $\unicode[STIX]{x1D709}\approx 1$
(i.e.
 $\tilde{\unicode[STIX]{x1D708}}\approx \unicode[STIX]{x1D708}$
), which justifies our previous assumption in § 2.1. Abderrahaman-Elena & García-Mayoral (Reference Abderrahaman-Elena and García-Mayoral2017) concluded that the highest performance for a given anisotropic material would be achieved for sufficiently deep substrates. For the purpose of the present paper, a substrate can be understood to be ‘deep’ when the overlying flow decays exponentially before reaching the bottom impermeable wall (see appendix A), i.e.
 $h^{+}\gtrsim \sqrt{K_{x}^{+}}$
and
 $h^{+}\gtrsim \sqrt{K_{z}^{+}}$
, and ‘shallow’ when the overlying flow penetrates all the way to the bottom. An analogous definition of deep and shallow substrates based on asymptotic analysis has been proposed by Battiato (Reference Battiato2012). For deep substrates, both hyperbolic tangents in (3.4) tend to unity and the slip lengths become
 $\ell _{x}^{+}\approx \sqrt{K_{x}^{+}}$
and
 $\ell _{z}^{+}\approx \sqrt{K_{z}^{+}}$
. Introducing these results into (3.3),
 $\unicode[STIX]{x0394}U^{+}$
becomes
 $$\begin{eqnarray}\unicode[STIX]{x0394}U^{+}\approx \sqrt{K_{x}^{+}}-\sqrt{K_{z}^{+}}.\end{eqnarray}$$
To maximise drag reduction, we are thus interested in highly anisotropic materials with large
 $K_{x}^{+}$
and small
 $K_{z}^{+}$
.
The linear theory that results in (3.5) is valid only if the texture length scales are small compared to the characteristic length scales of near-wall turbulence, so that the near-wall cycle is not altered. Thus, only when the pore size is vanishingly small can the effect of the substrates be reduced to a slip effect, as given by (3.5). If the pore size is comparable to the turbulent eddies, the granularity effect of the texture would be significant and this rough-like effect would give rise to an increase in drag.
For a given permeable material (i.e. with fixed permeability values
 $K_{x}$
,
 $K_{z}$
and
 $K_{y}$
), the permeabilities in viscous units,
 $K_{x}^{+}$
and
 $K_{z}^{+}$
, would increase as the friction Reynolds number increases, and so would their difference and, from (3.5),
 $\unicode[STIX]{x0394}U^{+}$
. This would find a limit when the granularity effects set in. There are, however, other degrading mechanisms that can set in even earlier, as the one discussed in § 3.3.
3.3 Onset of Kelvin–Helmholtz rollers
Equation (3.5) does not explicitly include the wall-normal permeability, or transpiration in general. However, most complex surfaces that produce slip produce also a non-zero wall-normal velocity at the reference plane, such as permeable substrates (Breugem & Boersma Reference Breugem and Boersma2005), riblets (García-Mayoral & Jiménez Reference García-Mayoral and Jiménez2011) or superhydrophobic surfaces (Seo, Garcia-Mayoral & Mani Reference Seo, Garcia-Mayoral and Mani2018), and this effect induces generally a degradation in drag. Abderrahaman-Elena & García-Mayoral (Reference Abderrahaman-Elena and García-Mayoral2017) and Gómez-de-Segura et al. (Reference Gómez-de-Segura, Sharma and García-Mayoral2018b ) suggested that the onset of the Kelvin–Helmholtz instability discussed in the introduction would disrupt the linear regime of (3.5), and could therefore be used to establish an a priori limit for its range of validity.
In Gómez-de-Segura et al. (Reference Gómez-de-Segura, Sharma and García-Mayoral2018b ), we developed a model based on a linear stability analysis around a mean turbulent profile to capture the onset of Kelvin–Helmholtz rollers, following Jiménez et al. (Reference Jiménez, Uhlmann, Pinelli and Kawahara2001), García-Mayoral & Jiménez (Reference García-Mayoral and Jiménez2011) and Abderrahaman-Elena & García-Mayoral (Reference Abderrahaman-Elena and García-Mayoral2017). For streamwise-preferential, highly connected substrates, we proposed an empirically fitted parameter to capture the effect of the substrate topology on the amplification of the instability,
 $$\begin{eqnarray}K_{Br}^{+}=K_{y}^{+}\tanh \left(\frac{\sqrt{2K_{x}^{+}}}{9}\right)\tanh ^{2}\left(\frac{h^{+}}{\sqrt{12K_{y}^{+}}}\right).\end{eqnarray}$$
Figure 5 shows how the maximum amplification for different substrates,
 $\unicode[STIX]{x1D714}_{i,max}$
, is essentially a function of
 $K_{Br}^{+}$
only. In the cases of interest, sufficiently deep substrates with
 $h^{+}\gtrsim \sqrt{K_{x}^{+}}\gg \sqrt{K_{y}^{+}}$
and
 $\sqrt{K_{x}^{+}}\gtrsim 5$
, we have
 $$\begin{eqnarray}K_{Br}^{+}\approx K_{y}^{+}.\end{eqnarray}$$
Hence, the amplification of the instability is mainly determined by
 $K_{y}^{+}$
, and
 $h^{+}$
and
 $K_{x}^{+}$
have only a secondary effect.
Depending on the value of
 $K_{Br}^{+}$
, we distinguish three regimes for the instability, as shown in figure 5: a low-permeability regime,
 $\sqrt{K_{Br}^{+}}\lesssim 1$
, where the instability would be weak and not expected to emerge in the flow; a high-permeability regime,
 $\sqrt{K_{Br}^{+}}\gtrsim 2.2$
, where the amplification approaches an asymptote and the instability would be fully developed; and an intermediate regime, where the instability would set in. García-Mayoral & Jiménez (Reference García-Mayoral and Jiménez2011) found that, for riblets, the instability sets in for amplifications of approximately half the maximum. Following this, we hypothesised that the intermediate regime would occur for
 $\sqrt{K_{y}^{+}}\approx \sqrt{K_{Br}^{+}}\approx 1{-}2.2$
, so the linear drag reduction of (3.5) could only hold for lower values of
 $\sqrt{K_{y}^{+}}$
. This hypothesis will be re-assessed based on the present DNS results in § 5.4.
Maximum amplification,
 $\unicode[STIX]{x1D714}_{i,max}^{+}$
, versus the permeability length scale
 $\sqrt{K_{Br}^{+}}$
for different permeable substrates. – – –,
 $h^{+}=10$
; ——,
 $h^{+}=100$
; from blue to red, anisotropy ratios increase as
 $\unicode[STIX]{x1D719}_{xy}=\sqrt{K_{x}/K_{y}}\approx 1$
,
 $3$
,
 $10$
,
 $30$
. The shaded region corresponds to the estimated range for the onset of Kelvin–Helmholtz rollers (K–H), with the dashed-dotted lines corresponding to
 $\sqrt{K_{Br}^{+}}\approx 1$
and
 $2.2$
.

3.4 Theoretical prediction of drag-reducing curves
Combining the information on the linear drag-reduction regime of (3.5) and the range of
 $\sqrt{K_{y}^{+}}$
for the onset of Kelvin–Helmholtz rollers, the trend of the drag-reduction curves for anisotropic permeable substrates can be estimated (Abderrahaman-Elena & García-Mayoral Reference Abderrahaman-Elena and García-Mayoral2017; Gómez-de-Segura et al.
Reference Gómez-de-Segura, Sharma and García-Mayoral2018b
). An optimal substrate should seek to maximise the difference
 $\sqrt{K_{x}^{+}}-\sqrt{K_{z}^{+}}$
to obtain a large slip effect, while maintaining
 $\sqrt{K_{y}^{+}}$
as low as possible to inhibit the appearance of Kelvin–Helmholtz rollers. Fibrous substrates as those proposed in figure 2(b), for instance, would conform such a material.
A substrate configuration can be represented by three dimensionless parameters; the anisotropy ratios
 $\unicode[STIX]{x1D719}_{xy}=\sqrt{K_{x}/K_{y}}$
and
 $\unicode[STIX]{x1D719}_{zy}=\sqrt{K_{z}/K_{y}}$
, and the dimensionless thickness,
 $h/\sqrt{K_{y}}$
. Given that both
 $K_{y}^{+}$
and
 $K_{z}^{+}$
have an adverse effect on the drag, in what follows we consider materials with preferential permeability in
 $x$
and equally low permeabilities in
 $y$
and
 $z$
,
 $K_{x}^{+}>K_{z}^{+}=K_{y}^{+}$
. This implies
 $\unicode[STIX]{x1D719}_{xy}>1$
and
 $\unicode[STIX]{x1D719}_{zy}=1$
. In addition, we consider deep substrates with large
 $h/\sqrt{K_{y}}$
, so that the substrate thickness does not affect the overlying flow. In § 5, we study substrates with
 $\sqrt{K_{x}^{+}}\lesssim 10$
, for which a thickness
 $h^{+}\gtrsim 50$
would suffice. In practical aeronautic applications, for instance, this would imply permeable layers with sub-millimetre thickness.
(a) Sketch of the predicted
 $\unicode[STIX]{x0394}U^{+}$
as a function of
 $\sqrt{K_{y}^{+}}$
. Each line corresponds to a substrate with a different anisotropy ratio,
 $\unicode[STIX]{x1D719}_{xy}=\sqrt{K_{x}^{+}/K_{y}^{+}}$
, and follows the behaviour of the linear expression (3.8). The shaded region corresponds to the permeability values for which the Kelvin–Helmholtz rollers would be expected to develop, as in figure 5. (b) Predicted values of
 $\unicode[STIX]{x0394}U^{+}$
using the linear expression (3.8) as a function of the anisotropy ratio
 $\unicode[STIX]{x1D719}_{xy}$
. In both panels, the dashed-green and solid-red lines define the limits for the onset of Kelvin–Helmholtz rollers estimated at
 $\sqrt{K_{Br}^{+}}|_{lim}\approx \sqrt{K_{y}^{+}}\approx 1$
and
 $2.2$
, and they separate three regions: the empty-coloured one, where no Kelvin–Helmholtz instability would be expected; the shaded one, where the instability would set in; and the hatched one, where the instability would be fully developed. Symbols represent the DNS cases studied in § 5 for three substrates with different anisotropies, from red to blue
 $\unicode[STIX]{x1D719}_{xy}\approx 3.6$
,
 $5.5$
and
 $11$
.

For substrates with
 $\unicode[STIX]{x1D719}_{zy}=1$
, the expression for
 $\unicode[STIX]{x0394}U^{+}$
in (3.5) can be rewritten as
 $$\begin{eqnarray}\unicode[STIX]{x0394}U^{+}=(\unicode[STIX]{x1D719}_{xy}-1)\sqrt{K_{y}^{+}}.\end{eqnarray}$$
The drag reduction for a given substrate configuration (i.e. for a fixed
 $\unicode[STIX]{x1D719}_{xy}$
) can then be expressed solely as a function of the wall-normal permeability length scale,
 $\sqrt{K_{y}^{+}}$
, which can be interpreted as a substrate Reynolds number, as sketched in figure 6(a). In a wind-tunnel experiment, for instance,
 $\sqrt{K_{y}^{+}}$
could be changed by changing the friction velocity, while
 $\unicode[STIX]{x1D719}_{xy}$
remained unaltered. From the present analysis, the resulting drag-reduction curves would be analogous to those for riblets (Bechert et al.
Reference Bechert, Bruse, Hage, Van der Hoeven and Hoppe1997; García-Mayoral & Jiménez Reference García-Mayoral and Jiménez2011). The curves would exhibit a linear increase of
 $\unicode[STIX]{x0394}U^{+}$
with
 $\sqrt{K_{y}^{+}}$
, breaking down no later than in the shaded region in the figure, where the onset of the Kelvin–Helmholtz instability would be expected. According to (3.8), the slope in the linear regime would depend on
 $\unicode[STIX]{x1D719}_{xy}$
, and the maximum
 $\unicode[STIX]{x0394}U^{+}$
for a given
 $\unicode[STIX]{x1D719}_{xy}$
would be determined by the intercept of the corresponding curve with the shaded region. The exact value of
 $\sqrt{K_{y}^{+}}$
for the breakdown, as well as the form of the curves in its proximity and for larger permeabilities, will be obtained from DNSs in § 5.
The ideas illustrated in figure 6(a) for a handful of substrate configurations can be summarised for a wide range of anisotropy ratios, as is done in figure 6(b). Following a drag-reduction curve as
 $\sqrt{K_{y}^{+}}$
increases in figure 6(a) would be equivalent to ascending vertically along a constant-
 $\unicode[STIX]{x1D719}_{xy}$
line in figure 6(b). The linear drag-reducing behaviour of (3.8) is expected to begin to fail in the shaded region, determined by introducing the limiting values of
 $\sqrt{K_{y}^{+}}$
from § 3.3,
 $\sqrt{K_{y}^{+}}|_{lim}\approx 1{-}2.2$
, into (3.8). Although additional adverse phenomena cannot be ruled out, figure 6(b) allows us to bound the parameter space for realisable drag reduction. This figure has been used to select the region in the parametric space subsequently investigated in § 5. We have considered three substrate configurations,
 $\unicode[STIX]{x1D719}_{xy}\approx 3.6$
,
 $5.5$
and
 $11.4$
, represented by the three vertical lines of symbols in figure 6(b), and simulated them at different substrate Reynolds numbers,
 $\sqrt{K_{y}^{+}}$
, so that complete drag reduction curves could be obtained. Most cases were designed to lie in the drag-reducing region, where (3.8) would be expected to hold, with a few lying in the degraded region.
3.5 Change in drag in internal and external flows
The expressions for
 $\unicode[STIX]{x0394}U^{+}$
of (3.3), (3.5) and (3.8) are valid only for external flows with mild or zero pressure gradients, where the flow near the wall is essentially driven by the overlying shear and the effect of the mean pressure gradient within the permeable substrate is negligible. We are mainly interested in vehicular applications, where the flow falls into that category, but for completion let us discuss the differences with internal flows. In the latter, the effect of the mean pressure gradient could be significant. This effect is essentially additive, so in the following discussion we will leave out turbulence for simplicity, and consider the laminar case. A similar analysis was proposed by Battiato (Reference Battiato2014).
Sketches of the mean velocity profiles in a boundary layer and in a channel are depicted in figures 7(a) and 7(b), respectively. In a boundary layer over a permeable substrate, there would be a slip velocity at the interface,
 $U_{Br}$
, due solely to the formation of a Brinkman layer within the substrate. It follows from (3.4) that, provided that the substrate is sufficiently deep, this slip velocity is
 $U_{Br}^{+}\approx \sqrt{K_{x}^{+}}$
. Compared with a smooth wall, the only change in the mean velocity profile would be a shift by
 $U_{Br}$
, that is,
 $\unicode[STIX]{x0394}U^{+}\approx \sqrt{K_{x}^{+}}$
, and the drag reduction experienced would arise entirely from this slip effect.
Mean velocity in internal and external flows. The black-dashed line represents the mean velocity profiles for smooth walls. (a) Boundary layer. (b) Channel flow, where the mean pressure gradient is applied through the whole section of height
 $2(\unicode[STIX]{x1D6FF}+h)$
, including the permeable substrates. (c) Artificial internal set-up to produce only slip that appears in an external flow, by not applying the mean pressure gradient in the substrate regions.

In channel flows, there are two limiting forms of applying the permeable substrates to the reference smooth channel of height
 $2\unicode[STIX]{x1D6FF}$
. They can substitute a layer of solid material, increasing the height to
 $2(\unicode[STIX]{x1D6FF}+h)$
, or they can be placed on top of the reference smooth channel, reducing the free-flow area. In the first case, depicted in figure 7(b), the mean pressure gradient acts on the region
 $2(\unicode[STIX]{x1D6FF}+h)$
, which includes the permeable substrates. This produces two opposite effects on the drag: a positive effect due to an increment in the flow rate, not only within the substrate but also in the channel core, and a negative effect due to the pressure gradient being applied across a larger cross-section. In order to evaluate these two effects, we compare the friction coefficient for the permeable and the smooth channel under equal mean pressure gradient
 $P_{x}$
. The integral force balance yields
 $$\begin{eqnarray}\unicode[STIX]{x1D70F}_{w}=-P_{x}(\unicode[STIX]{x1D6FF}+h),\end{eqnarray}$$
where
 $\unicode[STIX]{x1D70F}_{w}$
accounts for the net force applied on the substrates. As we are now solely considering internal flows, we use the conventional bulk velocity,
 $U_{b}$
, to define
 $c_{f}$
,
 $$\begin{eqnarray}c_{f}=2\frac{\unicode[STIX]{x1D70F}_{w}}{U_{b}^{2}}=2\frac{\unicode[STIX]{x1D70F}_{w}}{(U_{b0}+\unicode[STIX]{x0394}U_{b})^{2}}=c_{f0}\frac{1+h/\unicode[STIX]{x1D6FF}}{(1+\unicode[STIX]{x0394}U_{b}/U_{b0})^{2}}=c_{f0}\frac{(1+h/\unicode[STIX]{x1D6FF})^{3}}{(1+\unicode[STIX]{x0394}q/q_{0})^{2}},\end{eqnarray}$$
where the subscript ‘0’ refers to the smooth channel. The friction coefficient of the smooth channel is defined as
 $c_{f0}=-2P_{x}\unicode[STIX]{x1D6FF}/U_{b0}$
, and
 $q=2(\unicode[STIX]{x1D6FF}+h)U_{b}$
is the mass flow rate. The opposing effects of the increase in cross-section where the pressure gradient acts,
 $2h$
, and the extra flow rate,
 $\unicode[STIX]{x0394}q$
, are evidenced in (3.10). The result can be either a drag reduction or a drag increase depending on the values of
 $\unicode[STIX]{x0394}q$
and
 $h$
. A similar conclusion was obtained by Battiato (Reference Battiato2014), although the friction coefficient was defined based on the tangential shear at the interface
 $y=0$
(or alternatively on the pressure gradient acting only in the channel core
 $y\in [0,2\unicode[STIX]{x1D6FF}]$
), and the bulk velocity considered was that of the whole domain, including the substrates.
The extra flow rate,
 $\unicode[STIX]{x0394}q$
, can be expressed in terms of
 $K_{x}$
. From figure 7(b),
 $\unicode[STIX]{x0394}q$
is
 $$\begin{eqnarray}\unicode[STIX]{x0394}q\approx 2\unicode[STIX]{x1D6FF}(U_{Br}+U_{Darcy})+2q_{substrate},\end{eqnarray}$$
where, in addition to the slip velocity caused by the overlying shear,
 $U_{Br}$
, as in figure 7(a), there is an extra slip velocity caused by the mean pressure gradient,
 $U_{Darcy}$
, and a resulting extra flow rate within the substrate,
 $q_{substrate}$
. The former is obtained from Darcy’s law,
 $U_{Darcy}=-P_{x}K_{x}/\unicode[STIX]{x1D708}$
, and
 $q_{substrate}$
is obtained using
 $U_{Darcy}$
and Brinkman’s velocity within the substrate, as defined by expression (A 29a
). Substituting expression (3.11) into (3.10), the resulting change in
 $c_{f}$
depends on
 $\sqrt{K_{x}}/h$
,
 $h/\unicode[STIX]{x1D6FF}$
and the Reynolds number. This dependency for a friction Reynolds number
 $\unicode[STIX]{x1D6FF}^{+}=180$
is illustrated in figure 8. The figure shows how the beneficial effect of adding a streamwise permeability is opposite to the deleterious effect of the increased area and, for certain substrate geometries, can even outweigh it, resulting in a net drag reduction. Note that in the turbulent case, the effect of the spanwise, Brinkman contribution would also need to be included, as given by (3.5).
Map of
 $DR=-\unicode[STIX]{x0394}c_{f}/c_{f0}$
in an internal channel flow with permeable substrates as a function of the permeability length,
 $\sqrt{K_{x}}$
, and the thickness of the substrate,
 $h$
, for a friction Reynolds number
 $\unicode[STIX]{x1D6FF}^{+}=180$
. The channel with substrates has a total height of
 $2(h+\unicode[STIX]{x1D6FF})$
, and is compared to a smooth channel of height
 $2\unicode[STIX]{x1D6FF}$
, as in figure 7(b). – – –, the first-order approximation of zero drag-reduction line, with a slope of
 $0.15$
obtained from (3.12) (valid for
 $h/\unicode[STIX]{x1D6FF}>0.01$
).

To better understand the relationship between
 $K_{x}$
and
 $h$
, expression (3.10) can be simplified further for
 $\unicode[STIX]{x1D6FF}\gg h\gtrsim \sqrt{K_{x}}$
. The extra flow rate is then dominated by
 $\unicode[STIX]{x0394}q\approx 2\unicode[STIX]{x1D6FF}U_{Br}\approx 2\unicode[STIX]{x1D6FF}\sqrt{K_{x}}\left.\text{d}U/\text{d}y\right|_{y=0}$
, and in a first-order approximation, equation (3.10) simplifies to
 $$\begin{eqnarray}c_{f}\approx c_{f0}\frac{1+3h/\unicode[STIX]{x1D6FF}}{1+{\displaystyle \frac{2\sqrt{K_{x}}}{U_{b0}}}\left.{\displaystyle \frac{\text{d}U}{\text{d}y}}\right|_{y=0}}.\end{eqnarray}$$
It follows from this equation that, in
 $(h,\sqrt{K_{x}})$
parameter space, the isocontours of
 $DR$
are approximately oblique straight lines, as observed in figure 8. Specifically, the neutral drag curve is
 $\sqrt{K_{x}}=3/2\,U_{b0}/(\text{d}U/\text{d}y|_{y=0})\,h$
, which depends on the friction Reynolds number through
 $U_{b0}$
and
 $\text{d}U/\text{d}y|_{y=0}$
. For
 $\unicode[STIX]{x1D6FF}^{+}=180$
, the zero drag-reduction line is given by
 $\sqrt{K_{x}}\approx 0.15h$
, as indicated in figure 8, while for
 $\unicode[STIX]{x1D6FF}^{+}=5000$
,
 $\sqrt{K_{x}}\approx 0.007h$
. Battiato (Reference Battiato2014), considering also the pressure gradient effect discussed in this section, concluded that a given substrate configuration would achieve drag reduction at sufficiently high friction Reynolds number, which is also how (3.12) can be interpreted. Nevertheless, as mentioned before, the definition of the friction coefficient in Battiato (Reference Battiato2014) was based on the tangential shear at the substrate–channel interface, while the present one is based on the net, total drag, that is, accounting for the pressure loss across the whole section
 $2(\unicode[STIX]{x1D6FF}+h)$
. The agreement can therefore only be established qualitatively.
The above analysis applies to channel flows where the permeable substrates substitute a layer of solid material and shows that, in this case, drag can be either reduced or increased. If, on the other hand, the permeable coating was added on top of an existing smooth channel, the pressure gradient would still be applied over the whole height of
 $2\unicode[STIX]{x1D6FF}$
, which includes the permeable coatings, and the resulting friction coefficient would be
 $c_{f}=c_{f0}/(1+\unicode[STIX]{x0394}q/q_{0})^{2}$
. In this case, the flow rate would always decrease, i.e.
 $\unicode[STIX]{x0394}q<0$
, resulting in an increase of drag independently of the values of
 $\sqrt{K_{x}}$
and
 $h$
.
4 DNS set-up
In this section, we present the numerical set-up for direct numerical simulations of the domain sketched in figure 7(c), a channel of height
 $2\unicode[STIX]{x1D6FF}$
delimited by two identical anisotropic permeable substrates. The presence of the substrates is taken into account through the modelled boundary conditions defined by (2.3).
4.1 The numerical method
The channel flow is governed by the incompressible Navier–Stokes equations,
 $$\begin{eqnarray}\displaystyle & \displaystyle \unicode[STIX]{x1D735}\boldsymbol{\cdot }\boldsymbol{u}=0, & \displaystyle\end{eqnarray}$$
 $$\begin{eqnarray}\displaystyle & \displaystyle \frac{\unicode[STIX]{x2202}\boldsymbol{u}}{\unicode[STIX]{x2202}t}+\boldsymbol{u}\boldsymbol{\cdot }\unicode[STIX]{x1D735}\boldsymbol{u}=-\unicode[STIX]{x1D735}p+\frac{1}{Re}\unicode[STIX]{x1D6FB}^{2}\boldsymbol{u}, & \displaystyle\end{eqnarray}$$
 $p$
is the pressure,
 $\boldsymbol{u}=(u,v,w)$
the velocity vector and
 $Re$
the bulk Reynolds number defined as
 $Re=U_{b}\unicode[STIX]{x1D6FF}/\unicode[STIX]{x1D708}$
, with
 $U_{b}$
being the bulk velocity in the channel region. The DNS code is adapted from García-Mayoral & Jiménez (Reference García-Mayoral and Jiménez2011) and Fairhall & García-Mayoral (Reference Fairhall and García-Mayoral2018) and was already used in Gómez-de-Segura et al. (Reference Gómez-de-Segura, Sharma and García-Mayoral2018b
). It solves the incompressible Navier–Stokes equations (4.1) in a doubly periodic channel of height
 $2\unicode[STIX]{x1D6FF}$
, where
 $\unicode[STIX]{x1D6FF}=1$
is the distance between the substrate–channel interface and the centre of the channel. All simulations are conducted at a fixed friction Reynolds number
 $\unicode[STIX]{x1D6FF}^{+}=u_{\unicode[STIX]{x1D70F}}\unicode[STIX]{x1D6FF}/\unicode[STIX]{x1D708}=180$
by imposing a constant mean pressure gradient in
 $y\in [0,2\unicode[STIX]{x1D6FF}]$
. The kinematic viscosity is
 $\unicode[STIX]{x1D708}=1/2870$
and we use a smooth-wall channel with the same mean pressure gradient as reference.
Although for convenience the present DNSs are conducted in channels, our scope of application is mainly external flows with mild pressure gradients. In a channel, in comparison, there would be an additional flow rate from Darcy’s contribution discussed in § 3.5. To allow direct extrapolation to external flows, we simply do not include this contribution when implementing the boundary conditions on the mean flow, that is, mode
 $(0,0)$
, which would be the only Fourier mode affected. This numerical artefact would be equivalent to applying the mean pressure gradient in the channel region only, as depicted in figure 7(c). The drag reduction in the present simulations results then entirely from the slip velocity due to an overlying shear, as in external flows.
The spatial discretisation is spectral in the wall-parallel directions
 $x$
and
 $z$
, with
 $2/3$
rule de-aliasing, and uses second-order centred finite differences on a staggered grid in the wall-normal direction. The computational domain is of size
 $2\unicode[STIX]{x03C0}\times \unicode[STIX]{x03C0}\times 2$
in the streamwise, spanwise and wall-normal directions, respectively, which is sufficient to capture the active turbulent length scales up to the logarithmic region (Lozano-Durán & Jiménez Reference Lozano-Durán and Jiménez2014). Spanwise-elongated structures, such as those reported in § 5, appear in this domain as spanwise homogeneous, but their dynamics is correctly captured (García-Mayoral & Jiménez Reference García-Mayoral and Jiménez2012). A grid with
 $192\times 192\times 153$
collocation points with grid stretching is used, which in viscous units gives a resolution of
 $\unicode[STIX]{x0394}x^{+}\approx 5.9$
,
 $\unicode[STIX]{x0394}z^{+}\approx 2.9$
and
 $\unicode[STIX]{x0394}y^{+}\simeq 0.3$
near the wall and
 $\unicode[STIX]{x0394}y^{+}\simeq 3$
in the centre of the channel. For the temporal integration, a Runge–Kutta discretisation is used, where every time step is divided into three substeps, each of which uses a semi-implicit scheme for the viscous terms and an explicit scheme for the advective terms. Discretised this way, the Navier–Stokes equations in (4.1) result in
 $$\begin{eqnarray}\displaystyle \left[I-\unicode[STIX]{x0394}t\frac{\unicode[STIX]{x1D6FD}_{k}}{Re}\text{L}\right]\boldsymbol{u}^{k} & = & \displaystyle \boldsymbol{u}^{k-1}+\unicode[STIX]{x0394}t\left[\frac{\unicode[STIX]{x1D6FC}_{k}}{Re}\text{L}(\boldsymbol{u}^{k-1})-\unicode[STIX]{x1D6FE}_{k}\text{N}(\boldsymbol{u}^{k-1})\right.\nonumber\\ \displaystyle & & \displaystyle \left.-\,\unicode[STIX]{x1D701}_{k}\text{N}(\boldsymbol{u}^{k-2})-\left(\unicode[STIX]{x1D6FC}_{k}+\unicode[STIX]{x1D6FD}_{k}\right)\text{G}(p^{k})\vphantom{\frac{\unicode[STIX]{x1D6FC}_{k}}{Re}}\right],\end{eqnarray}$$
where
 $\text{L}$
,
 $\text{G}$
and
 $\text{D}$
represent the discretised Laplacian, gradient and divergence operators, respectively, and
 $\text{N}$
represents the nonlinear, advective operator. The superscript
 $k=1,2,3$
denotes the Runge–Kutta substep. Hence, the velocities
 $\boldsymbol{u}^{0}$
and
 $\boldsymbol{u}^{3}$
correspond to the velocities at time steps
 $n$
and
 $n+1$
, respectively. Additionally,
 $\unicode[STIX]{x1D6FC}_{k}$
,
 $\unicode[STIX]{x1D6FD}_{k}$
,
 $\unicode[STIX]{x1D6FE}_{k}$
and
 $\unicode[STIX]{x1D701}_{k}$
are the Runge–Kutta coefficients for substep
 $k$
from Le & Moin (Reference Le and Moin1991). In (4.2), the velocity at substep
 $k$
is expressed in terms of the velocities at the previous substeps, as well as the pressure at that same substep
 $k$
. To solve it, a fractional step method is integrated in each substep (Le & Moin Reference Le and Moin1991).
The presence of the permeable substrates is accounted for by the boundary conditions (2.3), and the coupling between the velocities and the pressure at the interface is implemented implicitly. Following Perot (Reference Perot1993, Reference Perot1995), the discretised incompressible Navier–Stokes equations from (4.2) can be represented in matrix form,
 $$\begin{eqnarray}\left[\begin{array}{@{}cc@{}}\unicode[STIX]{x1D63C} & \unicode[STIX]{x1D642}\\ \displaystyle \unicode[STIX]{x1D63F} & \unicode[STIX]{x1D7EC}\\ \end{array}\right]\left(\begin{array}{@{}c@{}}\boldsymbol{u}^{k}\\ \displaystyle p^{k}\\ \end{array}\right)=\left(\begin{array}{@{}c@{}}\boldsymbol{r}^{k-1}\\ \displaystyle 0\\ \end{array}\right),\end{eqnarray}$$
where
 $\boldsymbol{u}^{k}$
and
 $p^{k}$
are the discrete velocity and pressure unknowns, respectively;
 $\unicode[STIX]{x1D63C}$
is the operator containing the implicit part of the diffusive terms, which for the internal points of the domain equation (4.2) gives
 $\unicode[STIX]{x1D63C}=[\unicode[STIX]{x1D644}-\unicode[STIX]{x0394}t(\unicode[STIX]{x1D6FD}_{k}/\text{Re})\unicode[STIX]{x1D647}]$
, and the vector
 $\boldsymbol{r}^{k-1}$
is the explicit right-hand side, which contains all the quantities from previous time steps. The boundary conditions given by (2.3) are embedded in the block matrices in (4.3). Because the velocities and pressure are coupled, the matrices have critical differences with those of Perot (Reference Perot1993). The relationships between the three velocities and the shears,
 $\text{d}\hat{u} /\text{d}y$
and
 $\text{d}{\hat{w}}/\text{d}y$
, are embedded in
 $\unicode[STIX]{x1D63C}$
, while the coupling between the velocities and pressure is embedded in
 $\unicode[STIX]{x1D63C}$
and
 $\unicode[STIX]{x1D642}$
. Details on how this differs from the conventional fractional-step method are given in appendix C and in Gómez-de Segura (Reference Gómez-de Segura2019).
Taking the lower–upper decomposition of system (4.3) results in
 $$\begin{eqnarray}\left[\begin{array}{@{}cc@{}}\unicode[STIX]{x1D63C} & \unicode[STIX]{x1D7EC}\\ \displaystyle \unicode[STIX]{x1D63F} & -\unicode[STIX]{x1D63F}\unicode[STIX]{x1D63C}^{-1}\unicode[STIX]{x1D642}\\ \end{array}\right]\left[\begin{array}{@{}cc@{}}\unicode[STIX]{x1D644} & \unicode[STIX]{x1D63C}^{-1}\unicode[STIX]{x1D642}\\ \displaystyle \unicode[STIX]{x1D7EC} & \unicode[STIX]{x1D644}\\ \end{array}\right]\left(\begin{array}{@{}c@{}}\boldsymbol{u}^{k}\\ \displaystyle p^{k}\\ \end{array}\right)=\left(\begin{array}{@{}c@{}}\boldsymbol{r}^{k-1}\\ \displaystyle 0\\ \end{array}\right)\end{eqnarray}$$
and the operations are solved in the following order
 $$\begin{eqnarray}\displaystyle & \displaystyle \unicode[STIX]{x1D63C}\boldsymbol{u}^{\ast }=\boldsymbol{r}^{k-1}, & \displaystyle\end{eqnarray}$$
 $$\begin{eqnarray}\displaystyle & \displaystyle \unicode[STIX]{x1D63F}\unicode[STIX]{x1D63C}^{-1}\unicode[STIX]{x1D642}p^{k}=\unicode[STIX]{x1D63F}\boldsymbol{u}^{\ast }, & \displaystyle\end{eqnarray}$$
 $$\begin{eqnarray}\displaystyle & \displaystyle \boldsymbol{u}^{k}=\boldsymbol{u}^{\ast }-\unicode[STIX]{x1D63C}^{-1}\unicode[STIX]{x1D642}p^{k}, & \displaystyle\end{eqnarray}$$
 $\boldsymbol{u}^{\ast }$
is an intermediate, non-solenoidal velocity. The Poisson equation (4.5b
) is computationally expensive, as it requires the inversion of matrix
 $\unicode[STIX]{x1D63C}$
. For efficiency,
 $\unicode[STIX]{x1D63C}^{-1}$
is generally approximated to its first-order term,
 ${\approx}\unicode[STIX]{x1D644}$
(Perot Reference Perot1993). In the present work, we approximate the internal points in
 $\unicode[STIX]{x1D63C}$
by
 ${\approx}\unicode[STIX]{x1D644}$
, while keeping the rows of
 $\unicode[STIX]{x1D63C}$
that contain the boundary conditions unchanged, and then invert the resulting matrix to obtain
 $\unicode[STIX]{x1D63C}^{-1}$
.
Statistics are obtained by averaging over approximately
 $100$
eddy turnovers, once the statistically steady state has been reached. Statistical convergence was verified using the criterion of Hoyas & Jiménez (Reference Hoyas and Jiménez2008).
4.2 Validation
We validate the present Brinkman model with one of the cases studied by Breugem et al. (Reference Breugem, Boersma and Uittenbogaard2006), where the authors used the VANS equations within the permeable substrate. We consider their case E80, here referred to as BB_E80, with a porosity
 $\unicode[STIX]{x1D716}=0.8$
, which refers to the ratio between the void volume and the total volume of the substrate, and an isotropic permeability
 $K^{+}\approx 1$
. This permeability is of the same order of magnitude as our largest permeabilities
 $K_{y}^{+}$
and
 $K_{z}^{+}$
in the DNSs presented in § 5. The results of BB_E80 are compared to a simulation using our Brinkman model, here referred to as BB_Br, also with
 $K^{+}\approx 1$
. To match the validation domain in Breugem et al. (Reference Breugem, Boersma and Uittenbogaard2006), we use an asymmetric channel of height
 $2\unicode[STIX]{x1D6FF}$
, delimited by an impermeable wall at the top and a permeable substrate at the bottom, as sketched in figure 9. The thickness of the permeable layer is
 $h=2\unicode[STIX]{x1D6FF}$
.
Sketch of the channel of Breugem et al. (Reference Breugem, Boersma and Uittenbogaard2006) used here for validation. The red dashed-dotted line corresponds to the location of the interface plane used in the present analysis for comparison with the analogous Brinkman model, BB_Br.

Characteristics of the simulations for VANS approach (BB_E80) and Brinkman’s (BB_Br). Porosity,
 $\unicode[STIX]{x1D716}$
; viscosity ratio
 $\tilde{\unicode[STIX]{x1D708}}/\unicode[STIX]{x1D708}$
; friction Reynolds number,
 $\unicode[STIX]{x1D6FF}^{+}=u_{\unicode[STIX]{x1D70F}}\unicode[STIX]{x1D6FF}/\unicode[STIX]{x1D708}$
; permeability,
 $K^{+}=Ku_{\unicode[STIX]{x1D70F}}^{2}/\unicode[STIX]{x1D708}^{2}$
; location of zero total stress,
 $\unicode[STIX]{x1D6FF}_{w}$
; thickness of the interfacial region,
 $\unicode[STIX]{x1D6FF}_{i}$
; friction coefficient,
 $c_{f}=2(u_{\unicode[STIX]{x1D70F}}/U_{b})^{2}$
; friction coefficient of the corresponding smooth channel,
 $c_{f_{0}}$
; and change of drag defined as
 $\unicode[STIX]{x0394}D=(c_{f}-c_{f_{0}})/c_{f_{0}}$
. Viscous units are defined with
 $u_{\unicode[STIX]{x1D70F}}$
measured at the interface plane
 $y=0$
.

In the VANS simulation of Breugem et al. (Reference Breugem, Boersma and Uittenbogaard2006), the porosity, and hence the permeability, evolved gradually from the inner value
 $\unicode[STIX]{x1D716}=0.8$
to the free-flow value
 $\unicode[STIX]{x1D716}=1$
over a thin interfacial layer of thickness
 $\unicode[STIX]{x1D6FF}_{i}$
. This corresponded to the averaging volumes in VANS capturing varying proportions of free flow and substrate, so that the volumes centred at the top of the interfacial layer did not contain any substrate, and the volumes centred at its bottom did not contain any free flow, as illustrated in figure 9. This can be interpreted as VANS being applied on a set-up with a sharp interface half-way through the interfacial layer. We therefore set our reference plane
 $y=0$
for BB_E80 at this height, so results from Breugem et al. (Reference Breugem, Boersma and Uittenbogaard2006) are represented in the same frame of reference as those for our Brinkman model. Note that in Breugem et al. (Reference Breugem, Boersma and Uittenbogaard2006) the reference plane was at the top of the interfacial region instead. For a consistent comparison, the results from Breugem et al. (Reference Breugem, Boersma and Uittenbogaard2006) have been rescaled with the friction velocity measured at the present reference
 $y=0$
, and with the bulk velocity integrated between that plane and the top, impermeable smooth wall.
Both BB_Br and the original simulation of Breugem et al. (Reference Breugem, Boersma and Uittenbogaard2006) were run at a constant mass flow rate starting from a smooth channel, at
 $Re=2750$
in the latter case and
 $Re=2832$
in ours. Defining viscous units using the friction velocity at
 $y=0$
, the initial friction Reynolds numbers were
 $\unicode[STIX]{x1D6FF}^{+}=176$
and
 $\unicode[STIX]{x1D6FF}^{+}=180$
, respectively, while in the final statistically steady state they were
 $\unicode[STIX]{x1D6FF}^{+}\approx 204$
and
 $\unicode[STIX]{x1D6FF}^{+}\approx 203$
, respectively. Results from Breugem & Boersma’s VANS approach (BB_E80) and Brinkman’s model under study (BB_Br) are compared in table 1 and figure 10, all showing good agreement.
Comparison of a simulation from Breugem et al. (Reference Breugem, Boersma and Uittenbogaard2006) using VANS (BB_E80), – – –, with a corresponding simulation using Brinkman’s model (BB_Br), ——. The curves from Breugem et al. (Reference Breugem, Boersma and Uittenbogaard2006) are shifted by
 $\unicode[STIX]{x1D6FF}_{i}/2$
to match the substrate–channel interface in both set-ups. Black lines represent smooth-channel data for reference. (a) Mean velocity profile, (b) root mean square velocity fluctuations, (c) Reynolds stress.

This agreement between VANS and Brinkman’s approach could be expected, given the similarities between the models for the values of the parameters considered. VANS equations can be interpreted as Brinkman’s equation with the addition of the advective and temporal terms, with
 $\unicode[STIX]{x1D716}$
playing in the former the role that
 $\unicode[STIX]{x1D708}/\tilde{\unicode[STIX]{x1D708}}$
plays in the latter. For small permeabilities, such as those under consideration, the advective terms can be neglected. In addition, an order of magnitude analysis shows that the temporal term can also be neglected. This term is of the order
 ${\sim}O[u_{c}/t_{c}]$
, where
 $t_{c}$
and
 $u_{c}$
denote a characteristic time and velocity, respectively. When the substrate is isotropic and highly connected (i.e.
 $\tilde{\unicode[STIX]{x1D708}}\approx \unicode[STIX]{x1D708}$
), both the Brinkman and Darcy terms are of the same order of magnitude, as the penetration length in an isotropic substrate is of order
 ${\sim}\sqrt{K}$
. Comparing the temporal and the Brinkman terms, we obtain
 $$\begin{eqnarray}\frac{u_{c}/t_{c}}{\unicode[STIX]{x1D708}u_{c}/K}\sim \frac{K}{\unicode[STIX]{x1D708}t_{c}}=\frac{K^{+}}{t_{c}^{+}}.\end{eqnarray}$$
For the temporal term to be negligible, the characteristic time should satisfy
 $t_{c}^{+}>K^{+}$
. Considering that the fastest-evolving turbulent structures near the wall are typically the quasi-streamwise vortices, with a radius
 $r^{+}\sim 15$
and turnover velocity
 ${\sim}u_{\unicode[STIX]{x1D70F}}$
, the smallest characteristic time scale would be
 $t_{c}^{+}\sim 15$
, and given that
 $K^{+}\sim 1$
, the condition
 $t_{c}^{+}>K^{+}$
is satisfied. The flow within the permeable medium can then be assumed to be quasi-steady. Additionally, for VANS and Brinkman’s equation to be equivalent, the value of the porosity
 $\unicode[STIX]{x1D716}$
should be equal to the ratio
 $\unicode[STIX]{x1D708}/\tilde{\unicode[STIX]{x1D708}}$
. In the simulations compared here, these values differ slightly, with
 $\unicode[STIX]{x1D716}=0.8$
in BB_E80 and
 $\unicode[STIX]{x1D708}/\tilde{\unicode[STIX]{x1D708}}=1$
in our model. Nonetheless, Rosti et al. (Reference Rosti, Cortelezzi and Quadrio2015) reported that, for porosity values
 $\unicode[STIX]{x1D716}\gtrsim 0.6$
, a further increase of
 $\unicode[STIX]{x1D716}$
had no significant effect on the overlying flow, and the permeability
 $K$
was the only relevant parameter. This justifies the similarities between the results of the two models, even if the values of
 $\unicode[STIX]{x1D716}$
and
 $\unicode[STIX]{x1D708}/\tilde{\unicode[STIX]{x1D708}}$
are slightly different.
5 DNS results and discussion
In this section, we present the results from our simulations to investigate in detail the effect that permeable substrates have on the overlying flow and assess the validity of the predictions presented in § 3. We study three substrate configurations, given by three different anisotropy ratios
 $\unicode[STIX]{x1D719}_{xy}\approx 3.6$
,
 $5.5$
,
 $11.4$
. For our main set of simulations, the substrates have thickness
 $h=100\sqrt{K_{y}}$
, large enough for the problem to become independent of
 $h$
, and the same permeabilities in
 $y$
and
 $z$
, so that
 $\unicode[STIX]{x1D719}_{zy}=1$
. An additional subset of simulations was conducted to explore the effect of a finite
 $h$
on the substrate performance. For a given configuration (i.e. a fixed
 $\unicode[STIX]{x1D719}_{xy}$
and
 $h/\sqrt{K_{y}}$
), we vary proportionately the permeabilities in viscous units,
 $K_{x}^{+}$
,
 $K_{z}^{+}$
and
 $K_{y}^{+}$
, which is equivalent to varying the viscous length. For each configuration,
 $\sqrt{K_{x}^{+}}$
varies between 0.7 and 11. The simulations under study are summarised in table 2, where each case is labelled with a letter and a number. In the main set of simulations, the letter refers to the anisotropy ratio
 $\unicode[STIX]{x1D719}_{xy}$
of the substrate, and the number to increasing permeability Reynolds numbers,
 $\sqrt{K_{x}^{+}}$
. In the secondary set, the subscripts
 $^{\prime }$
,
 $^{\prime \prime }$
and
 $^{\prime \prime \prime }$
indicate decreasing substrate depth.
DNS parameters.
 $\sqrt{K_{x}^{+}}$
,
 $\sqrt{K_{y}^{+}}$
and
 $\sqrt{K_{z}^{+}}$
are the streamwise, wall-normal and spanwise permeability lengths,
 $h^{+}$
is the thickness of the substrate,
 $\unicode[STIX]{x0394}U^{+}$
is the shift of the velocity profile in the logarithmic region and
 $DR_{180}$
and
 $DR_{5000}$
are the values of drag reduction for
 $\unicode[STIX]{x1D6FF}^{+}=180$
and
 $\unicode[STIX]{x1D6FF}^{+}=5000$
, respectively, obtained using expression (3.2). The values
 $DR_{5000}$
have been calculated using the smooth-channel centreline velocity from Lee & Moser (Reference Lee and Moser2015). The first three substrate configurations A, B and C have thickness
 $h=100\sqrt{K_{y}}$
and different anisotropy ratios
 $\unicode[STIX]{x1D719}_{xy}$
. The last three substrate configurations, C
 $^{\prime }$
, C
 $^{\prime \prime }$
and C
 $^{\prime \prime \prime }$
, have
 $\unicode[STIX]{x1D719}_{xy}\approx 11.4$
, same as substrate C, but different thickness
 $h/\sqrt{K_{x}}$
.

The virtual–origin model presented in § 3 is based on the idea that the near-wall cycle remains smooth-wall like, other than by being displaced a depth
 $\ell _{T}$
towards the substrate. Given that the origin perceived by turbulence is expected to be at
 $y=-\ell _{T}\approx -\sqrt{K_{z}}$
, throughout this section results are scaled taking that as the reference for the wall-normal height. The friction velocity is obtained by extrapolating the total stresses to that height,
 $u_{\unicode[STIX]{x1D70F}}=u_{\unicode[STIX]{x1D70F}_{y=0}}(1+\sqrt{K_{z}}/\unicode[STIX]{x1D6FF})^{1/2}$
, and the effective half-height channel becomes
 $\unicode[STIX]{x1D6FF}^{\prime }=\unicode[STIX]{x1D6FF}+\sqrt{K_{z}}$
(García-Mayoral et al.
Reference García-Mayoral, Gómez-de-Segura and Fairhall2019). The effect is, nevertheless, negligible for the small values of
 $\sqrt{K_{z}}/\unicode[STIX]{x1D6FF}$
considered here. Beyond the breakdown of the linear regime, the virtual–origin model begins to fail and the effect of the substrates can no longer be solely ascribed to a shift in origins. Nonetheless, for the cases lying in the degraded regime, we still use the virtual origin that would be valid in the linear regime,
 $y=-\sqrt{K_{z}}$
, to measure
 $u_{\unicode[STIX]{x1D70F}}$
. In this framework, any further effect can be interpreted as additive. The values of
 $\unicode[STIX]{x0394}U^{+}$
have been obtained using this
 $u_{\unicode[STIX]{x1D70F}}$
and comparing with a smooth-wall velocity profile with the origin shifted to
 $y=-\sqrt{K_{z}}$
, although the effect of the shift on
 $\unicode[STIX]{x0394}U^{+}$
is also negligible.
5.1 Drag-reduction curves
The drag-reduction curves obtained from the main set of DNSs are shown in figure 11. For small permeabilities, a linear drag-reduction regime is observed. In § 3.2, we predicted
 $\unicode[STIX]{x0394}U^{+}$
in this regime to be equal to the difference between the virtual origin for the mean flow,
 $\ell _{U}^{+}$
, and that perceived by turbulence,
 $\ell _{T}^{+}$
. For the substrates under consideration, these would be
 $\ell _{U}^{+}\approx \sqrt{K_{x}^{+}}$
and
 $\ell _{T}^{+}\approx \sqrt{K_{z}^{+}}$
, as given by (3.5). This prediction agrees well with the DNS results, and the three substrate configurations exhibit roughly the same initial unit slope in figure 11(b). The breakdown of the linear drag reduction regime, however, occurs for different values of
 $\sqrt{K_{x}^{+}}-\sqrt{K_{z}^{+}}$
depending on the substrate.
Drag-reduction curves for substrates with different anisotropy ratios.

 $\unicode[STIX]{x1D719}_{xy}\approx 11.4$
;

 $\unicode[STIX]{x1D719}_{xy}\approx 5.5$
; and

 $\unicode[STIX]{x1D719}_{xy}\approx 3.6$
. The symbols correspond to DNSs listed in table 2.
 $\unicode[STIX]{x0394}U^{+}$
is represented versus (a) the streamwise permeability length scale,
 $\sqrt{K_{x}^{+}}$
; (b) its predicted value in the linear regime,
 $\sqrt{K_{x}^{+}}-\sqrt{K_{z}^{+}}$
; (c) the wall-normal permeability length scale,
 $\sqrt{K_{y}^{+}}$
. (d)
 $\unicode[STIX]{x0394}U^{+}$
, reduced with its predicted slope, versus the wall-normal permeability length scale,
 $\sqrt{K_{y}^{+}}$
. – – –, theoretical prediction
 $\unicode[STIX]{x0394}U^{+}=\sqrt{K_{x}^{+}}-\sqrt{K_{z}^{+}}$
.
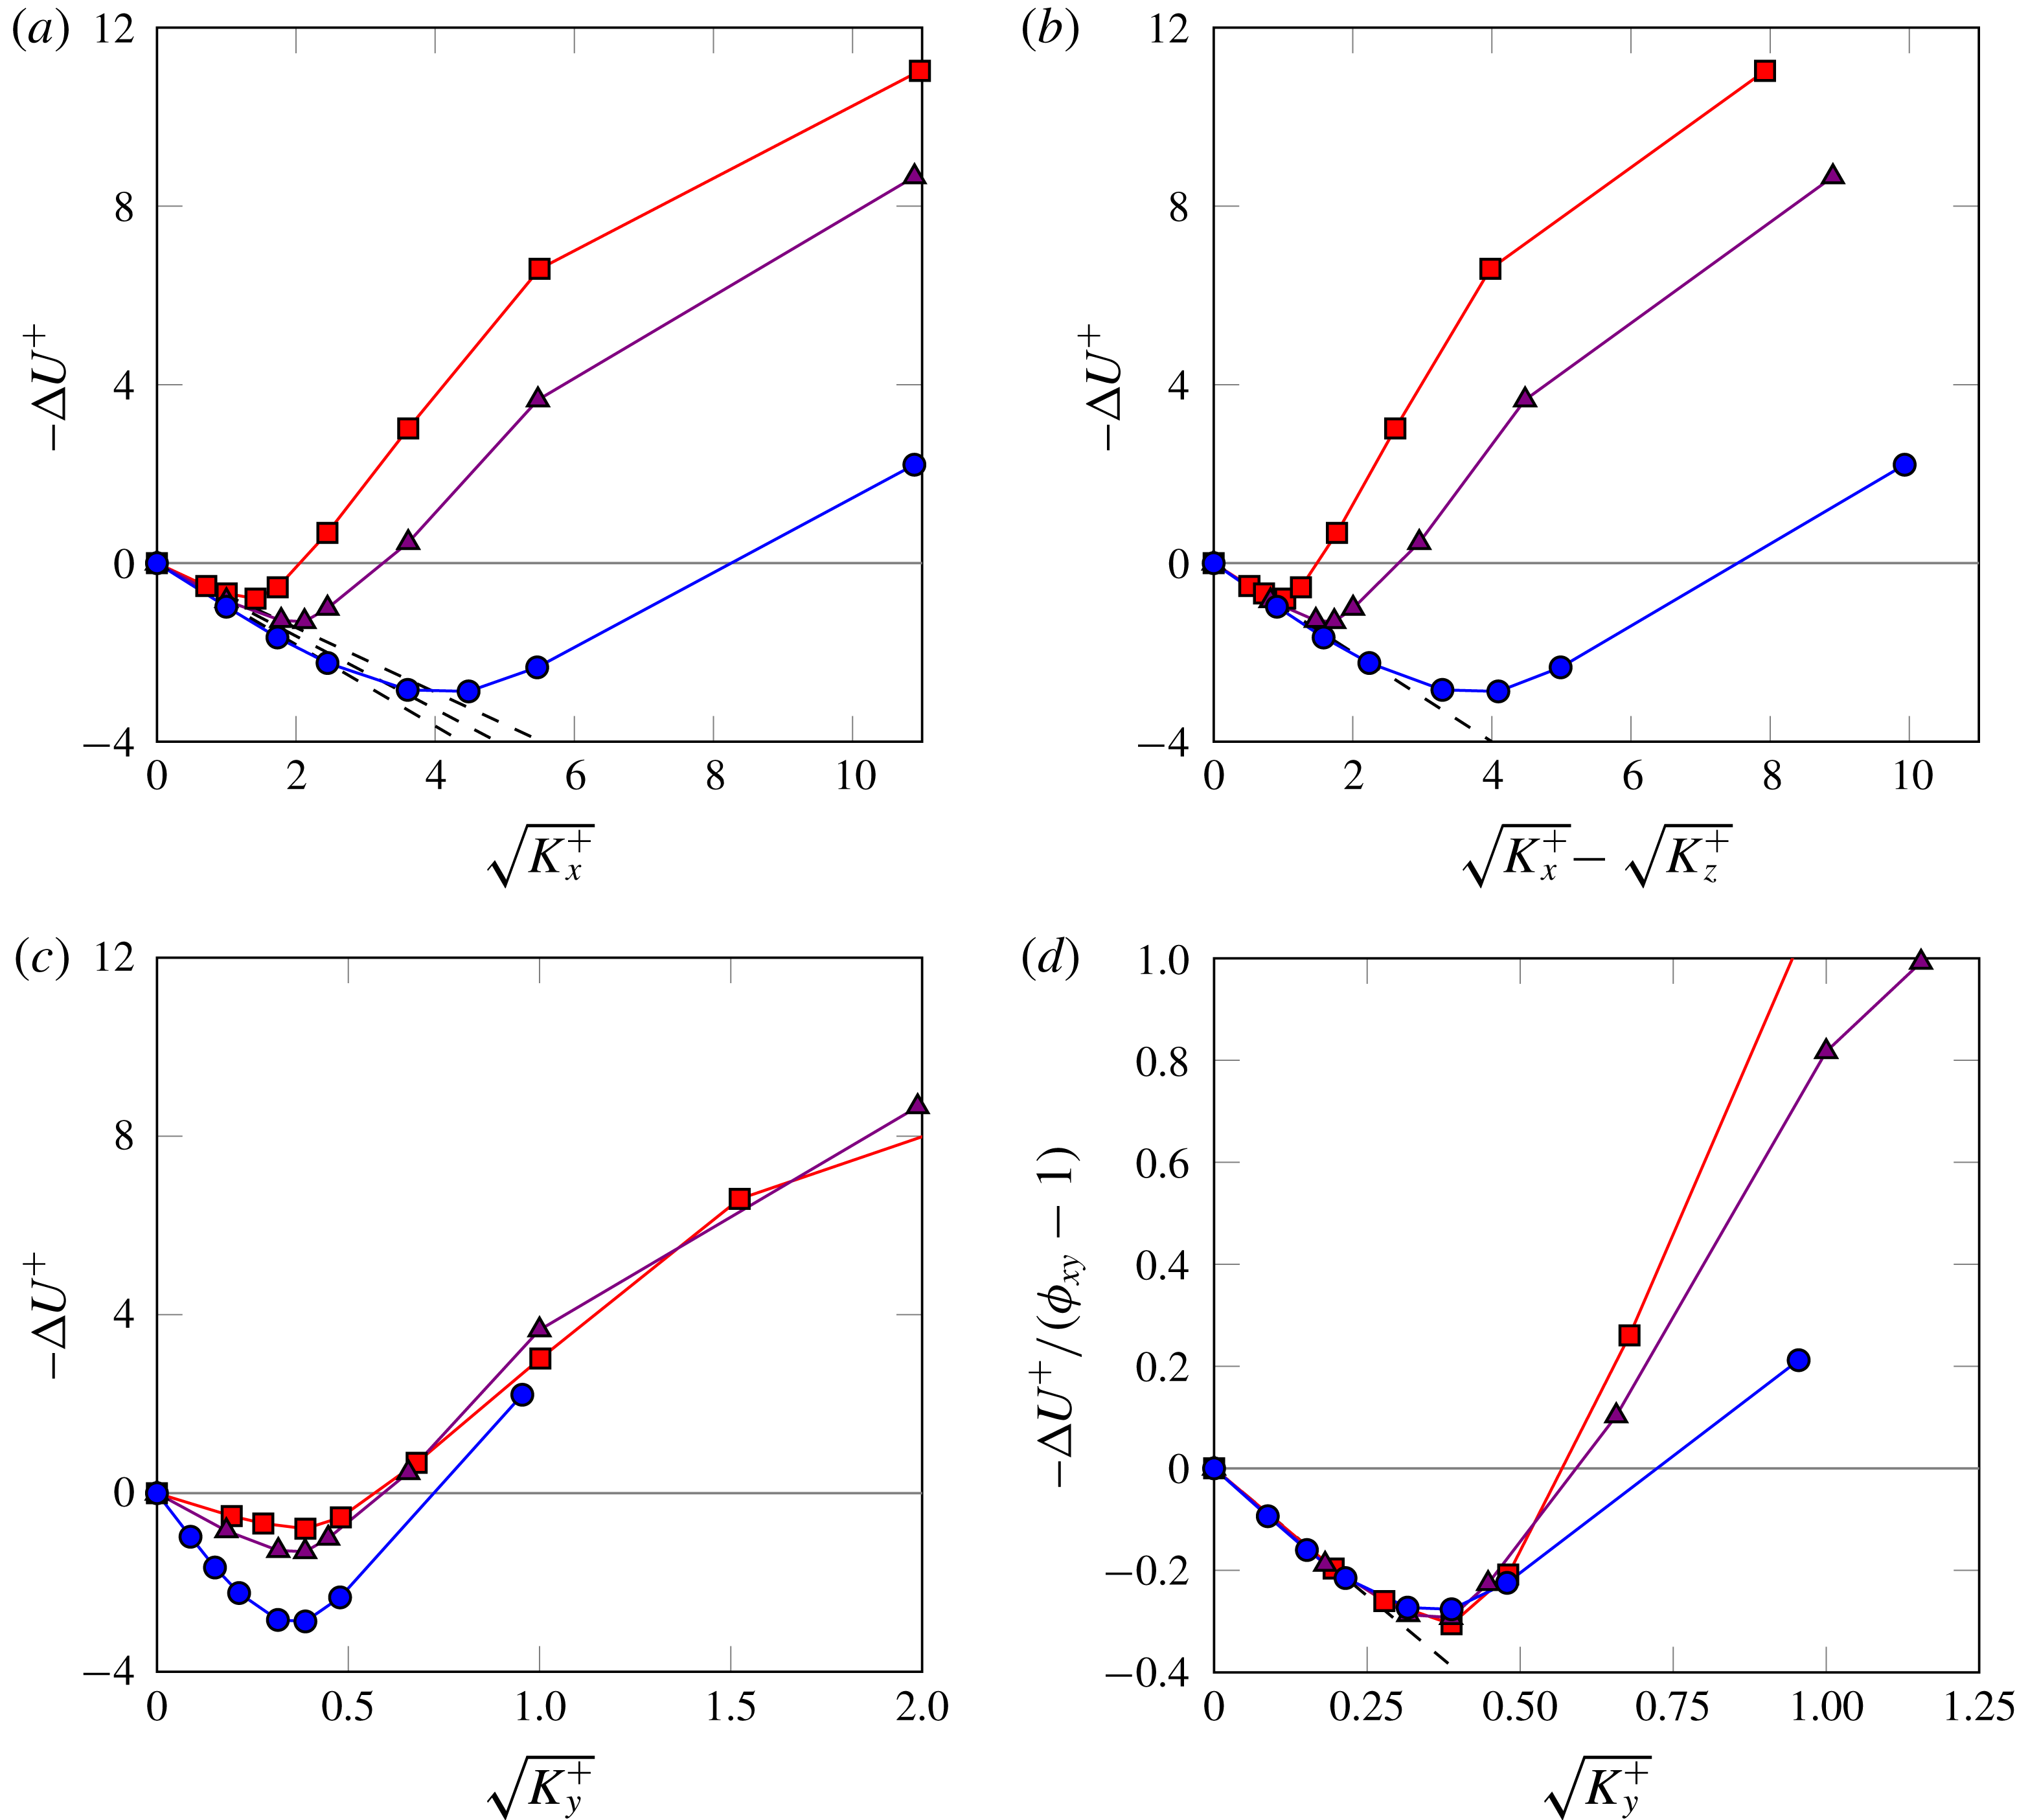
In contrast, when the length scale is represented using
 $\sqrt{K_{y}^{+}}$
– the parameter predicted in § 3.3 to trigger the Kelvin–Helmholtz instability – the location of the breakdown coincides for all the curves, as shown in figure 11(c). For all substrate configurations, the drag reduction is maximum for
 $\sqrt{K_{y}^{+}}|_{opt}\approx 0.38$
and the drag becomes greater than for a smooth wall for
 $\sqrt{K_{y}^{+}}\gtrsim 0.6$
.
The common linear drag-reduction behaviour, observed in figure 11(b), and its common breakdown, observed in figure 11(c), are condensed in figure 11(d). This is done by dividing
 $\unicode[STIX]{x0394}U^{+}$
from figure 11(c) by the slope for each curve expected from (3.8),
 $\unicode[STIX]{x1D719}_{xy}-1$
. Given that in this equation
 $\unicode[STIX]{x0394}U^{+}$
depends only on
 $\unicode[STIX]{x1D719}_{xy}$
and
 $\sqrt{K_{y}^{+}}$
, the general collapse suggested by this figure could be used to predict the performance of permeable substrates different to those explored in this work. Considering that the maximum
 $\unicode[STIX]{x0394}U^{+}$
in figure 11(d) occurs for
 $\sqrt{K_{y}^{+}}|_{opt}\approx 0.38$
and is approximately 80 % of that estimated by (3.8), the maximum
 $\unicode[STIX]{x0394}U^{+}$
would depend only on the anisotropy ratio
 $$\begin{eqnarray}\unicode[STIX]{x0394}U_{max}^{+}\approx 0.8\times 0.38\times (\unicode[STIX]{x1D719}_{xy}-1).\end{eqnarray}$$
For substrates with different cross-permeabilities,
 $\unicode[STIX]{x1D719}_{zy}\neq 1$
, it follows from (3.5) that the maximum
 $\unicode[STIX]{x0394}U^{+}$
would be
 $\unicode[STIX]{x0394}U_{max}^{+}\approx 0.8\times 0.38\times (\unicode[STIX]{x1D719}_{xy}-\unicode[STIX]{x1D719}_{zy})$
.
The secondary set of simulations aims to explore the effect of the substrate depth on
 $\unicode[STIX]{x0394}U^{+}$
and to test if the performance could be improved by reducing the depth enough for it to become a parameter in the problem. For this, the same substrate of cases C1–C7 is studied with depths
 $h/\sqrt{K_{x}}=1.5$
,
 $1.0$
and
 $0.5$
. From (3.4), we can expect shallower substrates to have smaller
 $\ell _{U}^{+}$
and
 $\ell _{T}^{+}$
, as the hyperbolic tangent terms become smaller than unity. This would reduce the slope of the
 $\unicode[STIX]{x0394}U^{+}$
curve in the linear regime and be an adverse effect. However, a reduced depth would also have the beneficial effect of making the substrate more robust to the onset of Kelvin–Helmholtz-like rollers, as at a given Reynolds number (i.e.
 $\sqrt{K_{x}^{+}}$
,
 $\sqrt{K_{y}^{+}}$
) equation (3.6) would predict a smaller
 $\sqrt{K_{Br}^{+}}$
. Note also that
 $\sqrt{K_{Br}^{+}}$
is a parameter empirically fitted to the results from the linear stability model, and that the actual results in § 3.3 show that shallower substrates have in fact a delayed onset in terms of
 $\sqrt{K_{Br}^{+}}$
, as shown in figure 5.
Drag-reduction curves for substrates with the same permeability but different substrate thickness. From blue to red, representing decreasing thickness, cases C1–C7, C
 $^{\prime }$
1–C
 $^{\prime }$
7, C
 $^{\prime \prime }$
1–C
 $^{\prime \prime }$
7 and C
 $^{\prime \prime \prime }$
1–C
 $^{\prime \prime \prime }$
7, corresponding to
 $h/\sqrt{K_{x}}=8.8$
,
 $1.5$
,
 $1.0$
and
 $0.5$
.
 $\unicode[STIX]{x0394}U^{+}$
is represented versus (a) its theoretical value in the linear regime; (b) the wall-normal permeability length scale,
 $\sqrt{K_{y}^{+}}$
; (c) the fitted permeability length scale for the breakdown
 $\sqrt{K_{Br}^{\prime +}}$
. (d)
 $\unicode[STIX]{x0394}U^{+}$
, reduced with its predicted linear slope, versus
 $\sqrt{K_{Br}^{\prime +}}$
. – – –, theoretical prediction
 $\unicode[STIX]{x0394}U^{+}=\sqrt{K_{x}^{+}}\tanh (h^{+}/\sqrt{K_{x}^{+}})-\sqrt{K_{z}^{+}}$
.

The results for
 $\unicode[STIX]{x0394}U^{+}$
for the shallow substrates of the secondary set of simulations are portrayed in figure 12, compared with the corresponding deep substrate from the main set, cases C1–C7. Given that all our substrates have higher permeability in
 $x$
, the first terms to experience the effect of a finite
 $h$
in (3.4) and (3.6) are those where
 $h$
appears scaled with
 $\sqrt{K_{x}}$
. Note that if we had considered values of
 $h$
small enough for
 $h/\sqrt{K_{z}}$
to be also small, we would have
 $\ell _{U}^{+}\approx \ell _{T}^{+}\approx h^{+}$
, which would yield no drag-reducing effect. For the values of
 $h/\sqrt{K_{x}}$
studied, we have
 $h/\sqrt{K_{y}}=h/\sqrt{K_{z}}=6$
,
 $11$
and
 $17$
, so the corresponding hyperbolic tangent terms in (3.4) and (3.6) are still essentially unity. This can be appreciated for instance in figure 12(a), where the predicted slope in the linear regime has been adjusted for the effect of
 $h^{+}$
on the streamwise slip,
 $\ell _{U}^{+}\approx \sqrt{K_{x}^{+}}\tanh (h^{+}/\sqrt{K_{x}^{+}})$
, but the spanwise slip remains
 $\ell _{T}^{+}\approx \sqrt{K_{z}^{+}}$
. Figure 12(b), however, shows that
 $\sqrt{K_{y}^{+}}$
is no longer adequate to parametrise the onset of the degradation. Panel (c), in turn, suggests that a suitable alternative is
 $\sqrt{K_{Br}^{\prime +}}=\sqrt{K_{y}^{+}}\tanh (h^{+}/(9\sqrt{K_{y}^{+}}))$
, and that the optimum value is still
 $\sqrt{K_{Br}^{\prime +}}\approx 0.38$
, as in figure 11. All the curves can be once more collapsed by reducing
 $\unicode[STIX]{x0394}U^{+}$
with its predicted slope in the linear regime and expressing the Reynolds number in terms of
 $\sqrt{K_{Br}^{\prime +}}$
, as is done in panel (d). This suggests that the optimum performance for shallow substrates can also be predicted and would be
 $\unicode[STIX]{x0394}U_{max}^{+}\approx 0.8\times 0.38\times [\unicode[STIX]{x1D719}_{xy}\tanh (h/\sqrt{K_{x}})-\unicode[STIX]{x1D719}_{zy}]/\tanh (h/9\sqrt{K_{y}})$
. Note, however, that
 $\unicode[STIX]{x0394}U_{max}^{+}$
decreases slightly as the substrate depth is reduced, as can be appreciated in panel (a), and that even if there is a delay in the critical
 $\sqrt{K_{y}^{+}}$
in absolute terms, as observed in panel (b), any gain in the relative width of the ‘drag bucket’ region – the near-optimal range – is insignificant, as is clear from panel (d).
5.2 Flow statistics
To explore the underlying mechanisms for the behaviour observed in the drag-reduction curves, let us focus on a fixed substrate configuration, that is, on one of the curves in figure 11. Let us take the one with the anisotropy ratio
 $\unicode[STIX]{x1D719}_{xy}\approx 11.4$
, that is, simulations C1–C7. The corresponding data for the other two substrate configurations can be found in appendix B. To illustrate how the overlying turbulence is modified at different points along the drag-reduction curve, figure 13 shows instantaneous realisations of
 $u$
,
 $v$
and
 $p$
in an
 $x$
–
 $z$
plane immediately above the substrate–channel interface. For small
 $\sqrt{K_{y}^{+}}$
, the flow field resembles that observed over a smooth wall. This is shown in panels (a–c) and (d–f), where the
 $u$
-field displays the signature of near-wall streaks, and the
 $v$
-field that of quasi-streamwise vortices. As
 $\sqrt{K_{y}^{+}}$
increases beyond the linear regime, the flow begins to be altered, as shown in panels (g–l). Some spanwise coherence emerges, becoming more prevalent for larger
 $\sqrt{K_{y}^{+}}$
. Eventually, the flow becomes strongly spanwise coherent and no trace of the near-wall cycle remains, as shown for a drag-increasing case in panels (m–o).
Instantaneous realisations of
 $u^{+}$
,
 $v^{+}$
and
 $p^{+}$
for a smooth channel and for substrates with
 $\unicode[STIX]{x1D719}_{xy}\approx 11.4$
at a
 $x$
–
 $z$
plane
 $y^{+}+\ell _{T}^{+}\approx 2.5$
. From left to right the columns are
 $u^{+}$
,
 $v^{+}$
and
 $p^{+}$
. From top to bottom, representing increasing permeabilities, (a–c) smooth wall, (d–f) case C2, (e–g) case C4, (h–j) case C6 and (m–o) case C7. In all cases, red to blue corresponds to
 $(2.2+\sqrt{K_{x}^{+}}/2)[-1,1]$
for
 $u^{+}$
,
 $(0.08+2/3\sqrt{K_{y}^{+}})[-1,1]$
for
 $v^{+}$
and
 $(5+5\sqrt[4]{K_{y}^{+}})[-1,1]$
for
 $p^{+}$
.

Mean velocity profiles for a substrate configuration with
 $\unicode[STIX]{x1D719}_{xy}\approx 11.4$
. Permeabilities in viscous units increase in the direction of the arrow and from blue to red, which correspond to cases C1–C7. (a) Profiles scaled with
 $u_{\unicode[STIX]{x1D70F}}$
measured at the interface plane,
 $y^{+}=0$
. (b) Profiles shifted by the linearly extrapolated virtual origin of turbulence,
 $\ell _{T}^{+}=\sqrt{K_{z}^{+}}$
, and scaled with the corresponding
 $u_{\unicode[STIX]{x1D70F}}$
at
 $y=-\ell _{T}$
, where the value at the origin, i.e. the offset predicted from the linear theory,
 $\unicode[STIX]{x0394}U^{+}=U_{slip}^{+}-\ell _{T}^{+}$
, has been subtracted. Black-dashed lines represent the smooth-channel case.

To assess quantitatively to what extent turbulence differs from that over smooth walls, we first focus on the one-point statistics resulting from the DNSs, portrayed in figures 14 and 16. The former shows the mean velocity profiles. In panel (a) the results are represented with the origin for the wall-normal height at the substrate–channel interface,
 $y^{+}=0$
, as is typically done in the literature. In this representation, the non-zero slip velocity at the interface,
 $U_{slip}^{+}$
, is apparent at
 $y^{+}=0$
, while far away from the wall the adverse effect of
 $\ell _{T}^{+}$
and the ‘roughness-like’ shape of the profile, that is the deviation from a smooth-wall-like shape, combine with
 $U_{slip}^{+}$
to yield the net velocity offset. In this framework, the effect of
 $\ell _{T}^{+}$
and the deviation from the shape of a smooth-wall profile cannot be easily disentangled.
If the velocity profiles are represented taking the origin for the wall-normal height at
 $y^{+}=-\ell _{T}^{+}$
and turbulence remained smooth-wall like, the profiles could then be expected to be like those for smooth walls, save for the offset given by (3.3). Subtracting that offset would then give a collapse of all the velocity profiles, and any deviation can then be separately attributed to modifications in the turbulence (García-Mayoral et al.
Reference García-Mayoral, Gómez-de-Segura and Fairhall2019). In figure 14(b), the profiles are portrayed with the origin at
 $y^{+}=-\ell _{T}^{+}$
and with the offset subtracted from the velocities. For cases C1–C3, which lie in the linear regime, the resulting collapse is indeed good, but beyond this regime the profiles deviate from the smooth-wall behaviour increasingly. Let us note that defining
 $u_{\unicode[STIX]{x1D70F}}$
at
 $y^{+}=-\ell _{T}^{+}$
implies that the wall-normal gradient of the mean profile at the interface is no longer necessarily
 $\text{d}U^{+}/\text{d}y^{+}|_{y^{+}=0}=1$
. This is because the stresses at that height in viscous units sum slightly less than one, and more specifically, because a non-zero transpiration gives rise to a Reynolds stress at the interface, so the viscous stress is no longer the only contribution to the total. As a result,
 $U_{slip}^{+}$
and
 $\ell _{x}^{+}$
do not strictly have equal value and cannot be used interchangeably. For small values of
 $\sqrt{K_{y}^{+}}$
, the Reynolds stress at the substrate–channel interface is negligible, so this effect is small and
 $U_{slip}^{+}\approx \ell _{x}^{+}$
. This is the case for the substrates lying on the linear regime. However, as
 $\sqrt{K_{y}^{+}}$
increases, the Reynolds stress at the interface ceases to be negligible, and
 $U_{slip}^{+}=\text{d}U^{+}/\text{d}y^{+}|_{y^{+}=0}\,\ell _{x}^{+}<\ell _{x}^{+}$
. This discrepancy between
 $U_{slip}^{+}$
and
 $\ell _{x}^{+}\approx \sqrt{K_{x}^{+}}$
for the substrates under consideration is shown in figure 15. The effect is small for the substrate of simulations C1–C7, but is significant for the substrates of B1–B7 and A1–A8, with results portrayed in appendix B. The effect is particularly intense for the latter substrate, which reaches
 $\sqrt{K_{y}^{+}}\approx 3$
and experiences significant transpiration. Although
 $U_{slip}^{+}$
and
 $\ell _{x}^{+}$
represent essentially the same concept, the quantitative effect of the streamwise slip is carried more accurately by
 $U_{slip}^{+}$
, so the latter has been used for the velocity offset in figure 16(b). Notice that this effect is negligible in slip-only simulations or other idealised surfaces where zero transpiration is assumed (Fairhall, Abderrahaman-Elena & García-Mayoral Reference Fairhall, Abderrahaman-Elena and García-Mayoral2019). Suga et al. (Reference Suga, Matsumura, Ashitaka, Tominaga and Kaneda2010) measured experimentally the slip velocity for isotropic substrates with different
 $\sqrt{K_{x}^{+}}$
, and their results are similar to those shown in figure 17 (cf. figure 4(b) in Suga et al. (Reference Suga, Matsumura, Ashitaka, Tominaga and Kaneda2010)). Their results also accounted for the pressure driven flow within the substrates, which would include the extra slip velocity from Darcy’s contribution discussed in § 3.5. However, for the mild pressure gradients considered, the slip velocity due to the overlying shear,
 ${\sim}\sqrt{K_{x}}\text{d}U/\text{d}y$
, is significantly larger than that due to the pressure gradient, which justifies the similarity with the present results.
Slip velocity at the substrate–channel interface,
 $U_{slip}^{+}$
, versus
 $\sqrt{K_{x}^{+}}$
for the three substrate configurations,

 $\unicode[STIX]{x1D719}_{xy}\approx 11.4$
;

 $\unicode[STIX]{x1D719}_{xy}\approx 5.5$
;

 $\unicode[STIX]{x1D719}_{xy}\approx 3.6$
. The symbols correspond to DNS cases listed in table 2. – – –,
 $U_{slip}^{+}=\sqrt{K_{x}^{+}}$
.

One-point turbulent statistics for a substrate configuration with
 $\unicode[STIX]{x1D719}_{xy}\approx 11.4$
. Permeabilities in viscous units increase in the direction of the arrow and from blue to red, which correspond to cases C1–C7 scaled with the corresponding
 $u_{\unicode[STIX]{x1D70F}}$
at
 $y=-\ell _{T}=-\sqrt{K_{z}}$
, the linearly extrapolated virtual origin for turbulence. Black-dashed lines represent the smooth-channel case. Root mean square fluctuations of (a) the streamwise velocity, (b) the wall-normal velocity, (c) the spanwise velocity and (d) the streamwise vorticity. (e) Reynolds stress.

Turbulent statistics for different permeable substrates. Each symbol indicates cases with approximately the same
 $\sqrt{K_{y}^{+}}$
and
 $\sqrt{K_{z}^{+}}$
.

 $\sqrt{K_{y}^{+}}\approx 0.2$
;

 $\sqrt{K_{y}^{+}}\approx 0.4$
;

 $\sqrt{K_{y}^{+}}\approx 1.0$
. The colours represent substrate configurations with a fixed
 $\unicode[STIX]{x1D719}_{xy}$
: red,
 $\unicode[STIX]{x1D719}_{xy}\approx 3.6$
; purple,
 $\unicode[STIX]{x1D719}_{xy}\approx 5.5$
; blue,
 $\unicode[STIX]{x1D719}_{xy}\approx 11.4$
. Black lines correspond to the smooth-channel case. Variables are scaled with the corresponding
 $u_{\unicode[STIX]{x1D70F}}$
at
 $y=-\sqrt{K_{z}}$
, the linearly extrapolated virtual origin for turbulence. (a) Mean velocity profiles, (b) mean velocity profiles shifted as in figure 14(a). (c–e) Streamwise, wall-normal and spanwise r.m.s. velocity fluctuations. (f) Streamwise vorticity r.m.s. fluctuations. (g) Reynolds stress.

The observations on the agreement or deviation from smooth-wall data in the mean velocity profiles extend also to the root mean square (r.m.s.) velocity fluctuations and streamwise vorticity, as well as the Reynolds shear stress, portrayed in figure 16(a–e). For the cases in the linear regime, the agreement with smooth-wall data is good. The only difference is a small deviation in the profile of
 $u^{\prime +}$
in the region immediately above the interface. This deviation is caused by the streamwise velocity effectively tending to zero at
 $y^{+}=-\ell _{U}^{+}$
, below the reference height
 $y^{+}=-\ell _{T}^{+}$
, and essentially does not alter near-wall dynamics (Gómez-de-Segura et al.
Reference Gómez-de-Segura, Fairhall, MacDonald, Chung and García-Mayoral2018a
). Beyond the linear regime, the fluctuations of the streamwise velocity decrease in intensity, while those of the transverse components increase. For rough surfaces, this is often associated with a decreased anisotropy of the fluctuating velocity (Orlandi & Leonardi Reference Orlandi and Leonardi2006). The Reynolds stress behaves analogously, and the r.m.s. streamwise vorticity also becomes more intense, but experiences a significant drop for the final case, C7. The snapshots of figure 13 could suggest that this is caused by the eventual annihilation of the quasi-streamwise vortices of the near-wall cycle, as the spanwise-coherent structures become prevalent.
In the models proposed in § 3, the streamwise, spanwise and wall-normal permeabilities have separate effects. These models capture leading-order features, but in (2.3) the effect of the three permeabilities is coupled. This manifests in the DNS results and, although the coupled effects are secondary, they become increasingly important for large permeabilities.
The leading-order effect of the substrate on the overlying turbulence is, as discussed above, set by the transverse permeabilities. Although in the present study they are equal, it could be expected that
 $\sqrt{K_{z}^{+}}$
governed the virtual–origin effect, while
 $\sqrt{K_{y}^{+}}$
governed the onset of spanwise-coherent dynamics. However, once
 $\sqrt{K_{y}^{+}}$
becomes sufficiently large,
 $\sqrt{K_{x}^{+}}$
plays a secondary role by indirectly modulating the transpiration. Quantitatively, this influence is embedded in (2.3). In essence, the wall-normal flow that penetrates into the substrate is in a first instance impeded by
 $\sqrt{K_{y}^{+}}$
, but from continuity it eventually needs to traverse the substrate tangentially, being then impeded by
 $\sqrt{K_{x}^{+}}$
, before it leaves through the interface elsewhere. Thus, a large
 $\sqrt{K_{x}^{+}}$
amplifies the transpiration effect of
 $\sqrt{K_{y}^{+}}$
or, rather, a small
 $\sqrt{K_{x}^{+}}$
limits it. This can be observed by comparing the three substrates studied at roughly equal values of
 $\sqrt{K_{y}^{+}}$
. As they have different anisotropy ratios, for the same
 $\sqrt{K_{y}^{+}}$
they have different
 $\sqrt{K_{x}^{+}}$
. Examples are shown in figure 17. The values
 $\sqrt{K_{y}^{+}}\approx 0.2$
,
 $0.4$
and
 $1.0$
have been chosen to observe the secondary effect of
 $\sqrt{K_{x}^{+}}$
in the linear regime, near the optimum drag reduction, and in the fully degraded regime, respectively. In the first case, the effect of
 $\sqrt{K_{x}^{+}}$
is negligible. The only effect is essentially that of
 $\sqrt{K_{z}^{+}}$
setting the virtual origin, and all the one-point statistics show good agreement with smooth-wall data. The effect is still small near the optimum, for
 $\sqrt{K_{y}^{+}}\approx 0.4$
, but the modulation by
 $\sqrt{K_{x}^{+}}$
begins to manifest, amplifying the effects of
 $\sqrt{K_{y}^{+}}$
already discussed above, such as the decreased anisotropy of the velocity fluctuations. Nevertheless, the Reynolds stress curve, and thus the shape of the mean velocity profile, remain close to those in the linear regime and for smooth walls. In the fully degraded regime,
 $\sqrt{K_{y}^{+}}\approx 1.0$
, the modulating effect of
 $\sqrt{K_{x}^{+}}$
becomes stronger and results in a further degradation of the Reynolds stress, the mean profile and the drag. The near-wall cycle is severely disrupted in this regime, and the main effect of
 $\sqrt{K_{x}^{+}}$
on the velocity fluctuations is on
 $u^{\prime +}$
near the wall, directly through the increased streamwise slip.
In turn,
 $\sqrt{K_{y}^{+}}$
also has a secondary effect on the streamwise slip, through the non-zero Reynolds stress at the interface discussed above. Figure 15 illustrates how, for the same
 $\sqrt{K_{x}^{+}}$
, which governs
 $U_{slip}^{+}$
to leading order, substrates with larger
 $\sqrt{K_{y}^{+}}$
have a smaller slip velocity.
While the analysis of the one-point statistics reveals variations in average intensities at different heights, it cannot provide information on whether those variations are caused by contributions from length scales that are not active over smooth walls, or from a change in the intensity of the typical length scales of canonical wall turbulence. To investigate this, we analyse the spectral energy distribution of the fluctuating velocities.
Premultiplied two-dimensional spectral densities for a substrate configuration with
 $\unicode[STIX]{x1D719}_{xy}\approx 11.4$
at a plane
 $y^{+}+\ell _{T}^{+}\approx 15.5$
. (a,e,i,m)
 $k_{x}k_{z}E_{uu}$
; (b,f,j,n)
 $k_{x}k_{z}E_{vv}$
; (c,g,k,o)
 $k_{x}k_{z}E_{ww}$
; (d,h,l,p)
 $k_{x}k_{z}E_{uv}$
; with contour increments
 $0.3241$
,
 $0.0092$
,
 $0.0404$
and
 $0.0239$
in wall units, respectively. Shaded, smooth channel. Line contours, permeable cases: (a–d) case C2, (e–h) case C4, (i–l) case C6 and (m–p) case C7. The box indicates the region of the spectrum considered in § 5.3.

As an example, spectral density maps of
 $u^{2}$
,
 $v^{2}$
,
 $w^{2}$
and
 $uv$
are represented at a height of roughly 15 wall units above the virtual origin for turbulence in figure 18. For substrates in the linear regime, such as C2 in panels (a–d), the agreement in spectral distribution with smooth-wall flows is excellent, as it was for the r.m.s. values, further supporting the idea that near-wall turbulence remains essentially canonical. For substrate C4, which is just past the linear regime and has a near-optimum
 $\sqrt{K_{y}^{+}}\approx 0.32$
, differences begin to appear in the spectral distributions, like additional energy at slightly shorter streamwise wavelengths, but most notably the emergence of a spectral region with high
 $v^{2}$
for large spanwise wavelengths,
 $\unicode[STIX]{x1D706}_{z}^{+}\approx 200{-}\infty$
and streamwise wavelengths
 $\unicode[STIX]{x1D706}_{x}^{+}\approx 100{-}200$
. This feature is consistent with the onset of spanwise-coherent structures observed in figure 13, and was also observed previously for riblets and connected to the presence of Kelvin–Helmholtz-like rollers (García-Mayoral & Jiménez Reference García-Mayoral and Jiménez2011). The linear stability analysis in Gómez-de-Segura et al. (Reference Gómez-de-Segura, Sharma and García-Mayoral2018b
) showed that the wavelength of the spanwise-coherent rollers,
 $\unicode[STIX]{x1D706}_{x}^{+}$
, scales in viscous units. In particular, the wavelength is set by the height where the second derivative of the mean flow,
 $\text{d}^{2}U/\text{d}y^{2}$
, concentrates, which is analogous to the mixing layer thickness of free-shear flows. For small permeabilities, where the near-wall cycle still prevails, as in the present cases, the near-wall peak of
 $\text{d}^{2}U/\text{d}y^{2}$
scales in viscous units, and hence the wavelength also scales in viscous units. Although this cannot be determined from the present simulations, since they are conducted at essentially the same Reynolds number, it was verified by García-Mayoral & Jiménez (Reference García-Mayoral and Jiménez2012) for riblets. As the permeabilities increase, the near-wall cycle is destroyed and the near-wall peak in
 $\text{d}^{2}U/\text{d}y^{2}$
ceases to exist, leaving
 $\unicode[STIX]{x1D6FF}$
as the only available scale. The wavelength of the rollers scales then with
 $\unicode[STIX]{x1D6FF}$
, as suggested in Jiménez et al. (Reference Jiménez, Uhlmann, Pinelli and Kawahara2001) and Breugem et al. (Reference Breugem, Boersma and Uittenbogaard2006) and thoroughly reported by Kuwata & Suga (Reference Kuwata and Suga2017) and Suga et al. (Reference Suga, Okazaki, Ho and Kuwata2018). The new spectral region observed for case C4 becomes more intense for cases C6 and C7. For C6, which lies in the degraded regime but still yields a net reduction in drag, energy appears in wavelengths as short as
 $\unicode[STIX]{x1D706}_{x}^{+}\approx 50$
, and the spanwise-coherent region spans a wider set of streamwise wavelengths,
 $\unicode[STIX]{x1D706}_{x}^{+}\approx 60{-}350$
, although there is still a trace of the spectral densities of smooth-wall flow for long wavelengths,
 $\unicode[STIX]{x1D706}_{x}^{+}\gtrsim 500$
, especially for
 $v^{2}$
and
 $w^{2}$
. For case C7, which gives a net drag increase, any residual trace of the spectral distribution for smooth-wall turbulence has disappeared, and the range
 $\unicode[STIX]{x1D706}_{x}^{+}\approx 60{-}350$
becomes dominant in
 $v^{2}$
.
5.3 Contributions to
 $\unicode[STIX]{x0394}U^{+}$

The degradation of the drag-reduction curves in figure 11 and the lack of collapse of the mean velocity profiles in figure 14(b) show that there is an additional contribution to
 $\unicode[STIX]{x0394}U^{+}$
beyond the virtual–origin effect predicted in § 3.2. To investigate this, we obtain an expression for
 $\unicode[STIX]{x0394}U^{+}$
by integrating the mean streamwise momentum equation for a permeable channel and comparing it with that for a smooth channel. This procedure follows closely MacDonald et al. (Reference MacDonald, Chan, Chung, Hutchins and Ooi2016), Abderrahaman-Elena, Fairhall & García-Mayoral (Reference Abderrahaman-Elena, Fairhall and García-Mayoral2019) and Fairhall et al. (Reference Fairhall, Abderrahaman-Elena and García-Mayoral2019), and is similar to that followed by García-Mayoral & Jiménez (Reference García-Mayoral and Jiménez2011). The streamwise momentum equation is averaged in time and in the streamwise and spanwise directions, and integrated in the wall-normal direction,
 $$\begin{eqnarray}-\overline{u^{\prime }v^{\prime }}^{+}+\frac{\text{d}U^{+}}{\text{d}y^{+}}=\frac{\unicode[STIX]{x1D6FF}^{\prime +}-y^{\prime +}}{\unicode[STIX]{x1D6FF}^{\prime +}},\end{eqnarray}$$
where the virtual origin of turbulence is taken as the reference for the wall-normal coordinate, i.e.
 $y^{\prime +}=y^{+}+\ell _{T}^{+}$
, and it is also the height where
 $u_{\unicode[STIX]{x1D70F}}$
is measured. The effective half-channel height or the effective friction Reynolds number is then
 $\unicode[STIX]{x1D6FF}^{\prime +}=\unicode[STIX]{x1D6FF}^{+}+\ell _{T}^{+}$
, as previously defined. In (5.2),
 $\overline{u^{\prime }v^{\prime }}^{+}$
is the Reynolds stress,
 $\text{d}U^{+}/\text{d}y^{+}$
the viscous stress and the right-hand side represents the total stress. These three terms are represented in figure 19(a).
Sketch of stress curves taking the virtual origin of turbulence as reference. — ⋅ —, viscous stress
 $\text{d}U^{+}/\text{d}y^{+}$
; ——,
 $\overline{u^{\prime }v^{\prime }}^{+}$
; – – –, total stress. (a) Permeable case at a friction Reynolds number
 $\unicode[STIX]{x1D6FF}^{\prime +}=\unicode[STIX]{x1D6FF}^{+}+\ell _{T,P}^{+}$
. (b) Smooth-wall case at the same friction Reynolds number
 $\unicode[STIX]{x1D6FF}^{\prime +}$
. (c) Smooth-wall case at a different friction Reynolds number,
 $\unicode[STIX]{x1D6FF}^{+}$
. The vertical black-dotted line indicates the substrate–channel interface in the permeable case and the wall in the smooth cases. The grey shaded area represents the integrated region in (5.4). The red shaded area in (c) shows the difference in the integrated area due to the difference in the friction Reynolds number.

Integrating again between two heights, the viscous stress term gives the velocity
 $U^{+}$
at those two heights, which can be compared to the corresponding equation for a smooth channel to obtain an expression for
 $\unicode[STIX]{x0394}U^{+}$
. The upper integration limit is then taken at an arbitrary height in the logarithmic region,
 $y^{\prime +}=H^{+}$
, so that the difference in
 $U^{+}$
yields
 $\unicode[STIX]{x0394}U^{+}$
. For the lower limit, we set it at
 $y^{\prime +}=\ell _{T,P}^{+}$
, where
 $\ell _{T,P}^{+}$
refers to the virtual origin of turbulence for the permeable case, since for that layout (5.2) is defined only above that height. Integrating (5.2) from
 $y^{\prime +}=\ell _{T,P}^{+}$
, to an arbitrary height in the logarithmic region,
 $y^{\prime +}=H^{+}$
, yields
 $$\begin{eqnarray}\int _{\ell _{T,P}^{+}}^{H^{+}}-\overline{u^{\prime }v^{\prime }}^{+}\text{d}y^{\prime +}+U^{+}(H^{+})-U^{+}(\ell _{T,P}^{+})=H^{+}-\ell _{T,P}^{+}-\frac{H^{+2}-\ell _{T,P}^{+2}}{2\unicode[STIX]{x1D6FF}^{\prime +}}.\end{eqnarray}$$
This equation applies not only to a permeable channel, but also to a smooth channel at the same Reynolds number,
 $\unicode[STIX]{x1D6FF}^{\prime +}$
, as depicted in figure 19(b). Note that for a smooth channel
 $y^{\prime +}=y^{+}$
, since the origin of turbulence is at the wall, but the lower integration limit can still be set at some height above the wall,
 $y^{\prime +}=\ell _{T,P}^{+}$
, with
 $\ell _{T,P}^{+}$
referring to the origin of the permeable case being compared.
Subtracting equation (5.3) for the permeable case and for the smooth channel, the resulting expression for
 $\unicode[STIX]{x0394}U^{+}$
is
 $$\begin{eqnarray}\displaystyle \unicode[STIX]{x0394}U^{+} & = & \displaystyle U_{P}^{+}(H^{+})-U_{S}^{+}(H^{+})\nonumber\\ \displaystyle & = & \displaystyle \underbrace{U_{P}^{+}(\ell _{T,P}^{+})}_{\substack{ U_{slip}^{+}}}-U_{S}^{+}(\ell _{T,P}^{+})\underbrace{-\int _{\ell _{T,P}^{+}}^{H^{+}}\left[\left(-\overline{u^{\prime }v^{\prime }}_{P}^{+}\right)-\left(-\overline{u^{\prime }v^{\prime }}_{S}^{+}\right)\right]\,\text{d}y^{\prime +},}_{{\mathcal{T}}_{uv}}\end{eqnarray}$$
where subscript ‘
 $P$
’ denotes the permeable channel, and subscript ‘
 $S$
’ the reference smooth channel at the same friction Reynolds number
 $\unicode[STIX]{x1D6FF}^{\prime +}$
. Equation (5.4) shows that
 $\unicode[STIX]{x0394}U^{+}$
, defined as the difference in
 $U^{+}$
between a permeable and smooth channel measured at the same distance from their respective origins of turbulence, consists of the sum of three terms.
The first term, is the slip velocity of the permeable case at the substrate–channel interface,
 $U_{slip}^{+}$
. This is a drag-reducing term, and for the cases lying in the linear regime it can be approximated to the virtual origin of the mean flow,
 $\ell _{U}^{+}$
, since
 $\text{d}U_{P}^{+}/\text{d}y^{+}|_{y^{\prime +}=\ell _{T,P}^{+}}\approx 1$
. The second term,
 $U_{S}^{+}(\ell _{T,P}^{+})$
, is the mean velocity of the smooth channel measured at
 $y^{\prime +}=\ell _{T,P}^{+}$
. It is a drag-increasing term, and if
 $\ell _{T,P}^{+}\lesssim 5$
, it can be accurately approximated as
 $U_{S}^{+}(\ell _{T,P}^{+})\approx \ell _{T,P}^{+}$
. This is essentially the same as the spanwise protrusion height of Luchini et al. (Reference Luchini, Manzo and Pozzi1991) and Luchini (Reference Luchini1996), and the spanwise slip of superhydrophobic surfaces (Min & Kim Reference Min and Kim2004; Busse & Sandham Reference Busse and Sandham2012). The offset between these terms is then
 $U_{slip}^{+}-U_{S}(\ell _{T,P}^{+})\approx \ell _{U}^{+}-\ell _{T,P}^{+}$
and represents the virtual–origin effect discussed throughout this paper. Note, however, that the exact contribution to
 $\unicode[STIX]{x0394}U^{+}$
involves velocities and not virtual origins as pointed out before. The contribution of the offset between these two terms to
 $\unicode[STIX]{x0394}U^{+}$
is shown in figure 20, where we can appreciate that the virtual origin approximation
 $\ell _{U}^{+}-\ell _{T}^{+}$
is valid not only in the linear regime, but even slightly beyond the optimum.
Different contributions to
 $\unicode[STIX]{x0394}U^{+}$
as a function of
 $\sqrt{K_{y}^{+}}$
for (a) substrates A1–A8, with
 $\unicode[STIX]{x1D719}_{xy}\approx 3.6$
, (b) substrates B1-B7, with
 $\unicode[STIX]{x1D719}_{xy}\approx 5.5$
and (c) substrates C1–C7, with
 $\unicode[STIX]{x1D719}_{xy}\approx 11.4$
.

 $\unicode[STIX]{x0394}U^{+}$
measured from the DNSs (same as in table 2);

 $U_{slip}^{+}-U_{S}^{+}(\ell _{T}^{+})$
;

 ${\mathcal{T}}_{uv}$
;

 $\unicode[STIX]{x1D706}_{x}^{+}\approx 70-320$
and
 $\unicode[STIX]{x1D706}_{z}^{+}\gtrsim 120$
;

 $\unicode[STIX]{x0394}U^{+}$
calculated from (5.4), as a sum of the contributions from the virtual–origin effect and the additional Reynolds stress. – – –, theoretical prediction
 $\unicode[STIX]{x0394}U^{+}=(\unicode[STIX]{x1D719}_{xy}-1)\sqrt{K_{y}^{+}}$
.

The third term,
 ${\mathcal{T}}_{uv}$
, represents the additional Reynolds stress induced by the permeable substrate. It is a drag-increasing term and its contribution to
 $\unicode[STIX]{x0394}U^{+}$
is also shown in figure 20. For the substrates lying in the linear regime, the Reynolds stress is smooth-wall like, except for the displacement
 $\ell _{T}^{+}$
towards the interface, and the term
 ${\mathcal{T}}_{uv}$
is therefore zero. The contribution of this term begins to be significant at the breakdown
 $\sqrt{K_{y}^{+}}|_{opt}$
, and increases with
 $\sqrt{K_{y}^{+}}$
in the degraded region. An increase in Reynolds stress is therefore responsible for the degradation of the drag-reducing behaviour of permeable substrates.
The spectral energy distribution of the wall-normal velocity in figure 18 shows the appearance of a new spectral region for large spanwise wavelengths centred around
 $\unicode[STIX]{x1D706}_{x}^{+}\approx 150$
, which is associated with the large spanwise-coherent structures observed in figure 13. To explore whether the additional Reynolds stress accounted for by
 ${\mathcal{T}}_{uv}$
is due to the energy accumulated in this spectral region, we define a spectral box with
 $\unicode[STIX]{x1D706}_{x}^{+}\approx 70{-}320$
and
 $\unicode[STIX]{x1D706}_{z}^{+}\gtrsim 120$
, as that depicted in figure 18, and quantify its contribution to the additional Reynolds stress, as in García-Mayoral & Jiménez (Reference García-Mayoral and Jiménez2011). The values are also included in figure 20, showing a close agreement with the whole
 ${\mathcal{T}}_{uv}$
. This suggests that the new spanwise-coherent structures are indeed responsible for the degradation of the drag, as it was also observed for riblets in García-Mayoral & Jiménez (Reference García-Mayoral and Jiménez2011). In essence, these structures increase the turbulence mixing, increasing the local Reynolds stress, and consequently the global drag.
Note that (5.4) compares a permeable channel with a smooth one at the same friction Reynolds number. Often, however, a reference smooth channel at exactly the same Reynolds number is not available. This is for instance the case for the simulations presented in this paper, where all the permeable cases are compared to the same smooth channel at a slightly different friction Reynolds number. When the Reynolds numbers match exactly, the total stress, and thus the Reynolds stress, collapse sufficiently far away from the surface, as they approach zero value at the centre of the channel. The contribution
 ${\mathcal{T}}_{uv}$
can then be entirely ascribed to wall effects, that is, to the presence of the substrate. If the Reynolds numbers differ, however, there may be a significant contribution to
 ${\mathcal{T}}_{uv}$
far from the surface, which is a Reynolds number effect, rather than a direct effect of the surface. The same effect appears when comparing smooth channels at different friction Reynolds numbers, as illustrated in figure 19(c). To quantify this effect, we compare the smooth channel at Reynolds number
 $\unicode[STIX]{x1D6FF}^{\prime +}$
used for (5.4), represented by a subscript ‘
 $S$
’, with another at a different Reynolds number
 $\unicode[STIX]{x1D6FF}^{+}$
, represented by a subscript ‘
 $S0$
’. Subtracting the two integrated mean streamwise momentum equations, the universality of the near-wall mean velocity profile over smooth walls gives
 $U_{S}^{+}(\ell _{T,P}^{+})=U_{S0}^{+}(\ell _{T,P}^{+})$
and
 $U_{S}^{+}(H^{+})=U_{S0}^{+}(H^{+})$
, yielding
 $$\begin{eqnarray}{\mathcal{T}}_{Re}=-\int _{\ell _{T,P}^{+}}^{H^{+}}[(-\overline{u^{\prime }v^{\prime }}_{S}^{+})-(-\overline{u^{\prime }v^{\prime }}_{S0}^{+})]\,\text{d}y^{\prime +}=\frac{H^{+2}-\ell _{T,P}^{+2}}{2}\left(\frac{1}{\unicode[STIX]{x1D6FF}^{\prime +}}-\frac{1}{\unicode[STIX]{x1D6FF}^{+}}\right).\end{eqnarray}$$
When the break-up of (5.4) is applied to DNS results from a complex surface,
 $P$
in our case, and a smooth wall at a different Reynolds number,
 $S0$
, the integral of the difference in Reynolds stresses would include both the surface and the Reynolds number effects. These, however, can be easily separated as
 $$\begin{eqnarray}\displaystyle & & \displaystyle -\int _{\ell _{T,P}^{+}}^{H^{+}}\left[\left(-\overline{u^{\prime }v^{\prime }}_{P}^{+}\right)-\left(-\overline{u^{\prime }v^{\prime }}_{S0}^{+}\right)\right]\text{d}y^{\prime +}\nonumber\\ \displaystyle & & \displaystyle \qquad =-\int _{\ell _{T,P}^{+}}^{H^{+}}\left[\left(-\overline{u^{\prime }v^{\prime }}_{P}^{+}\right)-\left(-\overline{u^{\prime }v^{\prime }}_{S}^{+}\right)\right]\text{d}y^{\prime +}-\int _{\ell _{T,P}^{+}}^{H^{+}}\left[\left(-\overline{u^{\prime }v^{\prime }}_{S}^{+}\right)-\left(-\overline{u^{\prime }v^{\prime }}_{S0}^{+}\right)\right]\text{d}y^{\prime +}\nonumber\\ \displaystyle & & \displaystyle \qquad ={\mathcal{T}}_{uv}+{\mathcal{T}}_{Re}.\end{eqnarray}$$
Note that, from (5.5),
 ${\mathcal{T}}_{Re}$
can be easily calculated a priori as the area of the trapezoid formed between the total stress lines for
 $\unicode[STIX]{x1D6FF}^{+}$
and
 $\unicode[STIX]{x1D6FF}^{\prime +}$
, as highlighted in figure 19(c). Here
 ${\mathcal{T}}_{uv}$
can subsequently be obtained by subtracting
 ${\mathcal{T}}_{Re}$
from the integral of the difference in Reynolds stresses of cases
 $P$
and
 $S0$
, as given by (5.6), so that it only includes the effect of the surface. This has been the procedure used to obtain the results shown in figure 20, even though for the small values of
 $\ell _{T}^{+}$
considered, the Reynolds number effect,
 ${\mathcal{T}}_{Re}$
, is negligible.
5.4 Adjustment of the theoretical models
In § 3, we presented theoretical models to estimate the drag-reducing behaviour for anisotropic permeable substrates, specifically, a linear drag-reduction model for small permeabilities given by (3.5) and a threshold for the degradation of this linear regime based on the onset of Kelvin–Helmholtz rollers. The information obtained from the present DNSs can be used to assess the validity of the theoretical models summarised in § 3, and if necessary adjust them, so that more accurate predictions can be made.
(a) Amplification of the most unstable mode versus
 $\sqrt{K_{Br}^{+}}$
, as in figure 5, but with the threshold values for the onset of Kelvin–Helmholtz-like instability adjusted to
 $\sqrt{K_{Br}^{+}}\approx \sqrt{K_{y}^{+}}=0.38-0.6$
. (b) Predicted values of
 $\unicode[STIX]{x0394}U^{+}$
from the linear theory of equation (3.8) versus the anisotropy ratio
 $\unicode[STIX]{x1D719}_{xy}$
, as in figure 6(b), but with the adjusted thresholds for the degraded region. The green line corresponds approximately to the optimum
 $\unicode[STIX]{x0394}U^{+}$
(
 $\sqrt{K_{y}^{+}}|_{opt}\approx 0.38$
); the red line corresponds approximately to zero
 $\unicode[STIX]{x0394}U^{+}$
(
 $\sqrt{K_{y}^{+}}|_{\unicode[STIX]{x0394}U^{+}=0}\approx 0.6$
). The symbols represent the DNS cases studied and the values next to them are the actual
 $\unicode[STIX]{x0394}U^{+}$
measured from the DNSs. Cases beyond
 $\unicode[STIX]{x0394}U_{pred}^{+}>5$
are not displayed.

The drag-reduction curves in figure 11 show that the linear regime is accurately represented by the offset between the virtual origins of the mean flow and that of turbulence,
 $\sqrt{K_{x}^{+}}-\sqrt{K_{z}^{+}}$
, as predicted by (3.5). As discussed above,
 $\unicode[STIX]{x0394}U^{+}$
in this regime would be more precisely given by the difference
 $U_{slip}^{+}-U_{S}^{+}(\ell _{T}^{+})$
, but the differences between
 $\sqrt{K_{x}^{+}}$
and
 $U_{slip}^{+}$
, and between
 $\sqrt{K_{z}^{+}}$
and
 $U_{S}^{+}(\ell _{T}^{+})$
only become significant for larger permeabilities – beyond the linear regime, as shown in figure 20.
The DNS results and the discussion in § 5.3 also support the idea that the degradation of the drag-reducing behaviour is caused by the formation of spanwise-coherent structures. These are generally associated with a Kelvin–Helmholtz-like instability, as discussed in § 3. In that section, we predicted that the onset of these structures was governed by
 $\sqrt{K_{y}^{+}}$
, the leading-order term of
 $\sqrt{K_{Br}^{+}}$
from (3.6), as shown in figure 5. From this figure, we estimated an a priori threshold for the onset of Kelvin–Helmholtz-like rollers in the range
 $\sqrt{K_{Br}^{+}}\approx \sqrt{K_{y}^{+}}\approx 1{-}2.2$
, beyond which (3.5) would no longer be valid. The drag reduction curves in figure 11(c), however, show that the degradation sets in for lower values of
 $\sqrt{K_{y}^{+}}$
than initially hypothesised. The optimum value of
 $\unicode[STIX]{x0394}U^{+}$
occurs at
 $\sqrt{K_{y}^{+}}|_{opt}\approx 0.38$
, after which performance degrades, and drag becomes greater than that for smooth walls for
 $\sqrt{K_{y}^{+}}|_{\unicode[STIX]{x0394}U^{+}=0}\approx 0.6$
. Adjusting figure 5 to account for these observed values, we obtain figure 21(a), which shows that the onset occurs as soon as the predicted amplification of the instability becomes positive.
In § 3, combining the equation for the linear regime with the limiting values of
 $\sqrt{K_{y}^{+}}$
, allowed us to design the parameter space for realisable drag reduction shown in figure 6(b), which later served to select the DNS cases studied in § 5. Using the limiting values of
 $\sqrt{K_{y}^{+}}$
observed in the DNSs (
 $\sqrt{K_{y}^{+}}\approx 0.38{-}0.6$
), the adjusted prediction map for
 $\unicode[STIX]{x0394}U^{+}$
is shown in figure 21(b), where the actual values of
 $\unicode[STIX]{x0394}U^{+}$
measured from DNSs are also shown. This figure illustrates how the theoretical predictions compare to the actual results obtained from DNS. In the linear regime,
 $\unicode[STIX]{x0394}U^{+}$
is well predicted by the theory. At the optimum
 $\unicode[STIX]{x0394}U^{+}$
line,
 $\sqrt{K_{y}^{+}}\approx 0.38$
, the exact value of
 $\unicode[STIX]{x0394}U^{+}$
is given by (5.1), that is, it is roughly 80 % of the linear regime prediction. Beyond this line, the performance degrades, and for the line
 $\sqrt{K_{y}^{+}}\approx 0.6$
, the drag reduction is fully negated. Assuming that this behaviour holds for substrates with anisotropy ratios different to those studied in this work, figure 21(b), which essentially contains the same information of figure 12(d), can be used to estimate their performance.
6 Conclusions
We have explored the ability of anisotropic permeable substrates to reduce turbulent skin friction. We have examined the effect of the streamwise, wall-normal and spanwise permeabilities in highly connected substrates, and showed that streamwise-preferential substrates can reduce drag.
We have conducted a series of DNSs of turbulent channels delimited by permeable substrates, where the flow within the substrates was modelled using Brinkman’s equation. The resulting drag-reduction curves obtained for different substrate configurations (different anisotropy ratios) are similar to the classical curves for riblets: they exhibit a linear drag-reduction regime followed by a degradation of performance, eventually leading to an increase of drag.
We have observed that, in the linear regime of small permeabilities, the drag reduction is proportional to the difference between the virtual origin perceived by the mean flow and that perceived by turbulence, which for permeable substrates gives
 $\unicode[STIX]{x0394}U^{+}\approx \sqrt{K_{x}^{+}}-\sqrt{K_{z}^{+}}$
. The drag-reducing ability of this technology results therefore from the streamwise-preferential configuration of the substrates, as in other complex surfaces (García-Mayoral et al.
Reference García-Mayoral, Gómez-de-Segura and Fairhall2019). In this regime, the overlying turbulence remains smooth-wall-like, but shifted towards the substrate–channel interface by the origin perceived by turbulence, i.e.
 $\sqrt{K_{z}^{+}}$
.
As permeabilities increase, the linear regime eventually breaks down. We observe that the breakdown is essentially governed by the wall-normal permeability,
 $K_{y}^{+}$
, and occurs for
 $\sqrt{K_{y}^{+}}\approx 0.38$
, independently of the substrate anisotropy. The breakdown can be attributed to the appearance of spanwise-coherent structures, associated with a Kelvin–Helmholtz-like instability. These structures appear to disrupt the near-wall cycle and modify the near-wall turbulence, increasing the Reynolds stress, and consequently, the drag. As permeabilities increase, the drag-increasing, spanwise-coherent structures become prevalent in the flow, outweighing the drag-reducing effect of the streamwise slip and eventually leading to an increase of drag.
In order to predict the drag-reducing behaviour of anisotropic permeable substrates, we have established some theoretical models, which agree well with the behaviour observed from DNS results. The linear regime is accurately described by the expression derived by Abderrahaman-Elena & García-Mayoral (Reference Abderrahaman-Elena and García-Mayoral2017), where
 $\unicode[STIX]{x0394}U^{+}=\sqrt{K_{x}^{+}}-\sqrt{K_{z}^{+}}$
. This assumes that the permeable medium is highly connected and that the substrate is sufficiently deep for the overlying turbulence not to perceive that its depth is finite,
 $h^{+}\gtrsim 2\sqrt{K_{x}^{+}}$
. Beyond
 $\sqrt{K_{y}^{+}}\approx 0.38$
, the formation of drag-increasing, Kelvin–Helmholtz rollers can be captured with a linear stability analysis. These models provide design guidelines to produce a drag-reducing permeable substrate and give quantitative estimates as to how much drag reduction could be expected.
Further work is nevertheless required to confirm these findings. Direct numerical simulations fully resolving the microstructure of the permeable substrates need to be conducted in order to set the region of validity of the current models, and to gain full understanding on the effect that these substrates have on the overlying turbulence.
Acknowledgement
G.G.-d.-S. was supported by an educational grant from Fundación Bancaria ‘la Caixa’, Amelia Earhart Fellowship and an award from The Cambridge Commonwealth, European and International Trust. Some simulations were run using the computational resources provided under EPSRC-UK Tier-2 grant no. EP/P020259/1 by CSD3, Cambridge.
Appendix A. Analytical solution of Brinkman’s equation
The flow within the porous medium is approximated using Brinkman’s equation (2.1), where
 $K_{x}$
,
 $K_{y}$
and
 $K_{z}$
are the principal directions of the permeability tensor and are considered to be different. Together with the continuity equation, the system of equations is
 $$\begin{eqnarray}\displaystyle & \displaystyle \unicode[STIX]{x1D708}\left(\frac{\unicode[STIX]{x2202}^{2}u}{\unicode[STIX]{x2202}x^{2}}+\frac{\unicode[STIX]{x2202}^{2}u}{\unicode[STIX]{x2202}y^{2}}+\frac{\unicode[STIX]{x2202}^{2}u}{\unicode[STIX]{x2202}z^{2}}\right)-\frac{\unicode[STIX]{x1D708}}{K_{x}}u-\frac{\unicode[STIX]{x2202}p}{\unicode[STIX]{x2202}x}=0, & \displaystyle\end{eqnarray}$$
 $$\begin{eqnarray}\displaystyle & \displaystyle \unicode[STIX]{x1D708}\left(\frac{\unicode[STIX]{x2202}^{2}v}{\unicode[STIX]{x2202}x^{2}}+\frac{\unicode[STIX]{x2202}^{2}v}{\unicode[STIX]{x2202}y^{2}}+\frac{\unicode[STIX]{x2202}^{2}v}{\unicode[STIX]{x2202}z^{2}}\right)-\frac{\unicode[STIX]{x1D708}}{K_{y}}v-\frac{\unicode[STIX]{x2202}p}{\unicode[STIX]{x2202}y}=0, & \displaystyle\end{eqnarray}$$
 $$\begin{eqnarray}\displaystyle & \displaystyle \unicode[STIX]{x1D708}\left(\frac{\unicode[STIX]{x2202}^{2}w}{\unicode[STIX]{x2202}x^{2}}+\frac{\unicode[STIX]{x2202}^{2}w}{\unicode[STIX]{x2202}y^{2}}+\frac{\unicode[STIX]{x2202}^{2}w}{\unicode[STIX]{x2202}z^{2}}\right)-\frac{\unicode[STIX]{x1D708}}{K_{z}}w-\frac{\unicode[STIX]{x2202}p}{\unicode[STIX]{x2202}z}=0, & \displaystyle\end{eqnarray}$$
 $$\begin{eqnarray}\displaystyle & \displaystyle \frac{\unicode[STIX]{x2202}u}{\unicode[STIX]{x2202}x}+\frac{\unicode[STIX]{x2202}v}{\unicode[STIX]{x2202}y}+\frac{\unicode[STIX]{x2202}w}{\unicode[STIX]{x2202}z}=0, & \displaystyle\end{eqnarray}$$
 $y=-h$
to
 $y=0$
and we neglect the influence of a mean pressure gradient within the substrate, as discussed in § 3.5.
In order to solve (A 1), we reduce this system of partial differential equation (PDE) with three dependent variables into a single equation with a single dependent variable. We start by taking the divergence of the Brinkman equation (A 1a )–(A 1c ) and use the continuity equation (A 1d ) to simplify, which yields
 $$\begin{eqnarray}\frac{1}{K_{x}}\frac{\unicode[STIX]{x2202}u}{\unicode[STIX]{x2202}x}+\frac{1}{K_{y}}\frac{\unicode[STIX]{x2202}v}{\unicode[STIX]{x2202}y}+\frac{1}{K_{z}}\frac{\unicode[STIX]{x2202}w}{\unicode[STIX]{x2202}z}+\frac{1}{\unicode[STIX]{x1D708}}\unicode[STIX]{x1D6FB}^{2}p=0.\end{eqnarray}$$
We then take the
 $y$
-derivative of (A 2) and replace
 $\unicode[STIX]{x2202}p/\unicode[STIX]{x2202}y$
from (A 1b
) to eliminate the pressure term. Using continuity again to remove the terms in
 $w$
, the following equation is obtained
 $$\begin{eqnarray}\frac{\unicode[STIX]{x2202}^{2}u}{\unicode[STIX]{x2202}x\unicode[STIX]{x2202}y}\left(\frac{1}{K_{x}}-\frac{1}{K_{z}}\right)-\frac{1}{K_{y}}\left(\frac{\unicode[STIX]{x2202}^{2}v}{\unicode[STIX]{x2202}x^{2}}+\frac{\unicode[STIX]{x2202}^{2}v}{\unicode[STIX]{x2202}z^{2}}\right)-\frac{1}{K_{z}}\frac{\unicode[STIX]{x2202}^{2}v}{\unicode[STIX]{x2202}y^{2}}+\unicode[STIX]{x1D735}^{4}v=0,\end{eqnarray}$$
which has terms in
 $v$
and
 $u$
alone. To remove
 $u$
, we take the
 $y$
-derivative of (A 1a
) and subtract the
 $x$
-derivative of (A 1b
). The obtained expression is then differentiated with respect to
 $x$
, yielding
 $$\begin{eqnarray}\left(\unicode[STIX]{x1D6FB}^{2}-\frac{1}{K_{x}}\right)\frac{\unicode[STIX]{x2202}^{2}u}{\unicode[STIX]{x2202}x\unicode[STIX]{x2202}y}-\left(\unicode[STIX]{x1D6FB}^{2}-\frac{1}{K_{y}}\right)\frac{\unicode[STIX]{x2202}^{2}v}{\unicode[STIX]{x2202}x^{2}}=0.\end{eqnarray}$$
Substituting for
 $\unicode[STIX]{x2202}^{2}u/\unicode[STIX]{x2202}x\unicode[STIX]{x2202}y$
from (A 3), a single equation for
 $v$
is obtained. This equation can be solved by expanding in Fourier series along
 $x$
and
 $z$
, so that
 $v(x,y,z)=\hat{v}(y)\text{e}^{\text{i}\unicode[STIX]{x1D6FC}_{x}x}\text{e}^{\text{i}\unicode[STIX]{x1D6FC}_{z}z}$
, where
 $\unicode[STIX]{x1D6FC}_{x}$
and
 $\unicode[STIX]{x1D6FC}_{z}$
are the wavenumbers and
 $\text{i}$
is the imaginary unit,
 $\text{i}=\sqrt{-1}$
. Differentiating in
 $x$
and
 $z$
becomes then multiplying by
 $\text{i}\unicode[STIX]{x1D6FC}_{x}$
and
 $\text{i}\unicode[STIX]{x1D6FC}_{z}$
, respectively, leading to the following ordinary differential equation (ODE)
 $$\begin{eqnarray}\displaystyle & & \displaystyle \left\{D^{6}+D^{4}\left[-3\unicode[STIX]{x1D6FC}^{2}-\frac{1}{K_{x}}-\frac{1}{K_{z}}\right]+D^{2}\left[\frac{1}{K_{y}}\unicode[STIX]{x1D6FC}^{2}+\left(2\unicode[STIX]{x1D6FC}^{2}+\frac{1}{K_{z}}\right)\left(\unicode[STIX]{x1D6FC}^{2}+\frac{1}{K_{x}}\right)\right.\right.\nonumber\\ \displaystyle & & \displaystyle \qquad \left.+\,\unicode[STIX]{x1D6FC}^{4}-\unicode[STIX]{x1D6FC}_{x}^{2}\left(\frac{1}{K_{x}}-\frac{1}{K_{z}}\right)\right]+\left[\left(\unicode[STIX]{x1D6FC}^{2}+\frac{1}{K_{y}}\right)\left(-\unicode[STIX]{x1D6FC}^{2}\left(\unicode[STIX]{x1D6FC}^{2}+\frac{1}{K_{x}}\right)\right.\right.\nonumber\\ \displaystyle & & \displaystyle \qquad \left.\left.\left.+\,\unicode[STIX]{x1D6FC}_{x}^{2}\left(\frac{1}{K_{x}}-\frac{1}{K_{z}}\right)\right)\right]\right\}\hat{v}=0,\end{eqnarray}$$
where
 $D$
denotes
 $\unicode[STIX]{x2202}/\unicode[STIX]{x2202}y$
and
 $\unicode[STIX]{x1D6FC}^{2}=\unicode[STIX]{x1D6FC}_{x}^{2}+\unicode[STIX]{x1D6FC}_{z}^{2}$
. This is a sixth-order equation, where all the derivatives are even, and the corresponding characteristic equation is a bicubic equation
 $$\begin{eqnarray}a_{3}r^{6}+a_{2}r^{4}+a_{1}r^{2}+a_{0}=0,\end{eqnarray}$$
where
 $$\begin{eqnarray}\displaystyle \left.\begin{array}{@{}c@{}}\displaystyle a_{3}=1,\\ \displaystyle a_{2}=-3\unicode[STIX]{x1D6FC}^{2}-\frac{1}{K_{x}}-\frac{1}{K_{z}},\\ \displaystyle a_{1}=\frac{1}{K_{y}}\unicode[STIX]{x1D6FC}^{2}+\left(2\unicode[STIX]{x1D6FC}^{2}+\frac{1}{K_{z}}\right)\left(\unicode[STIX]{x1D6FC}^{2}+\frac{1}{K_{x}}\right)+\unicode[STIX]{x1D6FC}^{4}-\unicode[STIX]{x1D6FC}_{x}^{2}\left(\frac{1}{K_{x}}-\frac{1}{K_{z}}\right),\\ \displaystyle a_{0}=\left(\unicode[STIX]{x1D6FC}^{2}+\frac{1}{K_{y}}\right)\left(-\unicode[STIX]{x1D6FC}^{2}\left(\unicode[STIX]{x1D6FC}^{2}+\frac{1}{K_{x}}\right)+\unicode[STIX]{x1D6FC}_{x}^{2}\left(\frac{1}{K_{x}}-\frac{1}{K_{z}}\right)\right).\end{array}\right\} & & \displaystyle\end{eqnarray}$$
This equation can be reduced to a cubic equation and then solved algebraically. If the discriminant of (A 6) is non-zero, i.e.
 $\unicode[STIX]{x1D6E5}=18a_{3}a_{2}a_{1}a_{0}-4a_{2}^{3}a_{0}+a_{2}^{2}a_{1}^{2}-4a_{3}a_{1}^{3}-27a_{3}^{2}a_{0}^{2}\neq 0$
, there are 6 different roots. The roots of the original equation (A 6) are denoted as
 $\pm r_{1}$
,
 $\pm r_{2}$
and
 $\pm r_{3}$
, and the general solution for
 $\hat{v}$
is then
 $$\begin{eqnarray}\hat{v}(y)=A\text{e}^{+r_{1}y}+B\text{e}^{-r_{1}y}+C\text{e}^{+r_{2}y}+D\text{e}^{-r_{2}y}+E\text{e}^{+r_{3}y}+F\text{e}^{-r_{3}y}.\end{eqnarray}$$
The constants
 $A$
,
 $B$
,
 $C$
,
 $D$
,
 $E$
and
 $F$
are determined once the boundary conditions are imposed and are a function of the geometry and the wavenumbers,
 $\unicode[STIX]{x1D6FC}_{x}$
and
 $\unicode[STIX]{x1D6FC}_{z}$
. Similar expressions for the pressure and the streamwise and spanwise velocities can be obtained by substitutions into (A 1b
), (A 3), and the continuity equation (A 1d
), respectively,
 $$\begin{eqnarray}\displaystyle \hat{p}(y) & = & \displaystyle \unicode[STIX]{x1D708}\left[r_{1}(A\text{e}^{+r_{1}y}-B\text{e}^{-r_{1}y})+r_{2}(C\text{e}^{+r_{2}y}-D\text{e}^{-r_{2}y})+r_{3}(E\text{e}^{+r_{3}y}-F\text{e}^{-r_{3}y})\right]\nonumber\\ \displaystyle & & \displaystyle -\,\unicode[STIX]{x1D708}\left(\unicode[STIX]{x1D6FC}^{2}+\frac{1}{K_{y}}\right)\left[\frac{1}{r_{1}}(A\text{e}^{+r_{1}y}-B\text{e}^{-r_{1}y})+\frac{1}{r_{2}}(C\text{e}^{+r_{2}y}-D\text{e}^{-r_{2}y})\right.\nonumber\\ \displaystyle & & \displaystyle \left.+\,\frac{1}{r_{3}}(E\text{e}^{+r_{3}y}-F\text{e}^{-r_{3}y})\right],\end{eqnarray}$$
 $$\begin{eqnarray}\displaystyle \hat{u} (y) & = & \displaystyle \text{i}\frac{1}{1/K_{x}-1/K_{z}}\frac{\unicode[STIX]{x1D6FC}^{2}}{\unicode[STIX]{x1D6FC}_{x}}\left(\frac{1}{K_{y}}+\unicode[STIX]{x1D6FC}^{2}\right)\left[\frac{A}{r_{1}}\text{e}^{+r_{1}y}-\frac{B}{r_{1}}\text{e}^{-r_{1}y}+\frac{C}{r_{2}}\text{e}^{+r_{2}y}-\frac{D}{r_{2}}\text{e}^{-r_{2}y}\right.\nonumber\\ \displaystyle & & \displaystyle \qquad \left.+\,\frac{E}{r_{3}}\text{e}^{+r_{3}y}-\frac{F}{r_{3}}\text{e}^{-r_{3}y}\right]-\text{i}\frac{1}{1/K_{x}-1/K_{z}}\frac{1}{\unicode[STIX]{x1D6FC}_{x}}\left(\frac{1}{K_{z}}+2\unicode[STIX]{x1D6FC}^{2}\right)\nonumber\\ \displaystyle & & \displaystyle \qquad \times \,[Ar_{1}\text{e}^{+r_{1}y}-Br_{1}\text{e}^{-r_{1}y}+Cr_{2}\text{e}^{+r_{2}y}-Dr_{2}\text{e}^{-r_{2}y}+Er_{3}\text{e}^{+r_{3}y}-Fr_{3}\text{e}^{-r_{3}y}]\nonumber\\ \displaystyle & & \displaystyle \qquad +\,\text{i}\frac{1}{1/K_{x}-1/K_{z}}\frac{1}{\unicode[STIX]{x1D6FC}_{x}}\left[Ar_{1}^{3}\text{e}^{+r_{1}y}-Br_{1}^{3}\text{e}^{-r_{1}y}\right.\nonumber\\ \displaystyle & & \displaystyle \qquad \left.+\,Cr_{2}^{3}\text{e}^{+r_{2}y}-Dr_{2}^{3}\text{e}^{-r_{2}y}+Er_{3}^{3}\text{e}^{+r_{3}y}-Fr_{3}^{3}\text{e}^{-r_{3}y}\right],\end{eqnarray}$$
 $$\begin{eqnarray}{\hat{w}}(y)=-\frac{\unicode[STIX]{x1D6FC}_{x}}{\unicode[STIX]{x1D6FC}_{z}}\hat{u} +\text{i}\frac{1}{\unicode[STIX]{x1D6FC}_{z}}\frac{\text{d}\hat{v}}{\text{d}y}.\end{eqnarray}$$
To obtain
 $A$
,
 $B$
,
 $C$
,
 $D$
,
 $E$
and
 $F$
, the boundary conditions need to be considered. The permeable substrate is delimited by an impermeable solid wall at the bottom, where no-slip and impermeability conditions are imposed, and by the free channel flow at the top, where continuity of the normal and tangential stresses holds, together with the continuity of the three velocity components. The boundary conditions at the substrate–channel interface have already been introduced in (2.2). Expanding these boundary conditions in Fourier space, and assuming
 $\tilde{\unicode[STIX]{x1D708}}\approx \unicode[STIX]{x1D708}$
, the continuity of the normal and tangential stresses at the interface simplifies to the continuity of pressure and wall-normal shear (
 $\text{d}\hat{u} /\text{d}y$
and
 $\text{d}{\hat{w}}/\text{d}y$
), respectively. Thus, the boundary conditions for the permeable substrates are
 $$\begin{eqnarray}\hat{u} ={\hat{w}}=\hat{v}=0,\quad \text{at}~y=-h,\end{eqnarray}$$
and
 $$\begin{eqnarray}\displaystyle \left.\unicode[STIX]{x1D708}\frac{\text{d}\hat{u} }{\text{d}y}\right|_{y=0^{-}}=\left.\unicode[STIX]{x1D708}\frac{\text{d}\hat{u} }{\text{d}y}\right|_{y=0^{+}},\quad \left.\unicode[STIX]{x1D708}\frac{\text{d}{\hat{w}}}{\text{d}y}\right|_{y=0^{-}}=\left.\unicode[STIX]{x1D708}\frac{\text{d}{\hat{w}}}{\text{d}y}\right|_{y=0^{+}},\quad \left.\hat{p}\right|_{y=0^{-}}=\left.\hat{p}\right|_{y=0^{+}},\quad \text{at}~y=0, & & \displaystyle \nonumber\\ \displaystyle & & \displaystyle\end{eqnarray}$$
where, at
 $y=0$
, the plus and minus signs correspond to the fluid and substrate sides of the interface, respectively.
By applying the above boundary conditions to (A 8), (A 10), (A 11) and (A 9), and particularising the solution at the substrate–channel interface, the velocities at the interface are
 $$\begin{eqnarray}\displaystyle & \displaystyle \hat{u} |_{y=0^{-}}=\left.{\mathcal{C}}_{uu}(\unicode[STIX]{x1D6FC}_{x},\unicode[STIX]{x1D6FC}_{z})\frac{\text{d}\hat{u} }{\text{d}y}\right|_{y=0^{+}}+\left.{\mathcal{C}}_{uw}(\unicode[STIX]{x1D6FC}_{x},\unicode[STIX]{x1D6FC}_{z})\frac{\text{d}{\hat{w}}}{\text{d}y}\right|_{y=0^{+}}+\left.{\mathcal{C}}_{up}(\unicode[STIX]{x1D6FC}_{x},\unicode[STIX]{x1D6FC}_{z})\hat{p}\right|_{y=0^{+}}, & \displaystyle\end{eqnarray}$$
 $$\begin{eqnarray}\displaystyle & \displaystyle {\hat{w}}|_{y=0^{-}}=\left.{\mathcal{C}}_{wu}(\unicode[STIX]{x1D6FC}_{x},\unicode[STIX]{x1D6FC}_{z})\frac{\text{d}\hat{u} }{\text{d}y}\right|_{y=0^{+}}+\left.{\mathcal{C}}_{ww}(\unicode[STIX]{x1D6FC}_{x},\unicode[STIX]{x1D6FC}_{z})\frac{\text{d}{\hat{w}}}{\text{d}y}\right|_{y=0^{+}}+\left.{\mathcal{C}}_{wp}(\unicode[STIX]{x1D6FC}_{x},\unicode[STIX]{x1D6FC}_{z})\hat{p}\right|_{y=0^{+}}, & \displaystyle\end{eqnarray}$$
 $$\begin{eqnarray}\displaystyle & \displaystyle \hat{v}|_{y=0^{-}}=\left.{\mathcal{C}}_{vu}(\unicode[STIX]{x1D6FC}_{x},\unicode[STIX]{x1D6FC}_{z})\frac{\text{d}\hat{u} }{\text{d}y}\right|_{y=0^{+}}+\left.{\mathcal{C}}_{vw}(\unicode[STIX]{x1D6FC}_{x},\unicode[STIX]{x1D6FC}_{z})\frac{\text{d}{\hat{w}}}{\text{d}y}\right|_{y=0^{+}}+\left.{\mathcal{C}}_{vp}(\unicode[STIX]{x1D6FC}_{x},\unicode[STIX]{x1D6FC}_{z})\hat{p}\right|_{y=0^{+}}, & \displaystyle\end{eqnarray}$$
 ${\mathcal{C}}_{ij}(\unicode[STIX]{x1D6FC}_{x},\unicode[STIX]{x1D6FC}_{z})$
are a function of the wavenumbers,
 $\unicode[STIX]{x1D6FC}_{x}$
and
 $\unicode[STIX]{x1D6FC}_{z}$
, and of the geometry of the substrate, i.e.
 $K_{x}$
,
 $K_{y}$
,
 $K_{z}$
and
 $h$
. An equivalent analysis can be carried out for the upper permeable substrate. Considering the symmetry properties for each variable, this yields
 $$\begin{eqnarray}\displaystyle & \displaystyle \hat{u} |_{y=(2\unicode[STIX]{x1D6FF})^{+}}=-\left.{\mathcal{C}}_{uu}(\unicode[STIX]{x1D6FC}_{x},\unicode[STIX]{x1D6FC}_{z})\frac{\text{d}\hat{u} }{\text{d}y}\right|_{y=(2\unicode[STIX]{x1D6FF})^{-}}-\left.{\mathcal{C}}_{uw}(\unicode[STIX]{x1D6FC}_{x},\unicode[STIX]{x1D6FC}_{z})\frac{\text{d}{\hat{w}}}{\text{d}y}\right|_{y=(2\unicode[STIX]{x1D6FF})^{-}}+\left.{\mathcal{C}}_{up}(\unicode[STIX]{x1D6FC}_{x},\unicode[STIX]{x1D6FC}_{z})\hat{p}\right|_{y=(2\unicode[STIX]{x1D6FF})^{-}}, & \displaystyle \nonumber\\ \displaystyle & & \displaystyle\end{eqnarray}$$
 $$\begin{eqnarray}\displaystyle & \displaystyle {\hat{w}}|_{y=(2\unicode[STIX]{x1D6FF})^{+}}=-\left.{\mathcal{C}}_{wu}(\unicode[STIX]{x1D6FC}_{x},\unicode[STIX]{x1D6FC}_{z})\frac{\text{d}\hat{u} }{\text{d}y}\right|_{y=(2\unicode[STIX]{x1D6FF})^{-}}-\left.{\mathcal{C}}_{ww}(\unicode[STIX]{x1D6FC}_{x},\unicode[STIX]{x1D6FC}_{z})\frac{\text{d}{\hat{w}}}{\text{d}y}\right|_{y=(2\unicode[STIX]{x1D6FF})^{-}}+\left.{\mathcal{C}}_{wp}(\unicode[STIX]{x1D6FC}_{x},\unicode[STIX]{x1D6FC}_{z})\hat{p}\right|_{y=(2\unicode[STIX]{x1D6FF})^{-}}, & \displaystyle \nonumber\\ \displaystyle & & \displaystyle\end{eqnarray}$$
 $$\begin{eqnarray}\displaystyle & \displaystyle \hat{v}|_{y=(2\unicode[STIX]{x1D6FF})^{+}}=\left.{\mathcal{C}}_{vu}(\unicode[STIX]{x1D6FC}_{x},\unicode[STIX]{x1D6FC}_{z})\frac{\text{d}\hat{u} }{\text{d}y}\right|_{y=(2\unicode[STIX]{x1D6FF})^{-}}+\left.{\mathcal{C}}_{vw}(\unicode[STIX]{x1D6FC}_{x},\unicode[STIX]{x1D6FC}_{z})\frac{\text{d}{\hat{w}}}{\text{d}y}\right|_{y=(2\unicode[STIX]{x1D6FF})^{-}}-\left.{\mathcal{C}}_{vp}(\unicode[STIX]{x1D6FC}_{x},\unicode[STIX]{x1D6FC}_{z})\hat{p}\right|_{y=(2\unicode[STIX]{x1D6FF})^{-}}. & \displaystyle \nonumber\\ \displaystyle & & \displaystyle\end{eqnarray}$$
 $\unicode[STIX]{x1D6FC}_{x}=0$
or
 $\unicode[STIX]{x1D6FC}_{z}=0$
, Brinkman’s equation simplifies and so does its solution. These cases are solved separately in §§ A.1, A.2 and A.3.
A.1 Modes
$\unicode[STIX]{x1D6FC}_{x}\neq 0$
,
$\unicode[STIX]{x1D6FC}_{z}=0$


When
 $\unicode[STIX]{x1D6FC}_{z}=0$
, the
 $z$
-derivatives become zero and the Brinkman equation for
 $w$
, i.e. equation (A 1c
), decouples from the other two. The original system of equations simplifies then to
 $$\begin{eqnarray}\displaystyle & \displaystyle \unicode[STIX]{x1D708}\left(\frac{\unicode[STIX]{x2202}^{2}u}{\unicode[STIX]{x2202}x^{2}}+\frac{\unicode[STIX]{x2202}^{2}u}{\unicode[STIX]{x2202}y^{2}}\right)-\frac{\unicode[STIX]{x1D708}}{K_{x}}u-\frac{\unicode[STIX]{x2202}p}{\unicode[STIX]{x2202}x}=0, & \displaystyle\end{eqnarray}$$
 $$\begin{eqnarray}\displaystyle & \displaystyle \unicode[STIX]{x1D708}\left(\frac{\unicode[STIX]{x2202}^{2}v}{\unicode[STIX]{x2202}x^{2}}+\frac{\unicode[STIX]{x2202}^{2}v}{\unicode[STIX]{x2202}y^{2}}\right)-\frac{\unicode[STIX]{x1D708}}{K_{y}}v-\frac{\unicode[STIX]{x2202}p}{\unicode[STIX]{x2202}y}=0, & \displaystyle\end{eqnarray}$$
 $$\begin{eqnarray}\displaystyle & \displaystyle \left(\frac{\unicode[STIX]{x2202}^{2}w}{\unicode[STIX]{x2202}x^{2}}+\frac{\unicode[STIX]{x2202}^{2}w}{\unicode[STIX]{x2202}y^{2}}\right)-\frac{1}{K_{z}}w=0, & \displaystyle\end{eqnarray}$$
 $$\begin{eqnarray}\displaystyle & \displaystyle \frac{\unicode[STIX]{x2202}u}{\unicode[STIX]{x2202}x}+\frac{\unicode[STIX]{x2202}v}{\unicode[STIX]{x2202}y}=0. & \displaystyle\end{eqnarray}$$
 $u$
and
 $v$
can be solved with a procedure similar to that described above, while
 $w$
can be solved separately.
Taking the two-dimensional divergence of equations (A 15a
) and (A 15b
) in the
 $x{-}y$
plane and using continuity yields
 $$\begin{eqnarray}\left(\frac{1}{K_{y}}-\frac{1}{K_{x}}\right)\frac{\unicode[STIX]{x2202}v}{\unicode[STIX]{x2202}y}+\frac{1}{\unicode[STIX]{x1D708}}\unicode[STIX]{x1D735}_{xy}^{2}\,p=0.\end{eqnarray}$$
Taking the
 $y$
-derivative of (A 15b
) and substituting
 $\unicode[STIX]{x2202}v/\unicode[STIX]{x2202}y$
from (A 16) yields an equation in
 $p$
alone. Taking the Fourier transform in
 $x$
leads to
 $$\begin{eqnarray}\left\{D^{4}+\left[-2\unicode[STIX]{x1D6FC}_{x}^{2}-\frac{1}{K_{x}}\right]D^{2}+\unicode[STIX]{x1D6FC}_{x}^{2}\left[\unicode[STIX]{x1D6FC}_{x}^{2}+\frac{1}{K_{y}}\right]\right\}\hat{p}=0.\end{eqnarray}$$
The corresponding characteristic equation is biquadratic,
 $$\begin{eqnarray}m^{4}+m^{2}\left(-2\unicode[STIX]{x1D6FC}^{2}-\frac{1}{K_{x}}\right)+\left(\unicode[STIX]{x1D6FC}^{4}+\frac{\unicode[STIX]{x1D6FC}^{2}}{K_{y}}\right)=0.\end{eqnarray}$$
Rewriting it as a second-order equation, the roots of the characteristic equation are
 $$\begin{eqnarray}\displaystyle \left.\begin{array}{@{}c@{}}\displaystyle m_{1}=-m_{2}=\sqrt{\frac{2\unicode[STIX]{x1D6FC}^{2}K_{x}+1+\sqrt{4\unicode[STIX]{x1D6FC}^{2}K_{x}\left(1-{\displaystyle \frac{K_{x}}{K_{y}}}\right)+1}}{2K_{x}}},\\ \displaystyle m_{3}=-m_{4}=\sqrt{\frac{2\unicode[STIX]{x1D6FC}^{2}K_{x}+1-\sqrt{4\unicode[STIX]{x1D6FC}^{2}K_{x}\left(1-{\displaystyle \frac{K_{x}}{K_{y}}}\right)+1}}{2K_{x}}}.\end{array}\right\} & & \displaystyle\end{eqnarray}$$
Except for the case in which
 $m_{1}=m_{3}$
, i.e.
 $(K_{x}/K_{y})=(1+4\unicode[STIX]{x1D6FC}^{2}K_{x}/4\unicode[STIX]{x1D6FC}^{2}K_{x})$
, the expression for
 $\hat{p}$
becomes
 $$\begin{eqnarray}\hat{p}(y)=A^{\prime }\text{e}^{m_{1}y}+B^{\prime }\text{e}^{m_{2}y}+C^{\prime }\text{e}^{m_{3}y}+D^{\prime }\text{e}^{m_{4}y},\end{eqnarray}$$
where
 $A^{\prime }$
,
 $B^{\prime }$
,
 $C^{\prime }$
and
 $D^{\prime }$
depend on the wavenumber
 $\unicode[STIX]{x1D6FC}_{x}$
and the geometrical properties of the permeable medium, and are determined by imposing the boundary conditions – impermeability and no-slip conditions at
 $y=-h$
, and continuity of pressure and
 $\text{d}\hat{u} /\text{d}y$
at
 $y=0$
. The general solutions for
 $\hat{v}$
and
 $\hat{u}$
can be obtained from (A 16) and (A 15d
), respectively.
In contrast, solving (A 15c
) for
 ${\hat{w}}$
is straightforward. Expanding it in Fourier series gives
 $$\begin{eqnarray}\frac{\unicode[STIX]{x2202}^{2}{\hat{w}}}{\unicode[STIX]{x2202}y^{2}}-\left(\unicode[STIX]{x1D6FC}_{x}^{2}+\frac{1}{K_{z}}\right){\hat{w}}=0,\end{eqnarray}$$
whose solution is
 $$\begin{eqnarray}{\hat{w}}=E_{x0}^{\prime }\text{e}^{y/L_{w}}+F_{x0}^{\prime }\text{e}^{-y/L_{w}},\end{eqnarray}$$
where
 $L_{w}=1/\sqrt{\unicode[STIX]{x1D6FC}_{x}^{2}+1/K_{z}}$
. Applying now the boundary conditions for
 ${\hat{w}}$
,
 ${\hat{w}}=0$
at the impermeable wall and continuity of
 $\text{d}{\hat{w}}/\text{d}y$
at the interface, leads to
 $$\begin{eqnarray}{\hat{w}}=L_{w}\frac{\text{e}^{\left(y+h\right)/L_{w}}-\text{e}^{-\left(y+h\right)/L_{w}}}{\text{e}^{h/L_{w}}+\text{e}^{-h/L_{w}}}\left.\frac{\text{d}{\hat{w}}}{\text{d}y}\right|_{y=0^{+}}.\end{eqnarray}$$
Comparing to the expressions presented in (A 13),
 ${\mathcal{C}}_{ww}(\unicode[STIX]{x1D6FC}_{x},0)$
is the proportionality term in (A 23) between
 ${\hat{w}}$
and its gradient, whereas
 ${\mathcal{C}}_{wu}(\unicode[STIX]{x1D6FC}_{x},0)={\mathcal{C}}_{wp}(\unicode[STIX]{x1D6FC}_{x},0)=0$
. Also, from the general solutions for
 $\hat{u}$
and
 ${\hat{w}}$
, we observe that
 ${\mathcal{C}}_{uw}(\unicode[STIX]{x1D6FC}_{x},0)={\mathcal{C}}_{vw}(\unicode[STIX]{x1D6FC}_{x},0)=0$
, which was expected, as there is no coupling between
 ${\hat{w}}$
and the other two velocities,
 $\hat{u}$
and
 $\hat{v}$
, for modes
 $(\unicode[STIX]{x1D6FC}_{x},0)$
. Hence, in this case, the nine coefficients presented for the general interface conditions (A 13) are reduced to only five.
A.2 Modes
$\unicode[STIX]{x1D6FC}_{x}=0$
,
$\unicode[STIX]{x1D6FC}_{z}\neq 0$


In this case, Brinkman’s equation for
 $u$
decouples from the other two. For cases with the same permeability in
 $y$
and
 $z$
directions,
 $K_{z}=K_{y}$
, the solution simplifies even more, to
 $$\begin{eqnarray}\displaystyle & \displaystyle \left(\frac{\unicode[STIX]{x2202}^{2}u}{\unicode[STIX]{x2202}y^{2}}+\frac{\unicode[STIX]{x2202}^{2}u}{\unicode[STIX]{x2202}z^{2}}\right)-\frac{1}{K_{x}}u=0, & \displaystyle\end{eqnarray}$$
 $$\begin{eqnarray}\displaystyle & \displaystyle \unicode[STIX]{x1D708}\left(\frac{\unicode[STIX]{x2202}^{2}v}{\unicode[STIX]{x2202}y^{2}}+\frac{\unicode[STIX]{x2202}^{2}v}{\unicode[STIX]{x2202}z^{2}}\right)-\frac{\unicode[STIX]{x1D708}}{K_{y}}v-\frac{\unicode[STIX]{x2202}p}{\unicode[STIX]{x2202}y}=0, & \displaystyle\end{eqnarray}$$
 $$\begin{eqnarray}\displaystyle & \displaystyle \unicode[STIX]{x1D708}\left(\frac{\unicode[STIX]{x2202}^{2}w}{\unicode[STIX]{x2202}y^{2}}+\frac{\unicode[STIX]{x2202}^{2}w}{\unicode[STIX]{x2202}z^{2}}\right)-\frac{\unicode[STIX]{x1D708}}{K_{y}}w-\frac{\unicode[STIX]{x2202}p}{\unicode[STIX]{x2202}z}=0, & \displaystyle\end{eqnarray}$$
 $$\begin{eqnarray}\displaystyle & \displaystyle \frac{\unicode[STIX]{x2202}v}{\unicode[STIX]{x2202}y}+\frac{\unicode[STIX]{x2202}w}{\unicode[STIX]{x2202}z}=0. & \displaystyle\end{eqnarray}$$
Taking the two-dimensional divergence of (A 24b
) and (A 24c
) in the
 $y{-}z$
plane leads to a Laplace equation for the pressure. We then take the Fourier transform with respect to
 $z$
(i.e.
 $p(y,z)=\hat{p}(y)\text{e}^{\text{i}\unicode[STIX]{x1D6FC}_{z}z}$
) to get
 $$\begin{eqnarray}\hat{p}(y)=A_{0z}^{\prime \prime }\text{e}^{\unicode[STIX]{x1D6FC}_{z}y}+B_{0z}^{\prime \prime }\text{e}^{-\unicode[STIX]{x1D6FC}_{z}y}.\end{eqnarray}$$
The general expressions for
 $\hat{v}$
and
 ${\hat{w}}$
can then be derived from the equations (A 24b
) and (A 24d
), respectively.
The streamwise velocity is solved similarly to
 $w$
in § A.1. We take the Fourier transform of (A 24a
) in
 $z$
, which gives
 $$\begin{eqnarray}\frac{\unicode[STIX]{x2202}^{2}\hat{u} }{\unicode[STIX]{x2202}y^{2}}-\left(\unicode[STIX]{x1D6FC}_{z}^{2}+\frac{1}{K_{x}}\right)\hat{u} =0.\end{eqnarray}$$
The solution, after applying the boundary conditions for
 $\hat{u}$
, is
 $$\begin{eqnarray}\hat{u} =L_{u}\frac{\text{e}^{\left(y+h\right)/L_{u}}-\text{e}^{-\left(y+h\right)/L_{u}}}{\text{e}^{h/L_{u}}+\text{e}^{-h/L_{u}}}\left.\frac{\text{d}\hat{u} }{\text{d}y}\right|_{y=0^{+}},\end{eqnarray}$$
where
 $L_{u}=1/\sqrt{\unicode[STIX]{x1D6FC}_{z}^{2}+1/K_{x}}$
. The proportionality coefficient relating
 $\hat{u}$
with its gradient is the coefficient
 ${\mathcal{C}}_{uu}(0,\unicode[STIX]{x1D6FC}_{z})$
, i.e.
 $$\begin{eqnarray}{\mathcal{C}}_{uu}(0,\unicode[STIX]{x1D6FC}_{z})=L_{u}\frac{\text{e}^{(y+h)/L_{u}}-\text{e}^{-(y+h)/L_{u}}}{\text{e}^{h/L_{u}}+\text{e}^{-h/L_{u}}},\end{eqnarray}$$
and
 ${\mathcal{C}}_{up}(0,\unicode[STIX]{x1D6FC}_{z})={\mathcal{C}}_{uw}(0,\unicode[STIX]{x1D6FC}_{z})={\mathcal{C}}_{wu}(0,\unicode[STIX]{x1D6FC}_{z})={\mathcal{C}}_{vu}(0,\unicode[STIX]{x1D6FC}_{z})=0$
.
A.3 Mode
$\unicode[STIX]{x1D6FC}_{x}=0$
,
$\unicode[STIX]{x1D6FC}_{z}=0$


Although the coefficients for the mean can be directly obtained from the expressions derived in §§ A.1 and A.2, this case deserves further discussion. When
 $\unicode[STIX]{x1D6FC}_{x}=\unicode[STIX]{x1D6FC}_{z}=0$
, the equations for the three velocities
 $u$
,
 $v$
and
 $w$
decouple from each other and the velocities for mode zero become
 $$\begin{eqnarray}\displaystyle & \displaystyle \hat{u} =\sqrt{K_{x}}\frac{\text{e}^{(y+h)/\sqrt{K_{x}}}-\text{e}^{-(y+h)/\sqrt{K_{x}}}}{\text{e}^{h/\sqrt{K_{x}}}+\text{e}^{-h/\sqrt{K_{x}}}}\left.\frac{\text{d}\hat{u} }{\text{d}y}\right|_{y=0^{+}}, & \displaystyle\end{eqnarray}$$
 $$\begin{eqnarray}\displaystyle & \displaystyle {\hat{w}}=\sqrt{K_{z}}\frac{\text{e}^{(y+h)/\sqrt{K_{z}}}-\text{e}^{-(y+h)/\sqrt{K_{z}}}}{\text{e}^{h/\sqrt{K_{z}}}+\text{e}^{-h/\sqrt{K_{z}}}}\left.\frac{\text{d}{\hat{w}}}{\text{d}y}\right|_{y=0^{+}}, & \displaystyle\end{eqnarray}$$
 $$\begin{eqnarray}\displaystyle & \displaystyle \hat{v}=0. & \displaystyle\end{eqnarray}$$
 $\unicode[STIX]{x1D6FC}_{z}=0$
and
 $\unicode[STIX]{x1D6FC}_{x}=0$
, respectively, while equation (A 29c
) is obtained from continuity, after applying the boundary condition that
 $\hat{v}=0$
at
 $y=0$
. Particularising at
 $y=0$
and comparing to the general boundary conditions introduced in (A 12), we have
 $$\begin{eqnarray}\displaystyle & \displaystyle \left.\hat{u} \right|_{y=0}=\sqrt{K_{x}}\tanh \left(\frac{h}{\sqrt{K_{x}}}\right)\left.\frac{\text{d}\hat{u} }{\text{d}y}\right|_{y=0^{+}}={\mathcal{C}}_{uu}(0,0)\left.\frac{\text{d}\hat{u} }{\text{d}y}\right|_{y=0^{+}}, & \displaystyle\end{eqnarray}$$
 $$\begin{eqnarray}\displaystyle & \displaystyle \left.{\hat{w}}\right|_{y=0}=\sqrt{K_{z}}\tanh \left(\frac{h}{\sqrt{K_{z}}}\right)\left.\frac{\text{d}{\hat{w}}}{\text{d}y}\right|_{y=0^{+}}={\mathcal{C}}_{ww}(0,0)\left.\frac{\text{d}{\hat{w}}}{\text{d}y}\right|_{y=0^{+}}, & \displaystyle\end{eqnarray}$$
 $$\begin{eqnarray}\displaystyle & \displaystyle \left.\hat{v}\right|_{y=0}=0, & \displaystyle\end{eqnarray}$$
 ${\mathcal{C}}_{uu}$
and
 ${\mathcal{C}}_{ww}$
, which relate the tangential velocities to their wall-normal gradient. These are the mean slip lengths
 $\ell _{x}^{+}$
and
 $\ell _{z}^{+}$
derived by Abderrahaman-Elena & García-Mayoral (Reference Abderrahaman-Elena and García-Mayoral2017).
Appendix B. Turbulence statistics for permeable substrates with
$\unicode[STIX]{x1D719}_{xy}=3.6{-}5.5$

In § 5 results for only the permeable substrates with
 $\unicode[STIX]{x1D719}_{xy}\approx 11.4$
are discussed. In this appendix, the flow statistics for the other two substrate configurations are presented. The mean velocity profiles and the turbulence fluctuations for configurations with
 $\unicode[STIX]{x1D719}_{xy}\approx 5.5$
and
 $\unicode[STIX]{x1D719}_{xy}\approx 3.6$
are compiled in figure 22.
One-point turbulent statistics for (a–f) a substrate configuration with
 $\unicode[STIX]{x1D719}_{xy}\approx 3.6$
, which corresponds to cases A1–A8; (g–l) a substrate configuration with
 $\unicode[STIX]{x1D719}_{xy}\approx 5.5$
, which corresponds to cases B1–B7. Permeabilities in viscous units increase in the direction of the arrow and from blue to red. Profiles are scaled with the corresponding
 $u_{\unicode[STIX]{x1D70F}}$
at
 $y=-\ell _{T}=-\sqrt{K_{z}}$
, the linearly extrapolated virtual origin for turbulence. Black-dashed lines represent the smooth-channel case. (a,g) Mean velocity profiles shifted by
 $\ell _{T}^{+}$
and where the value at the origin, i.e. the offset predicted from the linear theory,
 $\unicode[STIX]{x0394}U^{+}=U_{slip}^{+}-\ell _{T}^{+}$
, has been subtracted. Root mean square fluctuations of (b,h) the streamwise velocity, (c,i) the wall-normal velocity, (d,f) the spanwise velocity and (e,k) the streamwise vorticity. (f,l) Reynolds stress.

Appendix C. Fractional-step method for coupled velocity–pressure boundary conditions
As mentioned in § 4.1, in the DNS code the boundary conditions given by (2.3) are imposed with full, time-implicit coupling, and are embedded in the block matrices in (4.3). For instance, discretising equation (2.3a ) and rearranging it, the boundary condition for the streamwise velocity at the bottom boundary is imposed as
 $$\begin{eqnarray}A_{11}u_{0}^{k}+A_{12}u_{1}^{k}+A_{13}w_{0}^{k}+A_{14}w_{1}^{k}+G_{11}p_{1}^{k}+G_{12}p_{2}^{k}=0.\end{eqnarray}$$
Note that due to the staggered discretisation used, the streamwise and spanwise velocity components at the boundaries are interpolated using ghost points and their immediate neighbours. Therefore,
 $u_{0}^{k}$
and
 $w_{0}^{k}$
refer to the velocities at the ghost point, and
 $u_{1}^{k}$
and
 $w_{1}^{k}$
to those at the first grid point above the boundary. The pressure
 $p^{k}$
in (C 2) is defined only at the internal points of the channel (Kim & Moin Reference Kim and Moin1985). Hence, the pressure at the interface is extrapolated from the first two points into the channel,
 $p_{1}^{k}$
and
 $p_{2}^{k}$
. The elements
 $A_{1i}$
and
 $G_{1i}$
in (C 1) include terms from the left-hand side in (2.3a
) and from the coefficients
 ${\mathcal{C}}_{uu}$
,
 ${\mathcal{C}}_{uw}$
and
 ${\mathcal{C}}_{up}$
. Similar expressions are obtained for the other two velocities from (2.3a
) and their respective equations for the top interface. Implementing these boundary conditions in the system of (4.3), results in the modification of the following rows,

where the
 $\unicode[STIX]{x1D63C}$
matrix and the vectors
 $\boldsymbol{u}^{k}$
and
 $\boldsymbol{r}^{k-1}$
from (4.3) have been expanded in order to introduce the boundary conditions. The symbols in (C 2) refer to the non-zero matrix elements containing the terms introduced by the boundary conditions (2.3). The first row with full symbols (


 $\text{d}\hat{u} /\text{d}y$
and
 $\text{d}{\hat{w}}/\text{d}y$
are embedded in
 $\unicode[STIX]{x1D63C}$
, which is no longer tridiagonal, while the coupling between the velocities and pressure is embedded in both
 $\unicode[STIX]{x1D63C}$
and
 $\text{G}$
. The gradient operator also includes then terms from the boundary conditions. Once the boundary conditions have been applied, the lower–upper decomposition of the system (C 2) yields the system (4.4). Note that while for Perot (Reference Perot1993) the equations for
 $u^{\ast }$
,
 $v^{\ast }$
and
 $w^{\ast }$
were decoupled and could be solved independently, this is not the case here. In our case,
 $u^{\ast }$
and
 $w^{\ast }$
must be solved simultaneously, while
 $v^{\ast }$
can only be solved decoupled from the other velocity components once
 $u^{\ast }$
and
 $w^{\ast }$
have been solved.