1. Introduction
Understanding hydrodynamic instabilities and mixing of miscible fluids in porous media is an active area of research, related to several industrial and environmental processes, such as oil recovery (Homsy Reference Homsy1987),
 $\text{CO}_{2}$
sequestration (Huppert & Neufeld Reference Huppert and Neufeld2014), groundwater contamination (Berkowitz, Dror & Yaron Reference Berkowitz, Dror and Yaron2008), chromatographic separation (Guiochon et al.
Reference Guiochon, Felinger, Shirazi and Katti2008; Mishra, Martin & De Wit Reference Mishra, Martin and De Wit2009; Rana & Mishra Reference Rana and Mishra2014), to name a few. Global warming attributed to anthropogenic emission of greenhouse gases is one of the major challenges facing mankind. Carbon capture and storage (or
 $\text{CO}_{2}$
sequestration) in underground aquifers has been identified as a promising means to restrict unwanted rise of greenhouse gas levels in the atmosphere. Geological sequestration by disposal in deep saline aquifers offers several key advantages of miscible fingering instabilities driven by both viscous and buoyancy forces. At a subsurface saline aquifer site the injected super-critical lighter
 $\text{CO}_{2}$
rises and accumulates under impervious rock, followed by dissolution of
 $\text{CO}_{2}$
into the underlying brine. An unstably stratified diffusive interface of heavier
 $\text{CO}_{2}$
-dissolved brine is formed above the pure brine and transition to natural convection in the form of unstable sinking plumes occurs over time.
Several theoretical (Daniel & Riaz Reference Daniel and Riaz2014; Huppert & Neufeld Reference Huppert and Neufeld2014; Loodts et al.
Reference Loodts, Thomas, Rongy and De Wit2014) and experimental (Backhaus, Turitsyn & Ecke Reference Backhaus, Turitsyn and Ecke2011; Loodts et al.
Reference Loodts, Thomas, Rongy and De Wit2014) studies have been conducted to understand the convective instabilities and are devoted to characterizing optimal storage sites that ensure
 $\text{CO}_{2}$
does not leak into the environment. In such convective flows, a viscosity variation, albeit small, at the diffusive interface influences the onset of instability and hence plays a significant role in characterizing the storage sites. Despite having enormous importance in real life applications this problem remains poorly explored. Manickam & Homsy (Reference Manickam and Homsy1995) have shown through linear stability analysis (LSA) as well as direct numerical simulation (DNS) that locally stable regions can be introduced in a buoyantly unstable diffusive interface by suitably choosing the viscosity profile and injection velocity. Recently, Daniel & Riaz (Reference Daniel and Riaz2014) used fixed interface and moving interface models to compare the theoretical predictions with the corresponding experimental observations (Backhaus, Turitsyn & Ecke Reference Backhaus, Turitsyn and Ecke2011). These authors showed, through an LSA, that in the absence of displacement the onset time increases when the dynamic viscosity increases with the depth. On the other hand, when the more viscous fluid displaces the less viscous one from above the onset time depends non-monotonically on the viscosity contrast between the two fluids. In both these studies LSA was performed under a quasi-steady-state approximation, which has its own drawback, since it does not capture possible transient growth of the linearly unstable modes and hence fails to predict the onset of instability accurately. For flows with an unsteady base state, transient growth of the perturbations is possible in hydrodynamic stability problems driven solely by a buoyancy force (Rapaka et al.
Reference Rapaka, Chen, Pawar, Stauffer and Zhang2008) or viscous force (Hota, Pramanik & Mishra Reference Hota, Pramanik and Mishra2015a
).
An examination of the above-mentioned literature reveals that transient growth plays an important role in the onset of instability. Therefore, it is essential to perform an LSA without the quasi-steady-state approximation, which not only captures the onset time more accurately, but also represents the physics appropriately. Recently, Hota, Pramanik & Mishra (Reference Hota, Pramanik and Mishra2015b ) have discussed an LSA based on an initial value problem (IVP) approach using a Fourier pseudo-spectral method. This IVP-based LSA method captures the diffusion-dominated region, which has never been captured before using the quasi-steady-state approximation. In this context, we present an LSA (Hota et al. Reference Hota, Pramanik and Mishra2015b ) and DNS (Tan & Homsy Reference Tan and Homsy1988) using a Fourier pseudo-spectral method to analyse the influence of viscosity contrast on buoyantly unstable miscible fluids in vertical porous media when the dynamic viscosity of the upper fluid is more than or less than that of the lower fluid. From linear stability results it is identified that in the absence of displacement, a viscosity contrast of either kind delays the onset of instability of gravitationally unstable miscible fluids. We further identify two different dynamical regimes in which the instability is dominated either by the viscous force or the buoyancy force. Our results pave the way for new insights into the influence of viscosity contrast on fingering instability in a buoyantly unstable miscible system.
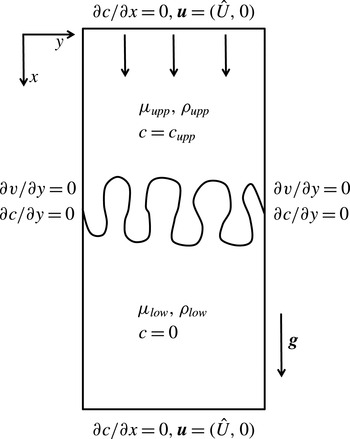
Schematic of the flow.

2. Problem formulation
2.1. Governing equations
Let us consider the displacement of a fluid of dynamic viscosity
 ${\it\mu}_{low}$
and density
 ${\it\rho}_{low}$
by another fluid of dynamic viscosity
 ${\it\mu}_{upp}$
and density
 ${\it\rho}_{upp}\,({>}{\it\rho}_{low})$
in a vertical porous medium, where the subscripts ‘low’ and ‘upp’ correspond to the lower and upper fluid, respectively. The fluids are assumed to be incompressible and miscible with each other. We further assume that the displacing fluid is injected at a uniform speed
 $\hat{U}$
vertically downward as shown in figure 1. The dynamic viscosity of the fluid varies with a solute concentration,
 $c$
, which satisfies a convection–diffusion equation. The fluid velocity can be determined in terms of Darcy’s law, which is mathematically analogous to the flow equation in two-dimensional (2D) homogeneous porous media. Hence, the governing equations can be written as
 $$\begin{eqnarray}\displaystyle & \displaystyle \boldsymbol{{\rm\nabla}}\boldsymbol{\cdot }\boldsymbol{u}=0, & \displaystyle\end{eqnarray}$$
 $$\begin{eqnarray}\displaystyle & \displaystyle \boldsymbol{{\rm\nabla}}p=-\frac{{\it\mu}(c)}{{\it\kappa}}\boldsymbol{u}+{\it\rho}(c)\boldsymbol{g}, & \displaystyle\end{eqnarray}$$
 $$\begin{eqnarray}\displaystyle & \displaystyle \partial _{t}c+\boldsymbol{u}\boldsymbol{\cdot }\boldsymbol{{\rm\nabla}}c=D{\rm\nabla}^{2}c, & \displaystyle\end{eqnarray}$$
 ${\it\kappa}$
is the permeability of the porous medium,
 $\boldsymbol{g}=(g,0)$
with
 $g$
being the gravitational acceleration and
 $D$
is the isotropic dispersion coefficient.
2.2. Dimensionless formulation
In order to obtain dimensionless equations we use
 $L_{ch}=D/V_{ch}$
and
 ${\it\tau}_{ch}=D/V_{ch}^{2}$
as the characteristic length and time scales, respectively, where
 $V_{ch}={\rm\Delta}{\it\rho}{\it\kappa}g/{\it\mu}_{ch}$
is the buoyancy-induced velocity, and
 ${\it\mu}_{ch}$
is the characteristic viscosity. The characteristic pressure, concentration and density are taken to be
 ${\it\mu}_{ch}D/{\it\kappa},c_{upp}$
and
 ${\rm\Delta}{\it\rho}={\it\rho}_{upp}-{\it\rho}_{low}$
, respectively. The related dimensionless equations in a Lagrangian frame of reference moving with a dimensionless velocity,
 $U=\hat{U} /V_{ch}$
, are
 $$\begin{eqnarray}\displaystyle & \displaystyle \boldsymbol{{\rm\nabla}}\boldsymbol{\cdot }\boldsymbol{u}=0, & \displaystyle\end{eqnarray}$$
 $$\begin{eqnarray}\displaystyle & \displaystyle \boldsymbol{{\rm\nabla}}p=-{\it\mu}(c)(\boldsymbol{u}+U\boldsymbol{e}_{x})+{\it\rho}(c)\boldsymbol{e}_{x}, & \displaystyle\end{eqnarray}$$
 $$\begin{eqnarray}\displaystyle & \displaystyle \partial _{t}c+\boldsymbol{u}\boldsymbol{\cdot }\boldsymbol{{\rm\nabla}}c={\rm\nabla}^{2}c, & \displaystyle\end{eqnarray}$$
 $\boldsymbol{e}_{x}$
is the unit vector in the
 $x$
-direction. We assume that the density varies linearly with concentration, such that the dimensionless density profile is given as
 ${\it\rho}(c)=c+{\it\rho}_{low}/{\rm\Delta}{\it\rho}$
, and
 $$\begin{eqnarray}{\it\mu}(c)=\text{e}^{Rf(c)},\end{eqnarray}$$
where
 $f(c)$
is a linear function of
 $c$
and the log-mobility ratio
 $R$
represents the natural logarithm of the ratio of the dynamic viscosities of the two fluids. The explicit form of
 $f(c)$
and
 $R$
depend on the characteristic viscosity
 ${\it\mu}_{ch}$
. We define
 ${\it\mu}_{ch}$
, and the corresponding
 $f(c)$
and
 $R$
, appropriately in § 4 while discussing the numerical results obtained from LSA and DNS.
2.3. Initial and boundary conditions
A description of appropriate initial and boundary conditions makes the mathematical formulation of the above problem complete. In the Lagrangian frame of reference the initial conditions for the concentration and velocity can be written as
 $$\begin{eqnarray}c=\left\{\begin{array}{@{}ll@{}}1,\quad & \text{for }x<0\\ 0,\quad & \text{for }x\geqslant 0\end{array}\right.\quad \text{ and }\boldsymbol{u}=(0,0).\end{eqnarray}$$
Along the longitudinal boundaries we have
 $\boldsymbol{u}=(0,0)$
and
 $\partial c/\partial x\rightarrow 0$
as
 $x\rightarrow \pm \infty$
, while the transverse boundary conditions are
 $\partial v/\partial y=0$
(constant pressure, cf. Nield & Bejan Reference Nield and Bejan1992) and
 $\partial c/\partial y\rightarrow 0$
.
3. Linear stability analysis
In this section we discuss the linear stability analysis of fingering instabilities driven by both viscosity and density contrasts in miscible displacements.
3.1. Stream function formulation
For a two-dimensional flow the continuity equation can be satisfied identically by introducing a stream function,
 ${\it\psi}(x,y,t)$
, such that
 $u=\partial {\it\psi}/\partial y$
and
 $v=-\partial {\it\psi}/\partial x$
. Taking the curl of (2.5) and representing velocities in terms of the stream function, (2.5) and (2.6) are recast as
 $$\begin{eqnarray}\displaystyle & \displaystyle {\rm\nabla}^{2}{\it\psi}=-R\mathscr{D}f(c)(\boldsymbol{{\rm\nabla}}c\boldsymbol{\cdot }\boldsymbol{{\rm\nabla}}{\it\psi}+U\partial _{y}c)+\frac{1}{{\it\mu}(c)}\partial _{y}c, & \displaystyle\end{eqnarray}$$
 $$\begin{eqnarray}\displaystyle & \displaystyle \partial _{t}c+(\partial _{y}{\it\psi})(\partial _{x}c)-(\partial _{x}{\it\psi})(\partial _{y}c)={\rm\nabla}^{2}c, & \displaystyle\end{eqnarray}$$
 $\mathscr{D}\equiv \text{d}/\text{d}c$
.
3.2. Linearized perturbation equations
For the base-state flow we assume
 $\boldsymbol{u}_{b}=0$
, which implies that
 ${\it\psi}_{b}$
is constant, which can be assumed to be equal to
 $0$
without any loss of generality. We also assume that the base-state concentration is homogeneous in the
 $y$
-direction, i.e.
 $c_{b}=c_{b}(x,t)$
. Under these assumptions the base-state flow is given by a decaying error function solution of a step-like initial concentration profile, i.e.
 $c_{b}(x,t)=0.5\;\text{erfc}(x/2\sqrt{t})$
. Introduce infinitesimal perturbations such that
 $c(x,y,t)=c_{b}(x,t)+c^{\prime }(x,y,t)$
and
 ${\it\psi}(x,y,t)={\it\psi}_{b}+{\it\psi}^{\prime }(x,y,t)$
, etc., and substitute these into (3.1) and (3.2) to obtain
 $$\begin{eqnarray}\displaystyle & \displaystyle \partial _{t}c_{b}+\partial _{t}c^{\prime }+(\partial _{x}c_{b}+\partial _{x}c^{\prime })\partial _{y}{\it\psi}^{\prime }-(\partial _{x}{\it\psi}^{\prime })(\partial _{y}c^{\prime })={\rm\nabla}^{2}c_{b}+{\rm\nabla}^{2}c^{\prime }, & \displaystyle\end{eqnarray}$$
 $$\begin{eqnarray}\displaystyle & \displaystyle {\rm\nabla}^{2}{\it\psi}^{\prime }=-R\mathscr{D}f(c_{b}+c^{\prime })[(\boldsymbol{{\rm\nabla}}c^{\prime }+(\partial _{x}c_{b})\boldsymbol{e}_{y})\boldsymbol{\cdot }\boldsymbol{{\rm\nabla}}{\it\psi}^{\prime }+U\partial _{y}c^{\prime }]+\frac{1}{{\it\mu}(c_{b}+c^{\prime })}\partial _{y}c^{\prime }, & \displaystyle\end{eqnarray}$$
 $\boldsymbol{e}_{y}$
being the unit vector in the
 $y$
-direction. Subtracting the base-state equations from (3.3) and (3.4) we obtain the following coupled nonlinear partial differential equations in terms of the perturbation quantities
 $c^{\prime }$
and
 ${\it\psi}^{\prime }$
:
 $$\begin{eqnarray}\displaystyle & \displaystyle \partial _{t}c^{\prime }+(\partial _{x}c_{b}+\partial _{x}c^{\prime })\partial _{y}{\it\psi}^{\prime }-(\partial _{y}c^{\prime })(\partial _{x}{\it\psi}^{\prime })={\rm\nabla}^{2}c^{\prime }, & \displaystyle\end{eqnarray}$$
 $$\begin{eqnarray}\displaystyle & \displaystyle {\rm\nabla}^{2}{\it\psi}^{\prime }=-R\mathscr{D}f(c)[(\boldsymbol{{\rm\nabla}}c^{\prime }+(\partial _{x}c_{b})\boldsymbol{e}_{y})\boldsymbol{\cdot }\boldsymbol{{\rm\nabla}}{\it\psi}^{\prime }+U\partial _{y}c^{\prime }]+\frac{1}{{\it\mu}(c_{b}+c^{\prime })}\partial _{y}c^{\prime }. & \displaystyle\end{eqnarray}$$
 $$\begin{eqnarray}\displaystyle & \displaystyle \partial _{t}c^{\prime }+\partial _{x}c_{b}\partial _{y}{\it\psi}^{\prime }={\rm\nabla}^{2}c^{\prime }, & \displaystyle\end{eqnarray}$$
 $$\begin{eqnarray}\displaystyle & \displaystyle {\rm\nabla}^{2}{\it\psi}^{\prime }=-R\mathscr{D}f(c)[(\partial _{x}c_{b})(\partial _{x}{\it\psi}^{\prime })+U\partial _{y}c^{\prime }]+\frac{1}{{\it\mu}(c_{b})}\partial _{y}c^{\prime }. & \displaystyle\end{eqnarray}$$
 $c^{\prime }(x,y,t)$
and
 ${\it\psi}^{\prime }(x,y,t)$
, and calculate the growth rates associated with concentration and velocity perturbations (Kumar & Homsy Reference Kumar and Homsy1999; Hota et al. Reference Hota, Pramanik and Mishra2015b
),
 $$\begin{eqnarray}\displaystyle {\it\sigma}_{c}=\frac{1}{2E_{c^{\prime }}}\frac{\text{d}E_{c^{\prime }}}{\text{d}t},\quad {\it\sigma}_{V}=\frac{1}{2E_{v^{\prime }}}\frac{\text{d}E_{v^{\prime }}}{\text{d}t},\quad {\it\sigma}=\frac{1}{2E}\frac{\text{d}E}{\text{d}t}, & & \displaystyle\end{eqnarray}$$
from the amplification measures defined as (Hota et al. Reference Hota, Pramanik and Mishra2015b )
 $$\begin{eqnarray}E_{c^{\prime }}=\iint (c^{\prime })^{2}\,\text{d}x\,\text{d}y,\quad E_{v^{\prime }}=\iint [(\partial _{y}{\it\psi}^{\prime })^{2}+(\partial _{x}{\it\psi}^{\prime })^{2}]\,\text{d}x\,\text{d}y,\quad E=E_{c^{\prime }}+E_{v^{\prime }}.\end{eqnarray}$$
Following Hota et al. (Reference Hota, Pramanik and Mishra2015b
) we have used
 ${\it\sigma}$
(defined in (3.9a−c
)) to quantify the growth rate of disturbances and the onset of instability.
Note that Daniel & Riaz (Reference Daniel and Riaz2014) used the domain depth as the characteristic length scale. This results a computational domain having depth of unit size, and the Rayleigh number as a model parameter. On the other hand, in the present paper we choose the characteristic length to be the intrinsic finger length scale, which yields a unit Rayleigh number (compare (2.6) with equation (3) of Daniel & Riaz Reference Daniel and Riaz2014). In all the computations of the present paper the depth of the computational domain is taken sufficiently large that the dynamics is unaffected by the influence of the top and bottom boundaries of the domain.
4. Results and discussion
In this section we discuss the numerical results and their physical interpretation for different flow parameters. In the absence of viscosity contrast, convective instability occurs at the miscible interface when a heavier fluid is placed above a lighter fluid. This hydrodynamic instability is broadly known as density fingering (DF) in the literature. How is this convective instability modified when the viscosity of the underlying fluids are different?
Daniel & Riaz (Reference Daniel and Riaz2014) presented fixed interface and moving interface methods to compare the natural convection (
 $U=0$
) when the dynamic viscosity of the upper fluid is more than or less than that of the lower fluid. With the help of the moving interface method they showed that the onset of instability is delayed when the dynamic viscosity increases with depth compared to the case of viscosity-matched fluids. On the other hand, the instability sets in earlier when the dynamic viscosity decreases with depth. This is contrary to the situation of classical viscous fingering instability in neutrally buoyant fluids.
We revisit the problem of a moving interface (cf. Daniel & Riaz Reference Daniel and Riaz2014) to analyze the influence of viscosity contrast on the stability of a buoyantly unstable miscible layer. Two different cases are considered: (i) the upper fluid is more viscous than the lower one, and (ii) the lower fluid is more viscous than the upper one. To obtain these physical configurations, the dynamic viscosities of the upper and lower fluids are interchanged, while keeping the other physical properties unaltered. Here we investigate the influence of the viscosity contrast on buoyantly unstable miscible fluids for both
 $U=0$
and
 $U\neq 0$
, respectively, in §§ 4.1 and 4.2.
4.1. Effect of viscosity contrast in the absence of displacement
We choose the characteristic viscosity
 ${\it\mu}_{ch}={\it\mu}_{l}$
, where
 ${\it\mu}_{l}$
corresponds to the dynamic viscosity of the less viscous fluid. For example,
 ${\it\mu}_{ch}={\it\mu}_{upp}$
(or
 ${\it\mu}_{ch}={\it\mu}_{low}$
) when
 ${\it\mu}_{upp}<{\it\mu}_{low}$
(or
 ${\it\mu}_{low}<{\it\mu}_{upp}$
). In this case the linear function
 $f(c)$
and the log-mobility ratio
 $R$
are defined as
 $$\begin{eqnarray}f(c)=\left\{\begin{array}{@{}ll@{}}1-c,\quad & \text{if }{\it\mu}_{upp}<{\it\mu}_{low}\\ c,\quad & \text{if }{\it\mu}_{upp}>{\it\mu}_{low}\end{array}\right.,\quad R=\ln \left(\frac{{\it\mu}_{m}}{{\it\mu}_{l}}\right),\end{eqnarray}$$
respectively, where
 ${\it\mu}_{m}$
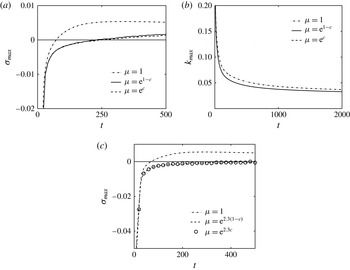
corresponds to the viscosity of the more viscous fluid. A linear stability analysis is performed for
 $R=1$
and
 $U=0$
. The temporal evolution of the maximum growth rate,
 ${\it\sigma}_{max}$
, and the dominant wavenumber,
 $k_{max}$
, of the perturbation quantities are shown in figure 2. Figure 2(a) shows that the onset happens earliest for the classical DF case compared to the situations when the viscosity of the two fluids are different. Moreover, the temporal evolution of the growth rates obtained for different viscosity contrasts are visually almost indistinguishable. The physical explanation for a different onset time of instability in flow with or without viscosity contrast in buoyantly unstable miscible fluids can be presented in terms of the instantaneous vorticity perturbation field as discussed by Daniel & Riaz (Reference Daniel and Riaz2014). From figure 2(b) it is identified that for all time the most unstable wavenumbers are larger in the absence of the viscosity contrast compared to the situation when the viscosity of the two fluids are different. In order to explore the influence of
 $R$
, the temporal evolution of
 ${\it\sigma}_{max}$
is presented in figure 2(c) for
 $R=2.3$
. The general trend of stabilization of density fingers due to viscosity contrast is observed in this case. It also shows that the onset is more delayed as
 $R$
increases. Thus, we conclude that for
 $U=0$
the viscous force induces stability in the classical DF instability in a vertical porous medium.
(a) Maximum growth rate
 ${\it\sigma}_{max}$
and (b) dominant wavenumber
 $k_{max}$
, for
 $R=1,U=0$
; (c) maximum growth rate
 ${\it\sigma}_{max}$
for
 $R=2.3,U=0$
.

From § 2.2 it is clearly observed that all the characteristic scales are derived using the characteristic viscosity. Daniel & Riaz (Reference Daniel and Riaz2014) chose
 ${\it\mu}_{ch}={\it\mu}_{upp}$
for both the more and less viscous upper fluid, so that the viscosity–concentration relation (2.7) takes the form
 ${\it\mu}(c)=\text{e}^{R(1-c)}$
, where
 $R=\ln ({\it\mu}_{low}/{\it\mu}_{upp})$
. Therefore,
 $R>0$
(or
 $R<0$
) corresponds to the less (or more) viscous upper fluid. Such a choice of the characteristic viscosity generates different magnitudes of the length, time and velocity scales for the respective problem of more or less viscous upper fluid. Let us consider the displacement of a less viscous fluid by a more viscous one, i.e. the mobility ratio
 $m={\it\mu}_{low}/{\it\mu}_{upp}<1$
. Following the choice of the characteristic viscosity of Daniel & Riaz (Reference Daniel and Riaz2014), this displacement flow can be represented by
 ${\it\mu}(c)=\text{e}^{R(1-c)}$
, where
 $R=\ln m<0$
. On the other hand, using the present characteristic viscosity it is represented by
 ${\it\mu}(c)=\text{e}^{Rc}$
, where
 $R=\ln (1/m)>0$
. Writing the characteristic length, time, velocity and dynamic viscosity, corresponding to
 ${\it\mu}(c)=\text{e}^{Rc},R>0$
as
 $L_{ch}^{+},{\it\tau}_{ch}^{+},V_{ch}^{+}$
and
 ${\it\mu}_{ch}^{+}$
, and those for
 ${\it\mu}(c)=\text{e}^{R(1-c)},R<0$
as
 $L_{ch}^{-},{\it\tau}_{ch}^{-},V_{ch}^{+}-$
and
 ${\it\mu}_{ch}^{-}$
, respectively, we have
 $$\begin{eqnarray}{\it\mu}_{ch}^{-}/{\it\mu}_{ch}^{+}=1/m,\quad V_{ch}^{-}/V_{ch}^{+}=m,\quad L_{ch}^{-}/L_{ch}^{+}=1/m,\quad {\it\tau}_{ch}^{-}/{\it\tau}_{ch}^{+}=1/m^{2}.\end{eqnarray}$$
This reveals that for a given set of dimensional values of the displacement velocity, domain length and time, respective dimensionless values corresponding to
 ${\it\mu}_{ch}={\it\mu}_{upp}$
and
 ${\it\mu}_{ch}={\it\mu}_{low}$
are different as shown in the bottom row of table 1. This table also depicts the dimensionless values of the above-mentioned quantities for the displacement flow when
 ${\it\mu}_{upp}<{\it\mu}_{low}$
, equivalently
 $m>1$
. It is observed that when
 ${\it\mu}_{ch}={\it\mu}_{l}$
, the dimensionless values of different quantities are the same for the cases of both
 ${\it\mu}_{upp}<{\it\mu}_{low}$
and
 ${\it\mu}_{low}<{\it\mu}_{upp}$
. It is evident that one should consider the magnitude of the dimensionless length, time, velocity, etc. according to table 1. However, Daniel & Riaz (Reference Daniel and Riaz2014) used
 $U,L$
and
 $t$
as the dimensionless values for both
 $R>0$
and
 $R<0$
(see figures 4, 5 and 12(a), etc. of Daniel & Riaz Reference Daniel and Riaz2014).
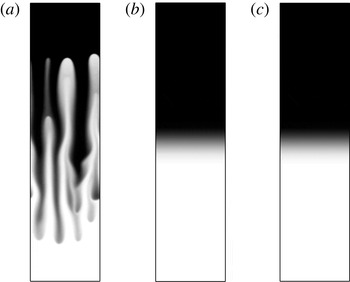
Spatial distribution of the solute concentration for
 $U=0$
: (a)
 ${\it\mu}(c)=\text{e}^{-2.3(1-c)}$
at
 $t=2\times 10^{3}$
, (b)
 ${\it\mu}(c)=\text{e}^{2.3c}$
at
 $t=10^{4}$
and (c)
 ${\it\mu}(c)=\text{e}^{-2.3(1-c)}$
at
 $m^{2}t=10^{4}/10^{2}=10^{2}$
.

The log-mobility ratio (
 $R$
), dimensionless velocity (Vel.), dimensionless length (Len.) and dimensionless time (Time) corresponding to two different viscosity scales are shown for a given set of dimensional values. Here
 $U=\hat{U} /V_{ch}^{+},L=\hat{L}/L_{ch}^{+}$
and
 $t=\hat{t}/{\it\tau}_{ch}^{+}$
, with
 $\hat{\cdot }$
denoting the dimensional value of the respective variable. Recall that Daniel & Riaz (Reference Daniel and Riaz2014) used convective length and time scales for which
 ${\it\tau}_{ch}^{-}={\it\tau}_{ch}^{+}/m,V_{ch}^{-}=mV_{ch}^{+},L_{ch}^{-}=L_{ch}^{+}$
.

In order to understand the influence of viscosity scaling we consider the problem of viscous stabilization of buoyantly unstable miscible layers, i.e.
 $m={\it\mu}_{low}/{\it\mu}_{upp}<1$
, such that
 ${\it\mu}_{ch}={\it\mu}_{upp}$
results in
 ${\it\mu}(c)=\text{e}^{R(1-c)}$
with
 $R=\ln m<0$
, while
 ${\it\mu}_{ch}={\it\mu}_{low}$
corresponds to
 ${\it\mu}(c)=\text{e}^{Rc}$
with
 $R=\ln (1/m)>0$
. Therefore, suitably choosing the length, time and velocity of the flow problems, one would expect to identify the same results for
 $R<0$
and
 $R>0$
. In order to illustrate this fact, we choose
 $U=0$
and
 $m=0.1$
so that
 $|R|\approx 2.3$
and perform DNS using a Fourier pseudo-spectral method (Tan & Homsy Reference Tan and Homsy1988) to support our theoretical analysis. The numerical results obtained are depicted in figure 3(a–c). Figure 3(a), which corresponds to the viscosity scaling applied by Daniel & Riaz (Reference Daniel and Riaz2014), i.e.
 ${\it\mu}(c)=\text{e}^{-2.3(1-c)}$
, shows that the diffusive interface features fingers. On the other hand, DNS results corresponding to
 ${\it\mu}_{ch}={\it\mu}_{low}$
(i.e.
 ${\it\mu}(c)=\text{e}^{2.3c}$
) depict pure diffusive expansion of the miscible interface (see figure 3
b). We also perform DNS corresponding to
 ${\it\mu}(c)=\text{e}^{-2.3(1-c)}$
with rescaled length and time scales according to the above-mentioned relations (see (4.2a−d
)). The spatial distribution of the solute concentration at
 $m^{2}t=10^{2}$
is shown in figure 3(c), which is identical to figure 3(b). From linear theory we have identified that the dynamics of the systems for more and less viscous upper fluid are indistinguishable. The analogous results can also be found in the nonlinear regime through DNS. Thus, we conclude that the scaling analysis of Daniel & Riaz (Reference Daniel and Riaz2014) does not provide the correct information when comparing the displacement of a more viscous fluid by a less viscous one with the displacement of a less viscous fluid by a more viscous one.
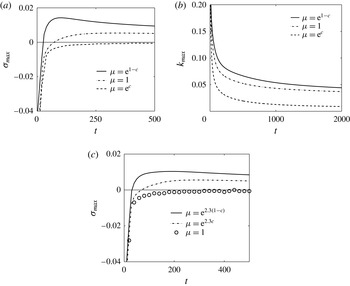
(a) Maximum growth rate
 ${\it\sigma}_{max}$
and (b) dominant wavenumber
 $k_{max}$
, for
 $R=1,U=1$
; (c) maximum growth rate
 ${\it\sigma}_{max}$
for
 $R=2.3,U=0.5$
.

4.2. Influence of the displacement velocity
Next, we consider the displacement of the lower fluid by the upper one. The influence of both the stable and unstable viscosity contrasts are discussed through LSA as well as DNS. Figure 4(a,b) shows the temporal evolution of
 ${\it\sigma}_{max}$
and
 $k_{max}$
for the same parameters as those of figure 2(a,b), except for
 $U=1$
. It is identified that the dynamics of buoyancy-induced instability in viscosity-matched fluids is unaffected by the dimensionless displacement velocity, hence the onset of instability is the same for
 $U=0$
(dash-dotted line in figure 2
a) and
 $U=1$
(dash-dotted line in figure 4
a) when
 ${\it\mu}(c)=1$
. Figure 4(a) shows that instability sets in earlier when the less viscous heavier fluid at the top displaces the more viscous lighter fluid at the bottom. The unfavourable viscosity contrast coupled with the buoyancy force enhances the instability, which is readily evident from the fact that for all time the growth rate of the perturbations for
 ${\it\mu}(c)=\text{e}^{1-c}$
is larger than the respective value when
 ${\it\mu}(c)=1$
(see figure 4
a). On the other hand, for
 ${\it\mu}(c)=\text{e}^{c}$
the favourable viscosity contrast acts against the instability induced by the buoyancy force and the displacement becomes stable (see figure 4
a). Figure 4(b) illustrates that at a given time and for the parameter values scanned here, the most unstable wavenumber
 $k_{max}$
is the largest for
 ${\it\mu}(c)=\text{e}^{1-c}$
and smallest for
 ${\it\mu}(c)=\text{e}^{c}$
. In other words, at a given time
 $k_{max}$
increases with
 $m$
. Such influences of the viscosity contrast on the stability of buoyantly unstable miscible fluids are similar to those in neutrally buoyant fluids, i.e. in the case of the viscous fingering (VF) instability (Homsy Reference Homsy1987). Figure 4(c) shows the temporal evolution of
 ${\it\sigma}_{max}$
for
 $R=2.3$
and
 $U=0.5$
. It is observed that compared to the density fingers in viscosity-matched fluids, instability sets in earlier (later) as viscosity increases (decreases) with the depth. In summary, for neutrally buoyant as well as buoyantly unstable miscible fluids an unfavourable viscosity contrast enhances the instability, whereas a favourable viscosity contrast weakens the instability, when the upper fluid displaces the lower one. This trend of the onset of instability and the dynamics of the displacement flows holds in general for different
 $R$
and
 $U$
.
In § 4.1 we showed, for
 $U=0$
, that the dimensionless length and time should be chosen carefully when comparing between
 $R>0$
and
 $R<0$
. Here we continue a similar analysis for
 $U\neq 0$
. As an example we choose
 $U=0.5$
, and perform DNS when the dynamic viscosity of the upper fluid is more than or less than the lower one. Following Daniel & Riaz (Reference Daniel and Riaz2014) we choose
 ${\it\mu}_{ch}={\it\mu}_{upp}$
and compare the dynamics for a less viscous upper fluid, i.e.
 ${\it\mu}(c)=\text{e}^{2.3(1-c)}$
(see figure 5
a) with that of the more viscous upper fluid, i.e.
 ${\it\mu}(c)=\text{e}^{-2.3(1-c)}$
(see figure 5
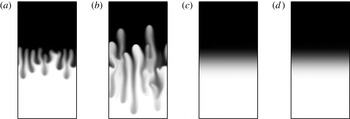
b). Counter-intuitive results, that the displacement of a less viscous fluid by a more viscous one features stronger instability than the displacement of a more viscous fluid by a less viscous one, are identified. Next we take
 ${\it\mu}_{ch}={\it\mu}_{l}$
, such that the displacement of more viscous fluid at the bottom by less viscous fluid at the top is represented by
 ${\it\mu}(c)=\text{e}^{2.3c}$
and the corresponding spatial distribution of the solute concentration is presented in figure 5(c). It shows that the miscible interface features only diffusive expansion. Further, we perform numerical simulations for
 ${\it\mu}(c)=\text{e}^{-2.3(1-c)}$
but with rescaled dimensionless velocity, length and time as given in table 1. The result obtained from DNS is depicted in figure 5(d), which is indistinguishable from figure 5(c). This signifies the importance of an appropriate viscosity scaling when comparing the influence of the more or less viscous fluid at the top on the dynamics of a buoyantly unstable miscible interface.
The discussion of figures 2–5 illustrates that a simple and convenient choice of
 ${\it\mu}_{ch}$
is the dynamic viscosity of the less viscous fluid, i.e.
 ${\it\mu}_{l}$
, which preserves the same magnitude for the dimensionless length, time, velocity, etc. for a more or less viscous upper fluid. In the rest of the paper we choose
 ${\it\mu}_{ch}={\it\mu}_{l}$
, such that the viscosity–concentration relation is given by (4.1a,b
).
Spatial distribution of the solute concentration: (a)
 ${\it\mu}(c)=\text{e}^{2.3(1-c)},U=0.5$
at
 $t=2\times 10^{3}$
; (b)
 ${\it\mu}(c)=\text{e}^{-2.3(1-c)},U=0.5$
at
 $t=2\times 10^{3}$
; (c)
 ${\it\mu}(c)=\text{e}^{2.3c},U=0.5$
at
 $t=10^{4}$
; (d)
 ${\it\mu}(c)=\text{e}^{-2.3(1-c)},mU=0.5\times 10=5$
at
 $m^{2}t=10^{4}/10^{2}=10^{2}$
.

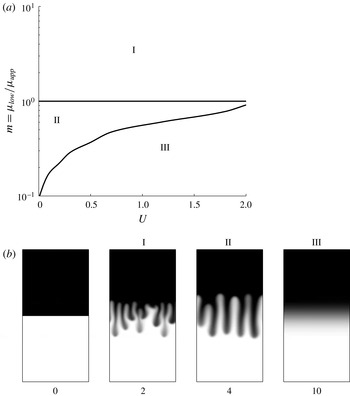
(a) Different stability regions in phase space spanned by the displacement velocity,
 $U$
, and viscosity ratio,
 $m={\it\mu}_{low}/{\it\mu}_{upp}$
. Regions I and II correspond to the instabilities dominated by buoyancy and viscosity, respectively, while the stable region is denoted by III. (b) Snapshots of the solute concentration
 $c$
corresponding to the different stability regions. The number beneath each frame corresponds to
 $t/10^{3}$
.

The stability scenarios in the phase space spanned by the displacement velocity,
 $U$
, and the mobility ratio,
 $m={\it\mu}_{low}/{\it\mu}_{upp}$
, are shown in figure 6(a). The parameter space can be divided into three distinct regions depending on the stability characteristics. The buoyancy- and viscosity-dominated instability regions are denoted by I and II, respectively, and the stable region is represented by region III. For the viscosity-matched fluids (i.e.
 $m=1$
) the diffusive interface is buoyantly unstable and the growth rates of the perturbations are indistinct for all possible values of the dimensionless displacement velocity,
 $U$
. For
 $m>1$
, i.e. when a less viscous heavier fluid at the top displaces a more viscous lighter one at the bottom, the instability at the diffusive interface is driven by both the viscosity and density contrasts, and the instability increases with
 $m$
as well as
 $U$
. On the other hand, for
 $m<1$
, i.e. for viscous stabilization of the buoyantly unstable diffusive interface, the instability becomes weak as
 $m$
decreases or
 $U$
increases, and finally becomes stable when
 $U$
(or
 $m$
) is larger (or smaller) than a certain critical value. Figure 6(b) shows snapshots of the spatial structure of the solute concentration for each of these three instability regions along with the initial distribution of the solute concentration.
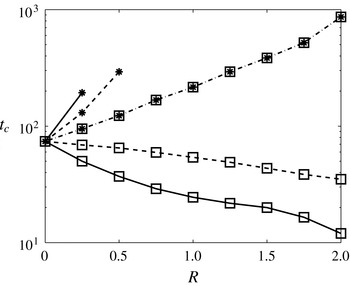
Effect of viscosity contrast on the onset time,
 $t_{c}$
, for different dimensionless displacement velocity:
 $U=1$
(solid line),
 $U=0.5$
(dashed line) and
 $U=0$
(dash-dotted line). Lines with squares (▫) correspond to
 ${\it\mu}(c)=\text{e}^{R(1-c)}$
and those with asterisks (*) correspond to
 ${\it\mu}(c)=\text{e}^{Rc}$
.

The influence of the viscosity contrast on the onset of instability is depicted in figure 7. This figure shows that, in the absence of displacement (
 $U=0$
), the onset of instability is delayed with the viscosity contrast, irrespectively of whether the heavier fluid is less viscous or more viscous. The present results have qualitative similarities with those of Daniel & Riaz (Reference Daniel and Riaz2014) when a less viscous heavier fluid is placed over a more viscous lighter fluid. These authors used
 ${\it\mu}_{upp}$
as the characteristic viscosity and showed that, for
 $U=0$
, the onset time increases with mobility ratio
 $m={\it\mu}_{low}/{\it\mu}_{upp}$
. More surprisingly, they found an early onset of instability with stable viscosity contrasts (
 $m<1$
) and
 $U>0$
, compared to a buoyantly unstable miscible interface between viscosity-matched fluids, i.e.
 $m=1$
(see figure 12a of Daniel & Riaz Reference Daniel and Riaz2014).
This result is contradictory to the claim of Manickam & Homsy (Reference Manickam and Homsy1995) that a buoyantly unstable miscible interface can be stabilized by suitably choosing the viscosity contrast and the displacement velocity. However, the viscous stabilization of the density fingers is not properly quantified by Manickam & Homsy (Reference Manickam and Homsy1995). Introducing the notion of local critical velocity
 $u_{c}$
, Manickam & Homsy (Reference Manickam and Homsy1995) showed that a potential upstream stable zone appears when the viscosity decreases with the depth. Through DNS they proved that the upward moving density fingers are mitigated by this stable zone; however, the overall stabilization of the flow is not quantified. Instead, it is observed that the total mixing length increases as the mobility ratio
 $m={\it\mu}_{low}/{\it\mu}_{upp}\;({<}1)$
decreases (see figure 9 of Manickam & Homsy Reference Manickam and Homsy1995), which signifies that the instability becomes stronger when
 $m\;({<}1)$
decreases. This is attributed to the fact that Manickam & Homsy (Reference Manickam and Homsy1995) did not take the viscosity scaling into account. The present LSA results successfully capture the viscous stabilization of the density fingers (see figure 4). The onset of instability as a function of the log-mobility ratio, both for more and less viscous upper fluid, is depicted in figure 7. It is identified that the instability sets in earlier with increasing
 $R$
when a less viscous fluid displaces a more viscous fluid. On the other hand, during the displacement of less viscous fluid by a more viscous one, onset time increases with
 $R$
and the displacement becomes completely stable above a threshold value of
 $R$
, which depends on the injection velocity
 $U$
.
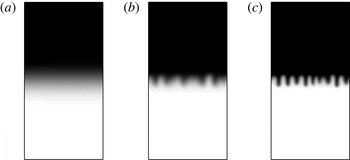
In order to confirm the present linear stability results, DNS are performed for the parameter values used in figure 4. The spatial distribution of the concentration for displacements with and without viscosity contrast are shown in figure 8. This figure shows that a buoyantly unstable diffusive interface of viscosity-matched fluids (figure 8 b) becomes stable when the dynamic viscosity of the upper fluid is more (figure 8 a). On the other hand, the instability becomes stronger when a less viscous fluid at the top displaces a more viscous fluid at the bottom (figure 8 c).
Spatial distribution of the concentration,
 $c$
, for
 $U=1$
: (a)
 ${\it\mu}(c)=\text{e}^{c}$
at
 $t=10^{4}$
, (b)
 ${\it\mu}(c)=1$
at
 $t=2.4\times 10^{3}$
and (c)
 ${\it\mu}(c)=\text{e}^{(1-c)}$
at
 $t=10^{3}$
.

4.3. Non-orthogonality of eigenmodes and transient growth
Here, we briefly discuss the possible transient growth of the disturbances to the unsteady base state
 $c_{b}(x,t)=0.5\;\text{erfc}(x/2\sqrt{t})$
. Manickam & Homsy (Reference Manickam and Homsy1995) presented an LSA based on a modal analysis under the assumption of a quasi-steady-state approximation (QSSA). However, the QSSA modes are non-orthogonal (Rapaka et al.
Reference Rapaka, Chen, Pawar, Stauffer and Zhang2008; Hota et al. Reference Hota, Pramanik and Mishra2015a
) and thus these eigenvalues do not reveal the interesting transient behaviour (Schmid Reference Schmid2007). Further, Trefethen et al. (Reference Trefethen, Trefethen, Redddy and Driscoll1993) reported that the transient growth in a stable linearized system has implications for the behaviour of the associated nonlinear system.
To quantify the degree of non-orthogonality of the eigenmodes obtained from modal analysis we study the linear stability of the unsteady base state
 $c_{b}(x,t)$
with respect to small wave-like perturbations of the form
 $$\begin{eqnarray}(c^{\prime },u^{\prime })(x,y,t)=({\it\phi}_{c},{\it\phi}_{u})(x,t)\exp (\text{i}ky),\end{eqnarray}$$
where
 $\text{i}=\sqrt{-1}$
,
 $k$
is the non-dimensional wavenumber in the
 $y$
direction, and
 ${\it\phi}_{c}(x,t),{\it\phi}_{u}(x,t)$
are time-dependent concentration and velocity perturbations, respectively. Following the standard procedure (Homsy Reference Homsy1987; Pramanik & Mishra Reference Pramanik and Mishra2015), the linear stability equations in a similarity transformation
 $({\it\xi},t)$
-domain can be written as an IVP for
 ${\it\phi}_{c},{\it\phi}_{u}$
:
 $$\begin{eqnarray}\displaystyle & \displaystyle \frac{\partial {\it\phi}_{c}}{\partial t}=\left\{\!\left(\frac{1}{t}\frac{\partial ^{2}}{\partial {\it\xi}^{2}}-k^{2}\right)+\frac{{\it\xi}}{2t}\frac{\partial }{\partial {\it\xi}}\right\}{\it\phi}_{c}-\frac{1}{\sqrt{t}}\frac{\text{d}c_{b}}{\text{d}{\it\xi}}{\it\phi}_{u}, & \displaystyle\end{eqnarray}$$
 $$\begin{eqnarray}\displaystyle & \displaystyle \left(\frac{\partial ^{2}}{\partial {\it\xi}^{2}}+R\,f^{\prime }(c_{b})\frac{\partial }{\partial {\it\xi}}-k^{2}t\right){\it\phi}_{u}=k^{2}t\left(UR\,f^{\prime }(c_{b})-\frac{{\it\rho}^{\prime }(c_{b})}{{\it\mu}_{0}}\right){\it\phi}_{c}, & \displaystyle\end{eqnarray}$$
 ${\it\xi}=x/\sqrt{t}$
is the similarity variable. A finite difference approximation of the linearized operators followed by elimination of
 ${\it\phi}_{u}$
from (4.4) and (4.5) yields a non-autonomous system of ordinary differential equations:
 $$\begin{eqnarray}\frac{\text{d}{\it\phi}_{c}}{\text{d}t}=\unicode[STIX]{x1D63C}(k,t){\it\phi}_{c},\quad {\it\phi}_{c}({\it\xi},t_{i})={\it\phi}_{c}^{0}({\it\xi}),\quad -\infty <{\it\xi}<\infty ,\end{eqnarray}$$
where
 $t_{i}$
corresponds to the initial time, when perturbations are introduced, and
 $\unicode[STIX]{x1D63C}(k,t)$
is the time-dependent matrix.
For the given matrix
 $\unicode[STIX]{x1D63C}(k,t)$
, we would like to have an effective way to determine whether one should be concerned about the effects of non-normality. The simplest quantitative approach often used for characterizing normality is
 ${\it\kappa}(\unicode[STIX]{x1D651})\equiv \Vert \unicode[STIX]{x1D651}\Vert _{2}\;\Vert \unicode[STIX]{x1D651}^{-1}\Vert _{2}$
, the condition number of the eigenvector matrix
 $\unicode[STIX]{x1D651}$
associated with
 $\unicode[STIX]{x1D63C}(k,t)$
(Golub & van Loan Reference Golub and van Loan2007). Here
 $\Vert \cdot \Vert _{2}$
corresponds to the standard Euclidean norm. It can be shown that for a normal matrix
 $\unicode[STIX]{x1D63C}(k,t)$
the condition number
 ${\it\kappa}(\unicode[STIX]{x1D651})$
is 1. In order to quantify the potential transient growth of disturbances and non-normality of
 $\unicode[STIX]{x1D63C}(k,t)$
associated with the IVP (4.6a,b
), first we compute
 ${\it\kappa}(\unicode[STIX]{x1D651})$
and then the spectral abscissa and the numerical abscissa, denoted by
 ${\it\alpha}(\unicode[STIX]{x1D63C})$
and
 ${\it\eta}(\unicode[STIX]{x1D63C})$
, respectively, defined as
 $$\begin{eqnarray}\displaystyle & \displaystyle {\it\alpha}(\unicode[STIX]{x1D63C})\equiv \max \{\text{Re}({\it\lambda}(\unicode[STIX]{x1D63C}))\}, & \displaystyle\end{eqnarray}$$
 $$\begin{eqnarray}\displaystyle & \displaystyle {\it\eta}(\unicode[STIX]{x1D63C})\equiv \max \{{\it\lambda}(\unicode[STIX]{x1D63C}+\unicode[STIX]{x1D63C}^{\text{T}})/2\}. & \displaystyle\end{eqnarray}$$
 $\unicode[STIX]{x1D63C}=\unicode[STIX]{x1D63C}(k,t)$
,
 ${\it\lambda}(\cdot )$
represents the eigenvalue of the respective matrices,
 $\text{Re}(\cdot )$
denotes the real part and
 $\unicode[STIX]{x1D63C}^{\text{T}}$
denotes the transpose of the matrix
 $\unicode[STIX]{x1D63C}$
. The numerical abscissa
 ${\it\eta}(\unicode[STIX]{x1D63C})$
measures the maximum possible instantaneous growth rate corresponding to any initial condition as
 $t\rightarrow 0$
(Trefethen & Embree Reference Trefethen and Embree2005). It is important to note that for a normal matrix
 ${\it\alpha}(\unicode[STIX]{x1D63C})={\it\eta}(\unicode[STIX]{x1D63C})$
. The scalar measures
 ${\it\lambda}(\cdot )$
and
 ${\it\kappa}(\cdot )$
of non-normality of the matrix
 $\unicode[STIX]{x1D63C}(k,t)$
are computed using the MATLAB routines eig and cond, respectively.
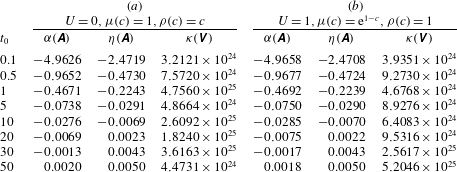
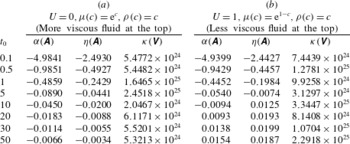
The effect of non-normality in terms of the condition number, numerical abscissa and spectral abscissa for various flow conditions are summarized in tables 2 and 3. The time-dependent matrix
 $\unicode[STIX]{x1D63C}$
is frozen at different times and the computed
 ${\it\alpha}(\unicode[STIX]{x1D63C}),{\it\eta}(\unicode[STIX]{x1D63C})$
and
 ${\it\kappa}(\unicode[STIX]{x1D651})$
are tabulated in table 2 for classical VF of neutrally buoyant fluids and DF of viscosity-matched fluids for a given wavenumber
 $k=0.1$
. For the case of VF the displacement velocity is taken as the characteristic velocity, such that
 $U=1$
, and the log-mobility ratio is
 $R=1$
. Next, we consider the influence of viscosity contrast on buoyantly unstable miscible fluids for
 $U=0$
as well as
 $U\neq 0$
. Table 3 compares two cases: (i)
 ${\it\mu}(c)=\text{e}^{c},{\it\rho}(c)=c,U=0$
and (ii)
 ${\it\mu}(c)=\text{e}^{1-c},{\it\rho}(c)=c,U=1$
. Since
 ${\it\kappa}(\unicode[STIX]{x1D651})$
is very large for all the cases discussed here, a substantial non-modal growth of the disturbances at early time can be anticipated, and this is confirmed from the difference between
 ${\it\alpha}(\unicode[STIX]{x1D63C})$
and
 ${\it\eta}(\unicode[STIX]{x1D63C})$
during the initial period. Table 2 shows that the order of non-normality is almost equal for these two cases. From table 3 it is identified that for
 $U=0$
both
 ${\it\alpha}(\unicode[STIX]{x1D63C})$
and
 ${\it\eta}(\unicode[STIX]{x1D63C})$
are negative, which signifies that in the presence of the viscosity contrast onset of instability is delayed. On the other hand, for
 $U\neq 0$
instability is enhanced. These results are consistent with our observations from LSA as well as DNS discussed in §§ 4.1 and 4.2.
For a given wavenumber
 $k=0.1$
, the variation of spectral abscissa
 ${\it\alpha}(\unicode[STIX]{x1D63C})$
, numerical abscissa
 ${\it\eta}(\unicode[STIX]{x1D63C})$
, and the condition number of eigenvector matrix
 ${\it\kappa}(\unicode[STIX]{x1D651})$
, at different frozen time
 $t_{0}$
: (a) DF in viscosity-matched fluids, (b) VF in density-matched fluids.

For a given wavenumber
 $k=0.1$
, the variation of spectral abscissa
 ${\it\alpha}(\unicode[STIX]{x1D63C})$
, numerical abscissa
 ${\it\eta}(\unicode[STIX]{x1D63C})$
, and the condition number of eigenvector matrix
 ${\it\kappa}(\unicode[STIX]{x1D651})$
, at different frozen time
 $t_{0}$
: (a) the influence of a stable viscosity contrast in the absence of displacement, (b) the influence of an unstable viscosity contrast in the presence of displacement.

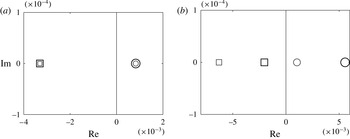
Numerical abscissa (○) and spectral abscissa (▫): (a)
 $k=0.05$
,
 $U=0$
,
 $R=1$
,
 $t_{0}=50$
; (b)
 $k=0.05,U=0.5,R=0.25,t_{0}=30$
. Viscosity–concentration relation is colour coded:
 ${\it\mu}(c)=\text{e}^{Rc}$
(grey) and
 ${\it\mu}(c)=\text{e}^{R(1-c)}$
(black).
 $\text{Re}$
and
 $\text{Im}$
denotes the real and imaginary axis, respectively.

Further, in order to understand the importance of appropriate viscosity scaling in the non-normal growth of the perturbations
 ${\it\alpha}(\unicode[STIX]{x1D63C})$
and
 ${\it\eta}(\unicode[STIX]{x1D63C})$
are plotted in figure 9. Figure 9(a) shows that for a given wavenumber
 $k=0.05$
and
 $U=0$
,
 ${\it\alpha}(\unicode[STIX]{x1D63C})$
and
 ${\it\eta}(\unicode[STIX]{x1D63C})$
corresponding to
 ${\it\mu}(c)=\text{e}^{c}$
are identical to those corresponding to
 ${\it\mu}(c)=\text{e}^{1-c}$
. The influence of the viscosity contrast in the presence of fluid displacement (i.e.
 $U\neq 0$
) on non-normality of the linearized matrix
 $\unicode[STIX]{x1D63C}$
is presented in figure 9(b) for
 $U=0.5,R=0.25$
at
 $t_{0}=30$
. This figure shows that the numerical (spectral) abscissa corresponding to
 ${\it\mu}(c)=\text{e}^{R(1-c)}$
is larger than that corresponding to
 ${\it\mu}(c)=\text{e}^{Rc}$
. Thus, we conclude that by choosing an appropriate characteristic viscosity one can obtain the same non-normal growth of the perturbations associated with the problem of a buoyantly unstable miscible interface both with a stable and unstable viscosity contrast when
 $U=0$
. On the other hand, in the presence of fluid displacement the instability is stronger when the less viscous fluid at the top displaces the more viscous fluid at the bottom. These observations are consistent with the LSA as well as the DNS presented in §§ 4.1 and 4.2 and could be captured only through the scaling analysis discussed in the present paper. Further, it is observed that at large time
 ${\it\alpha}(\unicode[STIX]{x1D63C})$
and
 ${\it\eta}(\unicode[STIX]{x1D63C})$
are very close to each other, but they are not equal. It can be shown that, as
 ${\it\alpha}(\unicode[STIX]{x1D63C})$
approaches
 ${\it\eta}(\unicode[STIX]{x1D63C})$
, the condition number of the largest eigenvalue, i.e.
 ${\it\alpha}(\unicode[STIX]{x1D63C})$
, is
 ${\sim}\!O(1)$
. All the eigenvectors associated with the complete spectrum of
 $\unicode[STIX]{x1D63C}$
contribute to the condition number of the eigenvector matrix
 $\unicode[STIX]{x1D651}$
. From tables 2 and 3 it is observed that
 ${\it\kappa}(\unicode[STIX]{x1D63C})$
is very high even though the non-normality of the linearized operator becomes modest at later time. Mathematically, this means that the matrix
 $\unicode[STIX]{x1D651}$
is not unitary; in other words, the stability matrix
 $\unicode[STIX]{x1D63C}$
is non-normal. Since
 ${\it\eta}(\unicode[STIX]{x1D63C})$
only reflects the growth rate at early time (Trefethen & Embree Reference Trefethen and Embree2005), it is necessary to look beyond these scalar measures, i.e. spectral abscissa, numerical abscissa, and condition number.
In non-modal LSA there are two important aspects of particular interest: the response to external excitations and the transient energy growth of initial conditions. Here we analyse the response to external excitations through the
 ${\it\epsilon}$
-pseudo-spectra of the stability matrix
 $\unicode[STIX]{x1D63C}$
. A matlab GUI EigTool (Wright Reference Wright2002) has been used to draw the pseudo-spectra at the frozen time
 $t_{0}=50$
for the wavenumber
 $k=0.1$
in three different flow conditions. The computational domain is chosen sufficiently large that the numerical results obtained are free from spurious error induced by the boundary effect. It is found that for the parameter values scanned in this paper, the computation domain
 $[-40,40]$
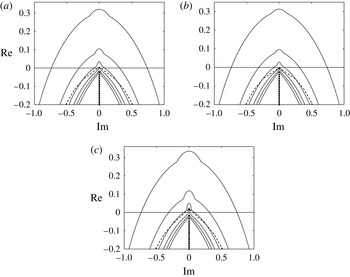
is suitable for the calculation of pseudo-spectra. Figure 10 shows that the numerical range (the dashed line) is substantially larger than the convex hull of the spectrum. We show that, for
 $U=0,{\it\mu}=1,{\it\rho}=c$
(figure 10
a), the spectrum and the boundary of the numerical range intrude into the positive half-plane, which signifies that the flow is unstable at
 $t_{0}=50$
. When a viscosity contrast is introduced into this system, such that
 ${\it\mu}=\text{e}^{c}$
(figure 10
b), the flow becomes stable, which is readily evident from the fact that both the entire spectrum and the numerical range lie within the negative half-plane. Furthermore, when the upper fluid displaces the lower one at
 $U=1$
with unfavourable viscosity contrast, i.e.
 ${\it\mu}=\text{e}^{1-c}$
(figure 10
c), both the spectrum and the numerical range intrude more into the positive half-plane compared to the first case. This reveals that the instability is enhanced in the displacement flow when viscosity increases with the depth.
Pseudo-spectra for
 $R=1,k=0.1$
and
 $t_{0}=50$
: (a)
 $U=0,{\it\mu}(c)=1,{\it\rho}(c)=c$
; (b)
 $U=0,~{\it\mu}(c)=\text{e}^{c},~{\it\rho}(c)=c$
; (c)
 $U=1,{\it\mu}(c)=\text{e}^{1-c},{\it\rho}(c)=c$
. Dots: eigenvalues; dashed line: boundary of numerical range; continuous lines: contours for pseudo-spectra, from outermost to innermost representing levels
 ${\it\epsilon}=10^{-0.8},10^{-1},10^{-1.5},10^{-2},10^{-2.5},10^{-3}$
.

These observations are consistent with tables 2 and 3. Observe that, when the more viscous fluid is lying over the less viscous one (figure 10
b), although the spectrum and the boundary of numerical range lie in the negative half-plane, the pseudo-spectra intrude into the positive half-plane. This suggests that more transient amplification can be possible in this case in comparison to the other two cases shown in figures 10(a) and 10(c). The representation of the pseudo-spectra in figure 10 suggests that the system will be susceptible to transient growth. To estimate the suspected transient amplification, one should calculate the growth function that identifies the optimal growth of energy at some finite time
 $t$
(Schmid Reference Schmid2007), which is beyond the scope of the present study.
To summarize, it is observed that the non-normality of the linearized matrix in the study of hydrodynamic instability driven by buoyancy or viscosity or both is of significant importance at early time. Although the frozen time approach to measuring the degree of non-normality of the time-dependent matrix
 $\unicode[STIX]{x1D63C}$
through
 ${\it\eta}(\unicode[STIX]{x1D63C})$
and/or
 ${\it\kappa}(\unicode[STIX]{x1D651})$
only provides a crude approximation, it can be helpful in obtaining insight into possible non-modal growth of the disturbances. The transient growth of perturbations in a non-autonomous system can be determined efficiently through the propagator or matricant approach (Rapaka et al.
Reference Rapaka, Chen, Pawar, Stauffer and Zhang2008; Hota et al. Reference Hota, Pramanik and Mishra2015a
) or direct adjoint looping (DAL) analysis (Doumenc et al.
Reference Doumenc, Boeck, Guerrier and Rossi2010; Daniel, Tilton & Riaz Reference Daniel, Tilton and Riaz2013), which is beyond the scope of the current study. The determination of the optimal perturbation leading to the instability in such cases is the topic of ongoing research and it is strongly believed that the importance of the scaling analysis discussed in this paper can also be observed in the optimal perturbations.
5. Conclusion
We numerically investigate the influence of viscosity contrast on the buoyantly unstable miscible interface in vertical porous media using an LSA as well as DNS. We show that in the absence of displacement a buoyantly unstable viscous miscible interface is the least stable when the viscosities of two fluids are equal, compared to a variable viscosity interface. In this case instability sets in at the same time for both less and more viscous upper fluid. On the other hand, a less viscous heavier fluid displacing a more viscous lighter fluid features an earlier onset than when the more viscous heavier fluid displaces the less viscous lighter fluid. We also show how a suitable rescaling of the dimensionless length, time and displacement velocity can reproduce the results of Daniel & Riaz (Reference Daniel and Riaz2014) from the present analysis and vice-versa. Thus the importance of an appropriate scaling analysis in fluid mechanics problems is presented by investigating the influence of viscosity contrast on buoyantly unstable miscible fluids in vertical porous media. The principal aim of an LSA is to obtain the onset of instability accurately and to predict the optimal perturbation that leads to the instability. The behaviour of the non-normal operators depends not only on the eigenvalues but also on the structure of the
 ${\it\epsilon}$
-pseudo-spectra. We explore one of the important aspects of a non-modal study, i.e. the effect of external excitation to the system via pseudo-spectra. Using non-modal analysis to determine the optimal growth in buoyantly unstable miscible fluids with viscosity contrast is the subject of further study.
Acknowledgements
S.P. gratefully acknowledges the National Board for Higher Mathematics, Government of India for support through a PhD fellowship. The authors would like to thank Professor M. Embree for valuable discussions on the
 ${\it\epsilon}$
–pseudo-spectra of time-dependent linear operators.