Introduction
Efforts to manage for biological diversity in forested landscapes can benefit from investigations on the nature and extent of old-growth forest dependency among critical taxonomic groups. In western North America, old-growth dependency among rare and threatened vertebrates and vascular plants has received considerable attention from ecologists (Edwards & Ritcey Reference Edwards and Ritcey1960; Dawson et al. Reference Dawson, Ligon, Murphy, Myers, Simberloff and Verner1986; Ruggiero et al. Reference Ruggiero, Aubry, Carey and Huff1991; Thompson Reference Thompson1991; Arsenault & Bradfield Reference Arsenault and Bradfield1995; Halpern & Spies Reference Halpern and Spies1995). Comparable research efforts have yet to be directed to invertebrates, bryophytes, unlichenized fungi, or crustose lichens, although here too the available evidence strongly suggests a high level of sensitivity to the loss of old growth (Esseen et al. Reference Esseen, Ehnström, Ericson and Sjöberg1992; Berg et al. Reference Berg, Ehnström, Gustafsson, Hallinbäck, Jonsell and Welien1994; Goward Reference Goward1994; Arsenault Reference Arsenault2003; Newmaster et al. Reference Newmaster, Belland, Arsenault and Vitt2003; Ellis & Coppins Reference Ellis and Coppins2007; Price et al. Reference Price, Lilles and Banner2017).
Epiphytic macrolichens have received somewhat more attention, again with similar results (e.g. Lesica et al. Reference Lesica, McCune, Cooper and Hong1991; McCune Reference McCune1993; Neitlich Reference Neitlich1993; Goward Reference Goward1994; Rosso & Rosentreter Reference Rosso and Rosentreter1999; Price & Hochachka Reference Price and Hochachka2001; Campbell & Fredeen Reference Campbell and Fredeen2004).
One group deserving closer scrutiny in western North America is the “calicioids” (sensu Tibell Reference Tibell1999), a large polyphyletic assemblage of lichenized and unlichenized Ascomycetes characterized by the presence of stalked and/or powdery (mazaediate) apothecia and mostly growing on the bark or wood of trees (Tibell Reference Tibell1984). The unlichenized species live saprobically on bark, wood, resin or fungi, or are parasitic on lichens or algae. Although our knowledge of calicioid ecology in western North America has hardly advanced beyond the inventory phase (Goward Reference Goward1999; Rikkinen Reference Rikkinen2003), studies in boreal Europe have consistently demonstrated a strong positive correlation between epiphytic calicioid diversity and advanced stand age (Hyvärinen et al. Reference Hyvärinen, Halonen and Kauppi1992; Tibell Reference Tibell1992; Holien Reference Holien1996; Kruys & Jonsson Reference Kruys and Jonsson1997; Nascimbene et al. Reference Nascimbene, Marini and Nimis2010). In north-eastern North America, Selva (Reference Selva1994, Reference Selva2003) has echoed these conclusions and has further argued that calicioid diversity can itself be a useful surrogate of relative environmental continuity in forest ecosystems (but see Lõhmus & Lõhmus Reference Lõhmus and Lõhmus2011).
Arsenault & Goward (Reference Arsenault and Goward2016) examined old-growth dependency in epiphytic macrolichens along a moisture gradient in unmanaged forests in humid inland British Columbia. Old stands were found to support a greater number of species than young stands, although mean species richness did not differ significantly between age classes. Differences in epiphytic species composition associated with stand age were significant only in more humid sections of the study area, suggesting that old-growth dependency among epiphytic macrolichens may vary within a macroclimatic context.
Here, we report the results of a parallel study of crustose calicioids undertaken in the same pairs of mid-seral and old unmanaged stands. In light of earlier findings in other regions (see above), our study had four main objectives: 1) to assess the nature and extent of old-growth dependency among epiphytic calicioids in our study area; 2) to examine trends in calicioid diversity and distribution in mid-seral and old forests along a regional moisture gradient; 3) to record and describe key microhabitats contributing to overall calicioid species richness in old forests, including tree species, bark, lignin and tip-ups; 4) to use our findings to develop recommendations for the maintenance of calicioid diversity in humid inland regions of British Columbia. To test whether there were differences in composition and richness between mid-seral and old-growth stands, we examined mid-seral stands as natural systems with their remnant trees/snags/stumps intact as well as with these components removed artificially to mimic managed systems. Additionally, in order to test whether mid-seral and old-growth stands support different calicioid assemblages, we examined species occurrence on each of eight host tree/shrub species and compared species occurrence on bark with that on lignin.
Materials and Methods
Study Area
This study was conducted in the Clearwater Valley of southern Wells Gray Provincial Park, east-central British Columbia (51°57′N, 120°03′W). All plots were situated in unmanaged stands at 630–820 m a.s.l. within the moist-warm subzone of the Interior Cedar-Hemlock Zone (ICHmw) (Meidinger & Pojar Reference Meidinger and Pojar1991), also referred to as the humid province of the Lower Oroboreal Subzone (Tuhkanen Reference Tuhkanen1984; Goward & Ahti Reference Goward and Ahti1992). As a rule, the forests here are broadly divisible into two age classes: old-growth, dominated by Thuja plicata and Tsuga heterophylla, and mid-seral, dominated by Abies lasiocarpa, Betula papyrifera, Picea engelmannii × glauca, Pinus contorta, Populus tremuloides, P. trichocarpa and Pseudotsuga menziesii, but also including a younger cohort of Thuja and Tsuga.
Sampling design
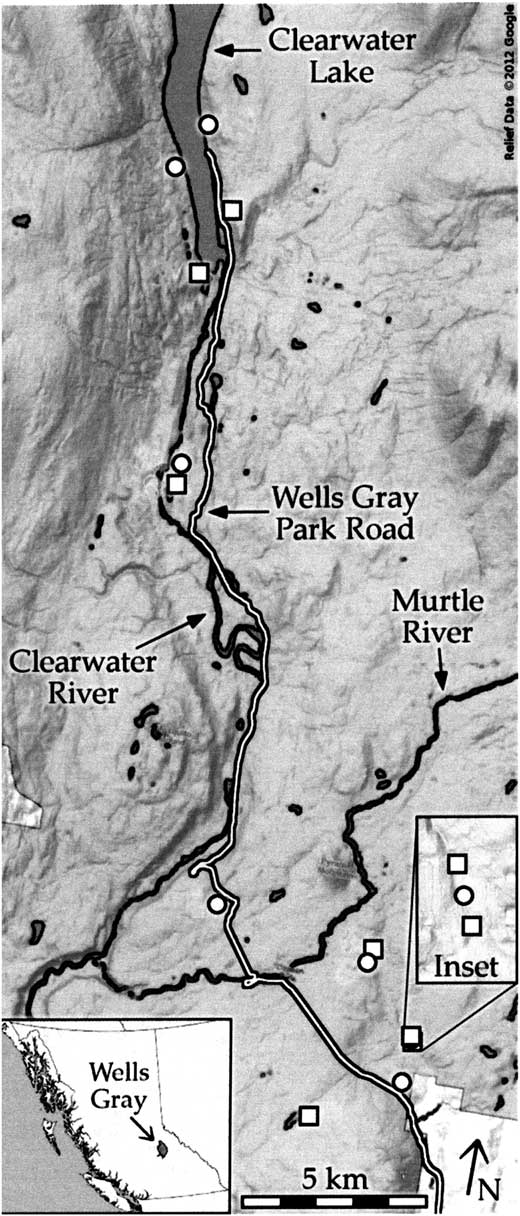
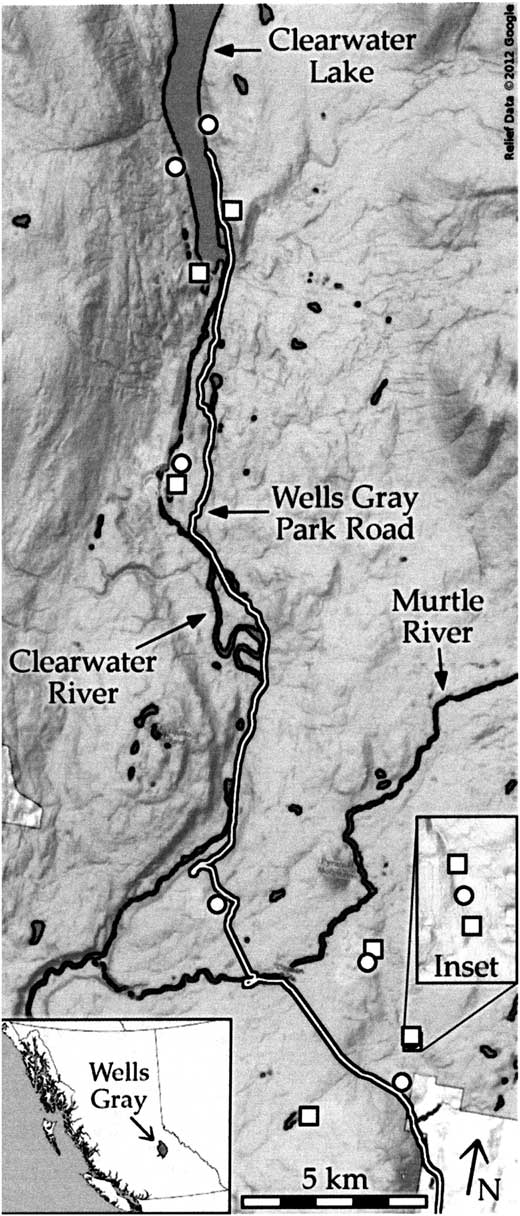
We sampled seven matched pairs of mid-seral and old stands. In keeping with prevailing topographic occurrence of old-growth stands in our study area, and in order to control for environmental heterogeneity, we restricted our study plots to the “toe position” at the base of hill slopes. Stands in this topographic position are less prone to wildfire than adjacent stands (Goward & Pojar Reference Goward and Pojar1998) and, in any event, often support a high level of calicioid diversity, an observation already made by Rikkinen (Reference Rikkinen1995). Each pair of stands was selected for comparable site conditions and, insofar as possible, relative proximity. Our “old” stands ranged in age from 220–470 y, whereas our mid-seral stands were aged 70–165 y, although invariably with a few remnant trees or snags from the previous forest generation. Taken together, the study area formed a 30km transect along a climatic gradient ranging from moist in the south to wet in the north (Fig. 1). Soils here were hygric or subhygric, canopy gaps were common and broadleaf trees were often present, especially in the younger stands.
The study area in Wells Gray Provincial Park, south-central British Columbia. Mid-seral forests and old forests are labelled with squares and circles, respectively.
Data were gathered on stand structure, associated vascular plants, stand age and disturbance history during the 1995–1996 field seasons by a separate team led by the second author. In each of the selected stands, we established a circular plot 20 m in diameter in the middle of the area surveyed. A soil profile was described within each plot and all vascular plants were assessed for percent cover. Standing trees ≥1 cm and snags (standing dead trees) ≥10 cm diameter at breast height (dbh) were also recorded using the methods given in Arsenault & Bradfield (Reference Arsenault and Bradfield1995). All live trees ≥10 cm dbh were cored at 30 cm height. Tree cores were individually mounted on wood mounts and sanded using increasingly fine sand paper. Tree cores were aged under a dissecting microscope and stand age was assigned as the oldest tree of the dominant tree canopy, excluding veteran trees for mid-seral stands.
Fieldwork was carried out from August–October 1996. Owing to the highly discontinuous nature of calicioid distribution at stand scale (Rikkinen Reference Rikkinen2003), we adopted an informal time-constrained “walk-about” approach. The area covered by our walk-about measured c. 40 m wide×150 m long (the rectilinear shape reflects our effort to examine only the “toe” topographic position which tends to form a narrow band at the base of hill slopes). Each plot was sampled for c. 4 h by the two authors, which included a basic macrolichen survey and the calicioid walk-about (Arsenault & Goward Reference Arsenault and Goward2016). Standardizing search effort is important for statistical comparison of different stands (Will-Wolf Reference Will-Wolf2002; Rogers & Ryel Reference Rogers and Ryel2008). For each of eight dominant host trees (Abies, Alnus, Betula, Picea, Populus trichocarpa, Pseudotsuga, Thuja, Tsuga spp.) we documented calicioid presence or absence on as many as five sampling units: 1) young branch, 2) old branch, 3) trunk ≥1 m, 4) trunk <1 m (including recesses), and 5) sapling (trees<10 cm dbh). Each sampling unit was recorded as “living tree” versus “dead tree” (= snag) and “bark” versus “wood”. Logs, tip-up mounds and rock underhangs were also carefully searched.
In the case of mid-seral stands, remnant trees and snags predating the most recent stand-replacing fire were sampled separately from the adjacent younger trees. “Snags” less than c. 1 m in height were classified as “natural stumps” but were found to support virtually no calicioids in our study area, presumably owing to the adverse impact of winter snowpacks in the range of 1–1·5 m (T. Goward, pers. obs.). Similarly, only tip-up mounds exceeding c. 1·5 m in height were found to support calicioids.
Many calicioids are difficult to identify under field conditions, hence we supplemented our field observations with c. 150 mass collections, each from a single sampling unit. The material was later sorted and examined in the laboratory using dissecting and compound microscopes and chemical reagents as required. Critical material was sent to Dr Leif Tibell for confirmation. In total c. 600 specimens were selected and curated as voucher material and have subsequently been deposited in the herbaria of the Atlantic Forestry Centre and the University of British Columbia (UBC, Vancouver). Taxonomy and nomenclature follow Goward (Reference Goward1999), with the following exceptions: 1) Chaenotheca brunneola includes C. hygrophila and C. sphaerocephala; 2) C. gracillima includes C. nitidula (Tibell & Koffman Reference Tibell and Koffman2002); 3) C. trichialis includes C. stemonea. Titov (Reference Titov2006) recently synonymized Chaenothecopsis sp. 6 and Chaenothecopsis sp. 9 (sensu Goward Reference Goward1999) under C. pusilla but further work on that species is required before this can be accepted (Tibell Reference Tibell1999; Rikkinen Reference Rikkinen2003); 4) sp. 5 is now formally recognized as C. aeruginosa Goward & E. B. Peterson (Peterson & Goward Reference Peterson and Goward2016); 5) Calicium adaequatum is placed in a separate genus, Allocalicium, while Cyphelium karelicum and C. inquinans are treated within Acolium, consistent with Prieto & Wedin (Reference Prieto and Wedin2017).
Data analysis
Mean species richness (i.e. α diversity) in mid-seral and old stands was compared using the non-parametric Kruskall-Wallis test using version 7 of SYSTAT for Windows (Wilkinson Reference Wilkinson1997). We also calculated total species richness (i.e. γ diversity), summarized species richness data by tree species and compared the diversity of species growing on bark, lignin and tip-up mounds.
We used version 6 of PC-ORD (McCune & Mefford Reference McCune and Mefford1999) to investigate multivariate patterns of community structure. In order to test differences in calicioid lichen community structure between mid-seral and old forests, we used multi-response permutation procedures analysis (MRPP) on the species composition matrix (presence/absence). We described calicioid community structure using a Principal Coordinate Analysis (PCoA) based on Sørensen’s distance measure of the species composition matrix and default parameters of PC-ORD v.6. The data structure of the ordination was interpreted by means of joint biplots of environmental variables on the ordination as well as by calculating Pearson correlations between the samples scores, the species composition variables and the environmental variables. Environmental variables included: tree density (stems ≥10 cm ha−1)(D), stand age (y) (AGE2), mean tree dbh (cm) (TREEMEAN), number of large trees (stems ≥50 cm dbh ha−1)(LTREES), mean standing dead tree dbh (cm) (SNMEAN), snag basal area (m2 ha−1) (SNABAS), and precipitation (mm) (100–350 mm) inferred from isoclines in Goward & Ahti (Reference Goward and Ahti1992) (precip). In addition, we performed linear regression between species richness and stand age. We also compared individual species frequencies over different key substrata and used a non-parametric test to compare species richness between the two age classes. We report the regression equations, r 2 values and probabilities between species richness and stand age. We chose not to report the adjusted r 2 values because the differences between r 2 and adjusted r 2 values were minor. For mid-seral stands, these analyses were performed with and without post-disturbance legacies defined as snags and veteran trees still present in mid-seral forest after the stand-initiating event. This allowed us to compare existing patterns of calicioid richness in unmanaged mid-seral stands with that in hypothetical managed mid-seral stands from which snags and veteran trees have been removed by logging.
The value of individual species and groups of species as indicators of old-growth forests was analyzed by performing species indicator analysis (Dufrêne & Legendre Reference Dufrêne and Legendre1997; De Cáceres et al. Reference De Cáceres, Legendre, Wiser and Brotons2012). We used version 1.7.1 of the ‘indispecies’ package in R (De Cáceres Reference De Cáceres2013) which calculates two probabilities A and B and then through Montecarlo permutations estimates an indicator value statistic and a P value. The first probability (A) is the specificity or the positive predictive value of a species for the target group which is calculated by the number of occurrences of the species within sites belonging to the target site group, divided by the number of occurrences of the species across all sites. The second probability (B) is the fidelity or sensitivity of the species for the target group (De Cáceres Reference De Cáceres2013). We then used the multipatt function of the indispecies package to determine indicator association statistics and P values for combinations of species. The rationale behind this approach is that using groups of species as indicators is likely to be more powerful as they would contain more information than individual species indicators (De Cáceres et al. Reference De Cáceres, Legendre, Wiser and Brotons2012). All combinations were calculated but for simplicity we present only those species group indicators found to be significant.
Results
Community structure
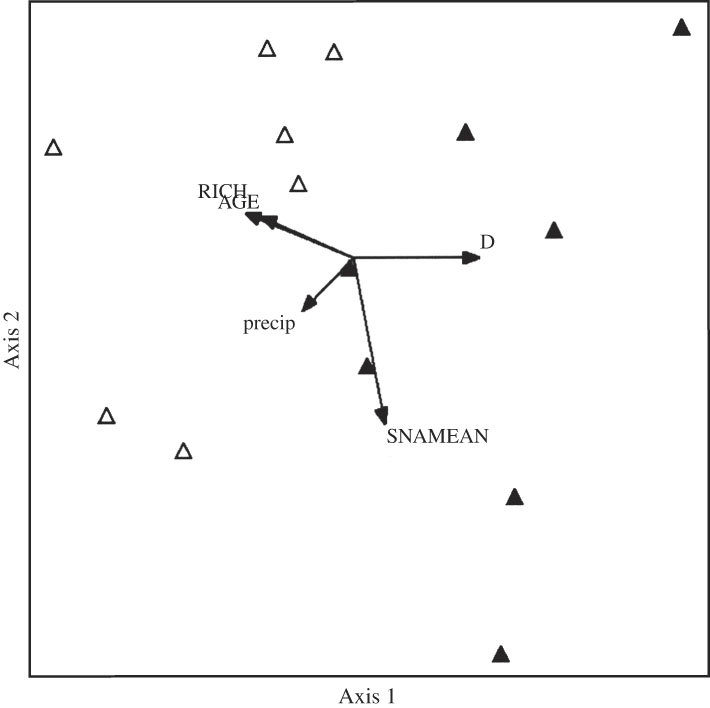
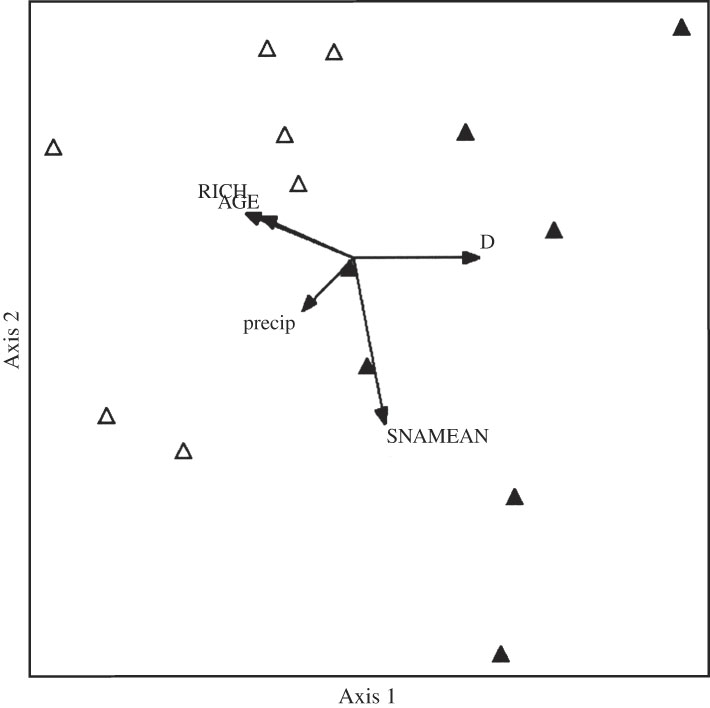
The MRPP analysis significantly differentiated the calicioid community structure of mid-seral and old forests (A=0·09, P<0·0008). The first two axes of the PCoA ordination explained 46% of the variation and were significant for the randomization tests (P<0·05). The first axis very clearly separated calicioid communities associated with mid-seral forests on the right hand and their old-growth counterparts on the left (Fig. 2). The first axis is negatively correlated with stand age, large trees and calicioid species richness (Table 1).
Joint biplot of the Principal Coordinates Analysis ordination of calicioid data showing mid-seral and old forests as closed and open triangles, respectively. The arrows indicate correlation with specific environmental variables. D=tree density, AGE=stand age, Rich=species richness, SNMEAN=mean snag dbh, precip=precipitation.
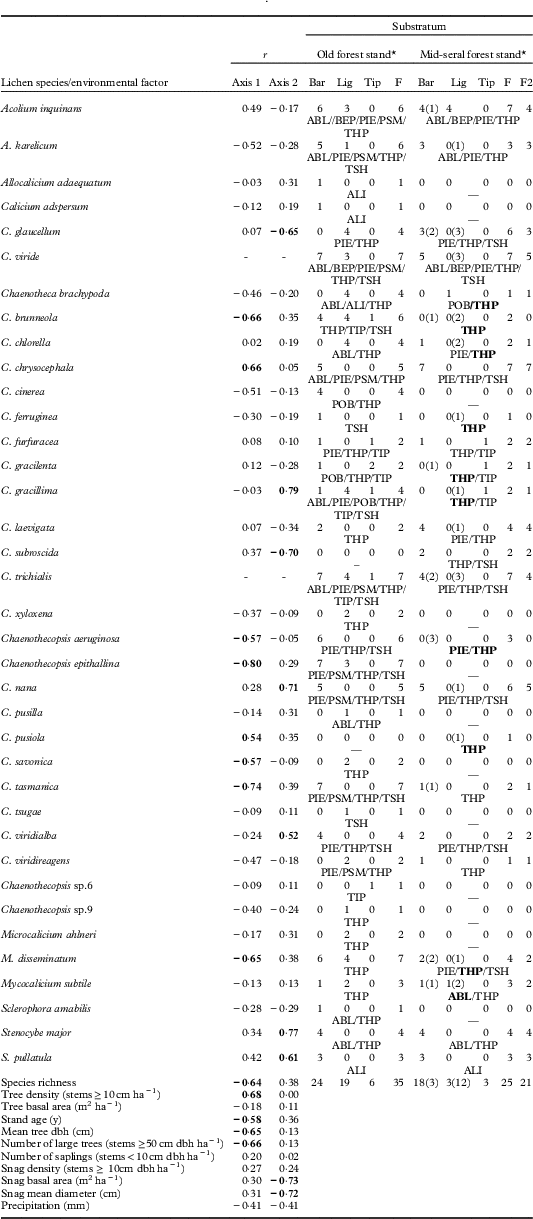
Distribution of calicioid lichen species in old and mid-seral forest stands in southern Wells Gray Provincial Park, British Columbia including: Pearson correlation coefficient (r) between sample scores of the first 2 axes of the PCoA ordination for both individual species and environmental data (bold indicates P<0·05); frequency of calicioid species at sites (max=7) on selected substrata (numbers in brackets indicate frequency on remnant trees and snags only),F includes remnants and F2 excludes them; occurrence on host trees (species occurring in mid-seral stands exclusively on remnant trees are indicated by the tree species in question shown in bold)
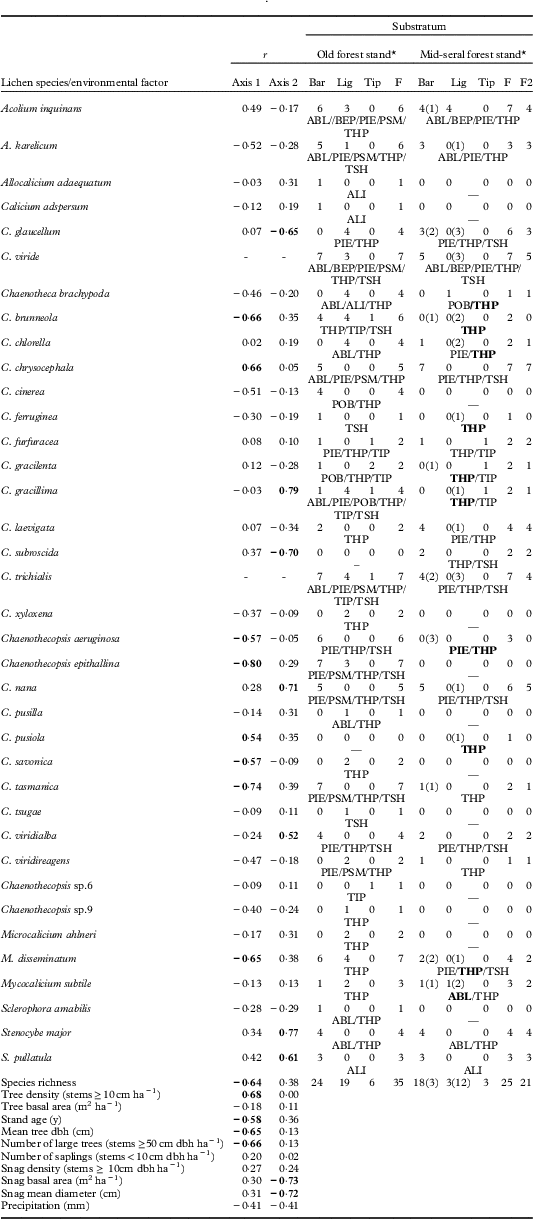
*Key to abbreviations. Substratum: Bar=bark, Lig=Lignin, Tip=tip-up mounds. Host trees: ABL=Abies lasiocarpa, ALI=Alnus incana, BEP=Betula papyrifera, PIE=Picea engelmannii, POB=Populus balsamifera, PSM=Pseudotsuga menziesii, THP=Thuja plicata, TSH=Tsuga heterophylla, and TIP=tip-up mounds.
Species associated with this trend are Chaenotheca brunneola, C. chrysocephala, Chaenothecopsis aeruginosa, C. epithallina, C. pusiola, C. savonica, C. tasmanica and Microcalicium disseminatum. In contrast, overall tree density was associated with the reverse direction of the first PCoA axis, as was Chaenotheca chrysocephala. The second PCoA axis is negatively correlated with snag basal area, mean snag diameter, Calicium glaucellum and Chaenotheca subroscida, and positively correlated with the following calicioids: Chaenotheca gracillima, Chaenothecopsis nana, C. viridialba, Stenocybe major and S. pullatula.
Species diversity
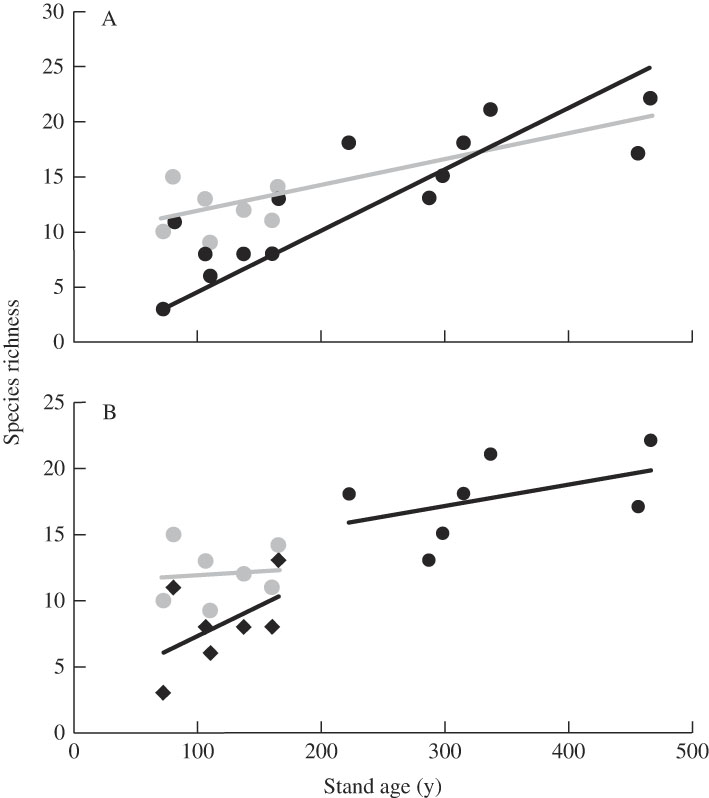
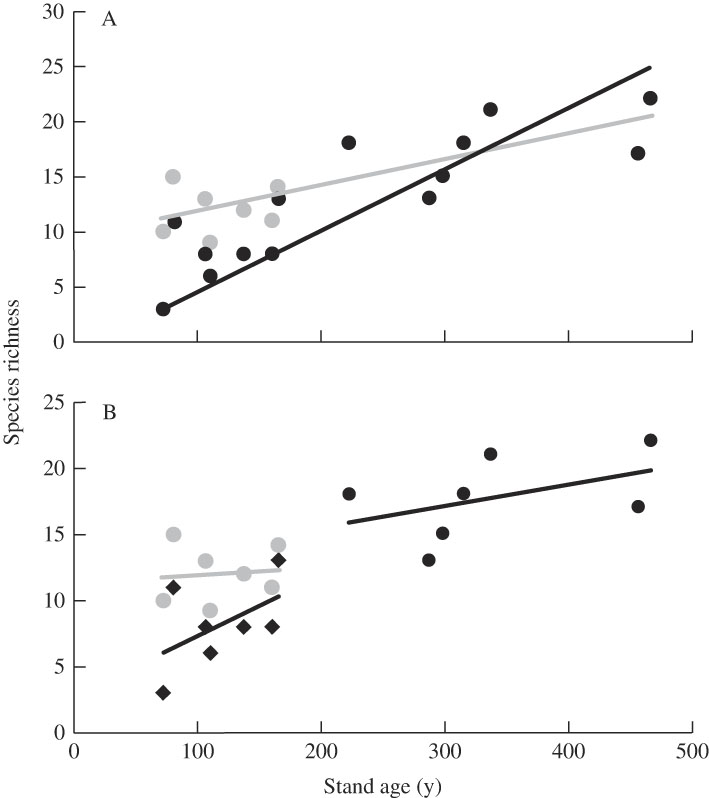
Mean calicioid species richness was significantly higher in old stands than in mid-seral stands, with 18±1 species versus 12±1 species, respectively (Kruskall-Wallis P<0·004, n=14). This mid-seral stand value dropped to a mean of eight species when veteran trees and snags were removed. Stand age and calicioid species richness were significantly related (r 2=0·62, P=0·0008) (Fig. 3). This relationship was much stronger when species growing on remnant trees and snags in young stands were removed from the analysis (r 2=0·72, P=0·0001). It should be mentioned here that stand age was distributed along a rather smooth continuum within both the young stands (70–165 y) and the old stands (220–470 y). Calicioid richness increases linearly with stand age without any obvious thresholds between mid-seral and old stands (Fig. 3). When remnant trees and snags are excluded, however, species richness increases more steeply with stand age (Fig. 3B). However, a separate regression between species diversity and age within the old-growth group is not significant, consequently we infer that the predictive relationship between stand age and species diversity is not simply linear but that other factors are likely at play. The total number of calicioid species (n=37) was also much higher in old stands than in mid-seral stands, with 35 versus 25 species, respectively (Table 1). The difference is even more pronounced, with 35 versus 21 species, when remnant trees and snags were excluded from our mid-seral stands data set. The following species were most frequent in old stands: Acolium karelicum, Chaenotheca brachypoda, C. brunneola, C. chlorella, C. cinerea, C. gracillima, C. trichialis, Chaenothecopsis aeruginosa, C. epithallina, C. tasmanica, Microcalicium ahlneri and M. disseminatum. Only Chaenotheca subroscida was distinctly more frequent in mid-seral stands than in old stands. No significant relationship existed between precipitation (from drier southern to wetter northern portions of the study area) and calicioid diversity (r 2=0·08, P<0·77). However, several species were more frequent in the north whereas one species (Chaenotheca chrysocephala) was more abundant in the south.
Calicioid species richness as a function of stand age in southern Wells Gray Provincial Park. A, grey circles=remnant trees and snags included, richness=9·62+stand age×0·023, r 2=0·62, P=0·0001; black circles=remnant trees and snags excluded, richness=4·40+stand age×0·037, r 2=0·72, P=0·0001. B, same data as in 3A but regression lines are calculated by age class: grey circles=young forest stands with remnant trees and snags included, richness=11·38+stand age×0·005, r 2=0·01, P=0·85; black diamonds=young forest stands with remnant trees and snags excluded, richness=2·78+stand age×0·04, r 2=0·26, P=0·24; black circles=old forest stands, richness=9·60+stand age×0·02, r 2=0·21.
Association with phorophytes
Only a small proportion of the overall higher calicioid diversity associated with our old stands (see below) is accounted for by bark-dwelling calicioids. Thus, old stands supported 24 corticolous species (mean=12·9±0·8 (±1SE), n=7), compared with 21 species in mid-seral stands when remnant trees are included (mean=9·6±1·4, n = 7) and 18 species when they are not (mean=7·6±1·1) (Table 1). The difference between age classes is significant only when remnant trees are removed from the analysis. Note, however, that two of the calicioids restricted to old stands (i.e. Allocalicium adaequatum and Calicium adspersum) were recorded from the young branches of shrubs (Alnus) more characteristic of mid-seral stands. Considering only those species documented from the three host trees supporting maximum calicioid species richness (Picea, Thuja and Tsuga; see below), total diversity is more evenly distributed still, with old stands supporting 18 species and mid-seral stands supporting 17 species.
The old stands, with 19 wood-dwelling species (mean=7·3±1·2), supported a much higher level of lignicoles than mid-seral stands, with only 3 species (mean=0·3±0·2) (Table 1). It was of note that lignicole richness in mid-seral stands increases to 15 species (mean=4·0±1·1) when remnant trees are included. The difference in species richness between age classes is only significant using a Kruskall-Wallis test when the veteran trees and snags are removed from the analysis for corticolous species (χ2=7·64, P=0·006) and lignicolous species (χ2=10·27, P=0·001). Futhermore, seven lignicoles are restricted to old stands and, of these, five occur exclusively on wood (i.e. Chaenotheca xyloxena, Chaenothecopsis pusiola, C. savonica, Chaenothecopsis sp. 9 and Microcalicium ahlneri).
Host trees
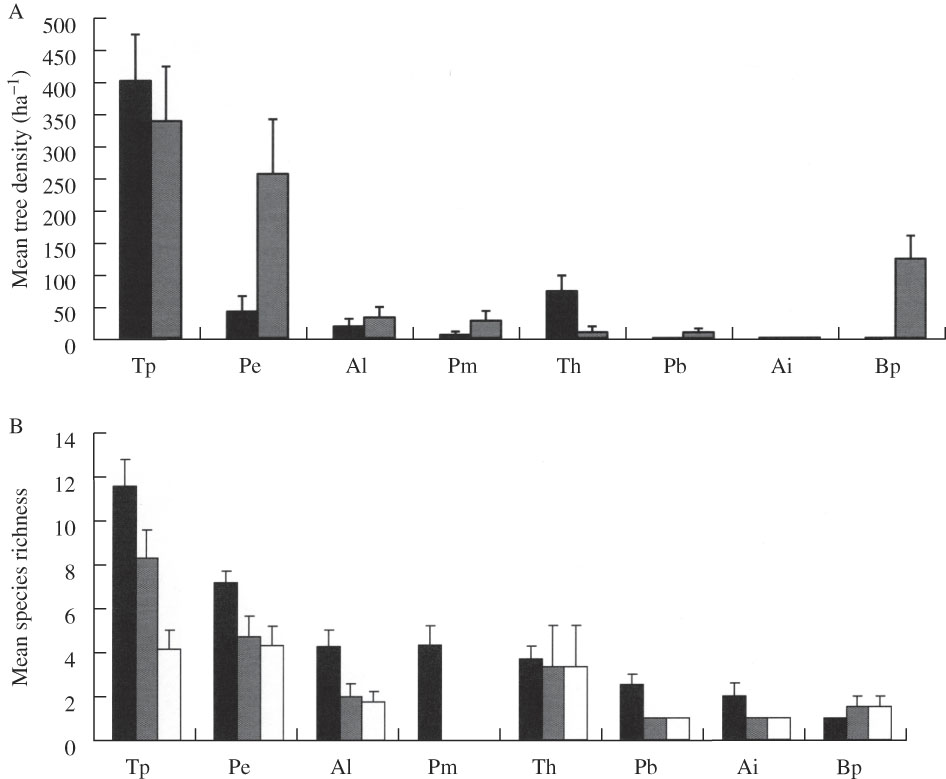
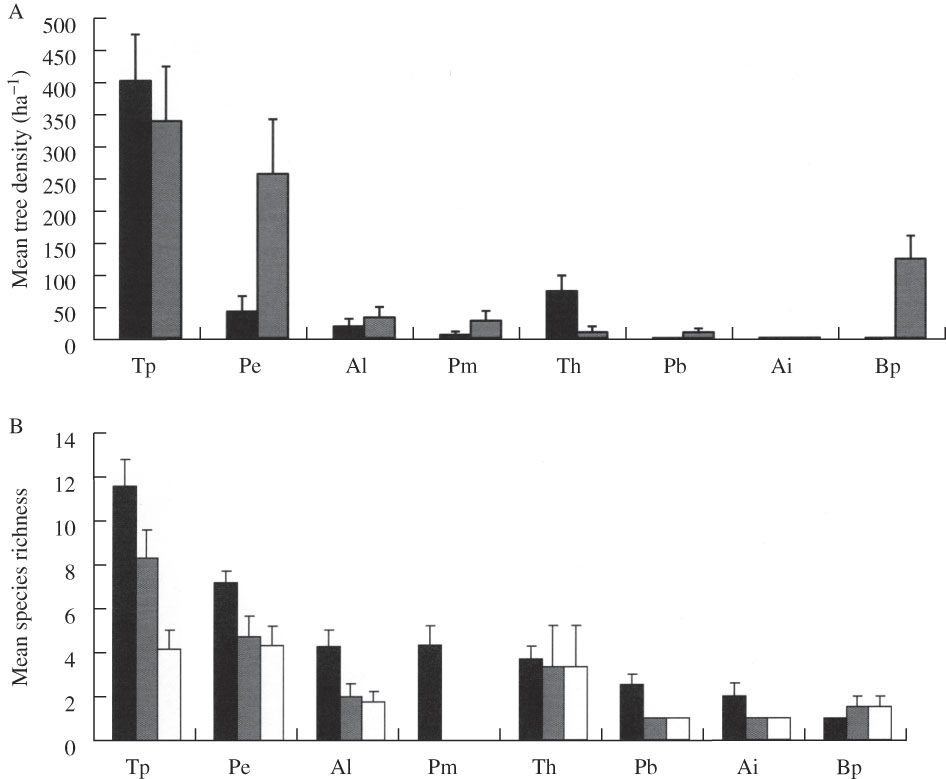
Most tree species occurred in both age classes but some were more closely associated with mid-seral conditions (Fig. 4A). Calicioid species richness varied markedly among the eight host trees evaluated (Fig. 4B). By far the richest calicioid flora was associated with Thuja, which supported 31 of the 37 species recorded in this study and nearly twice as many species as the next richest trees, Picea and Tsuga. Twenty-five of these species were present in old stands versus 15 in mid-seral stands (excluding remnant trees). Of the 31 species, 15 were recorded on bark whereas 18 occurred on wood. Moreover, five calicioids were documented exclusively from Thuja (Table 1). In contrast, Picea supported a total of only 17 species, of which 12 occurred in old stands and 11 in mid-seral stands. Only one calicioid species was noted on Picea wood, presumably reflecting rapid decay rates in this tree. Similarly, only two lignicoles were found on this host species. Calicioid diversity on Tsuga consisted of 16 species, 13 of which were present in old stands but only eight in mid-seral stands.
A, density of host trees (phorophytes) in old (black bars) and mid-seral stands (grey bars) in southern Wells Gray Park, British Columbia; B, calicioid species richness on dominant host trees in old forests (black bars), mid-seral forests (grey bars) and young mid-seral forests with remnant trees excluded (white bars). Key to abbreviations: Tp=Thuja plicata, Pe=Picea engelmanii, Al=Abies lasiocarpa, Pm=Pseudotsuga menziesii, Th=Tsuga heterophylla, Pb=Populus balsamifera, Ai=Alnus incana, Bp=Betula papyrifera. Mean values are plotted +1SE, n=7.
Old-growth indicators
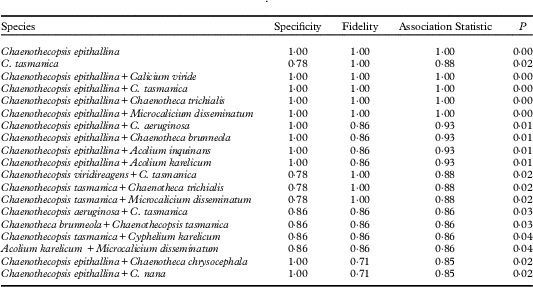
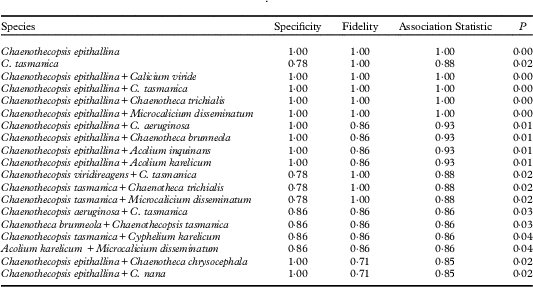
The individual species analysis revealed that 15 species were associated with old-growth forests (Table 2). Many of these species have high specificity but low fidelity due to low levels of occurrence. This results in only two species with significant indicator values, Chaenothecopsis epithallina and C. tasmanica. Nonetheless, the analysis revealed 16 indicator species combinations as significant (Table 2). Twelve of the 37 calicioid species encountered in this study were detected exclusively in old forests. Four of these species (excluding Allocalicium adaequatum and Calicium adspersum, see above) were recorded exclusively in stands older than c. 300 y (Chaenothecopsis pusilla, C. tsugae, Chaenothecopsis sp. 6 and Microcalicium ahlneri) whereas the remaining six species were restricted to stands older than c. 200 y (Chaenotheca cinerea, C. xyloxena, Chaenothecopsis epithallina, C. savonica, Chaenothecopsis sp. 9 and Sclerophora amabilis). More recent fieldwork in humid inland British Columbia confirms that most of the above species might appropriately be designated as “old-growth dependent” (Goward Reference Goward1999). Several additional calicioids proved to be more frequent in old forests than in mid-seral forests and might thus be regarded as “old-growth associated”: Chaenotheca brachypoda, C. brunneola, C. gracillima, Chaenothecopsis aeruginosa, C. tasmanica, C. viridialba and Microcalicium disseminatum.
Species indicator analysis for individual species and groups of species for old forest stands. The specificity, fidelity, Pearson’s phi coefficient of association for the indicator value and the P values are given. Only significant indicators are listed
Discussion
Stand age
The link documented here between calicioid richness and stand age is consistent with earlier studies in Europe and eastern North America which have amply shown that calicioid species become more numerous with increasing forest age (e.g. Hyvärinen et al. Reference Hyvärinen, Halonen and Kauppi1992; Tibell Reference Tibell1992; Selva Reference Selva1994; Holien Reference Holien1996). The present study does, however, appear to be the first to suggest that calicioid recruitment may continue over a period of at least five centuries after stand initiation. For now, it seems advisable to regard this finding as an attribute of particular host tree species, most notably Thuja plicata, which in British Columbia can reach 1000 y in age (Parish et al. Reference Parish, Coupé and Lloyd1996). Notwithstanding this caveat, our study of calicioid recruitment in an unmanaged landscape provides at least a rough baseline against which to compare and contrast calicioid species richness in managed forests. Critically, the linear trend in increasing calicioid diversity with stand age is not significant within the old-growth forest age class (Fig. 3), a finding that argues against the feasibility of developing a species-based continuity index in this instance (Selva Reference Selva2003). However, the most diverse forests are aged 300 y and older and thus the retention of older old-growth forests is essential for biodiversity conservation.
Remnant structure
All seven of the mid-seral stands examined contained trees and snags carried forward from the preceding forest generation. Taken as a whole, these old-growth “remnants” supported a rich assemblage of calicioids, including several species not occurring on the adjacent younger trees (i.e. Chaenotheca brunneola, C. ferruginea, C. gracilenta, C. gracillima, Chaenothecopsis pusiola and C. aeruginosa). Whether these species dated from the previous forest generation or had become established more recently is of course unknown. Either way, their restricted occurrence on the remnant trees and snags in stands otherwise consisting of much younger trees suggests that the old-growth remnants, at least in these cases, do not accelerate calicioid recruitment onto the younger trees aged, in some cases, between c. 120 and 165 y. Thus, whereas the presence of remnants increases overall calicioid species richness at the stand level, the present data suggest that they have little impact on calicioid population structure on adjacent younger trees. It is interesting to note here that the oldest of our mid-seral stands had already acquired many of the structural characteristics of old growth (Franklin et al. Reference Franklin, Cromak, Denison, McKee, Maser, Sedell, Swanson and Juday1981).
Old-growth dependency
The available evidence suggests that several calicioid species are old-growth dependent in our study area. Thus, four of the 37 species documented by us (i.e. Chaenothecopsis pusilla, C. tsugae, Chaenothecopsis sp. 6 and Microcalicium ahlneri, but excluding Allocalicium adaequatum and Calicium adspersum) were recorded exclusively from stands older than c. 300 y, whereas another six species (Chaenotheca cinerea, C. xyloxena, Chaenothecopsis epithallina, C. savonica, Chaenothecopsis sp. 9 and Sclerophora amabilis) were restricted to stands older than c. 200 y. These findings are consistent with subsequent observations in the study area (T. Goward, pers. obs.) and in general outline agree with findings elsewhere (e.g. Tibell Reference Tibell1992; Rikkinen Reference Rikkinen1995; Goward Reference Goward1999; but see Lõhmus & Lõhmus Reference Lõhmus and Lõhmus2011). Although the species indicator analysis identified 15 species, only two had significant indicator values, a result that reflects both the very low frequency of occurrence of some species and the relatively small number of plots. However, it is important to note that 16 species associations had significant indicator values, suggesting that species assemblages rather than individual species might be better indicators of old-growth forest conditions (see also Dymytrova et al. Reference Dymytrova, Brändli, Ginzler and Scheidegger2018).
Old-growth dependency can result either from limitations on dispersal or from delayed development of conditions required for establishment (Nordén & Appelqvist Reference Nordén and Appelqvist2001). In lichens, inefficient mechanisms of dispersal have been linked to old-growth dependency in a small number of macrolichen species (Scheidegger Reference Scheidegger1995; Hilmo & Såstad Reference Hilmo and Såstad2001; Öckinger et al. Reference Öckinger, Niklasson and Nilsson2005). Dispersal, however, is unlikely to be limiting in the case of most calicioid species (Kruys & Jonsson Reference Kruys and Jonsson1997), in which the presence of a loose spore mass and/or stalked apothecia appears to be a special adaptation for transport by foraging birds, mammals and invertebrates, and/or by the kinetic energy released by falling trees (Tibell Reference Tibell1994). Many calicioids have very large global ranges (Tibell Reference Tibell1994), with more than half of the species recorded in the present study being present also, for example, in Australasia (Tibell Reference Tibell1987).
A more plausible explanation for the very gradual increase in calicioid species richness with increasing stand age is a delayed development of the structural attributes necessary for their establishment. Many calicioids are restricted to soft, dry wood whereas others seem specially adapted to rain-sheltered microsites on the lower surface of leaning trees (Tibell Reference Tibell1992). Such microhabitats are much more frequently encountered in old stands than in mid-seral stands, an assertion consistent with recent findings of European lichenologists who have shown that calicioid species richness effectively tracks increasing microhabitat development with increasing forest age (e.g. Lõhmus & Lõhmus Reference Lõhmus and Lõhmus2011). More specifically, both trends are by-products of accumulating small-scale disturbance on the one hand (Fritz & Heilmann-Clausen Reference Fritz and Heilmann-Clausen2010; Lōhmus et al. Reference Lõhmus, Turja and Lõhmus2010), and of a gradual increase in fine-scale woody structure on the other hand (Vuidot et al. Reference Vuidot, Paillet, Archaux and Gosselin2011). Future research on calicioid population dynamics in other parts of western North America would benefit from a careful examination of fine-scale habitats.
Congruent with the earlier findings of Rikkinen (Reference Rikkinen2003) and others, calicioid species richness in our study area varied markedly among the eight host trees. By far the richest calicioid flora was associated with Thuja (see also Tibell Reference Tibell1975) which supported c. 80% of all calicioid species observed in this study and twice as many species as the next richest trees, Picea and Tsuga. The status of Thuja as a pre-eminent host tree for calicioids can be attributed to some or all of five factors: 1) its association with humid sites, favourable to many calicioids adapted to absorbing moisture directly from the atmosphere (Barkman Reference Barkman1958); 2) the tendency of its bark to soften with age and hence support calicioids more characteristic of soft wood (Tibell Reference Tibell1975; Rikkinen Reference Rikkinen2003); 3) its notable resistance to fungal decay, resulting in long persistence after death (Minore Reference Minore1983); 4) its tendency to lean in age, thereby creating a rain-sheltered habitat highly suited to calicioids (James et al. Reference James, Hawksworth and Rose1977); 5) its often hollow interior (Fenger et al. Reference Fenger, Manning, Cooper, Stewart and Bradford2006), well suited to calicioids adapted to dry wood. These attributes notwithstanding, the status of T. plicata as a key host for calicioid diversity appears to be limited primarily to humid parts of inland British Columbia; in coastal regions and areas further south, it supports a much less diverse calicioid flora (Rikkinen Reference Rikkinen2003; A. Arsenault, unpublished data; T. Goward, pers. obs.). Furthermore, the link with species richness is well developed only on old trees; Thuja younger than c. 240 y provides a relatively poor habitat for calicioids.
Implications for forest management
This study has four major findings pertinent to the maintenance of biodiversity in managed forests. Firstly, that the presence of old remnant trees and snags in younger regenerating stands can enhance calicioid richness through the presence of species otherwise restricted to forests of advanced age. Secondly, that old Thuja plicata in our study area functions as a primary host tree for calicioid diversity. These findings point to the biological importance of permitting key elements of stand structure to persist into subsequent forest generations. Considerable attention has been paid in recent years to the retention of “wildlife trees” which provide critical habitat for birds, mammals and invertebrates (Harris Reference Harris1984; Fenger et al. Reference Fenger, Manning, Cooper, Stewart and Bradford2006). In many jurisdictions, legislation and/or best management practice guidelines are now in place requiring that cutblock design incorporates wildlife tree patches and old-growth retention patches (US Department of Agriculture & US Department of the Interior 1994; British Columbia Ministry of Forests and Ministry of Environment, Lands & Parks 1999) as well as retention of deadwood (Arsenault Reference Arsenault2002). In principle, the inclusion of large Thuja trees, as well as large snags in various stages of soundness and decay, should enhance the value of wildlife trees for calicioids, as it would for a wide range of epiphytic organisms including bryophytes (Anderson & Hytterborn Reference Anderson and Hytteborn1991; Newmaster et al. Reference Newmaster, Belland, Arsenault and Vitt2003) and other crustose lichens (Spribille et al. Reference Spribille, Thor, Bunnell, Goward and Björk2008).
Thirdly, that calicioid diversity in unmanaged stands increases long past the acquisition of old-growth status and lastly that most of the species recruited in the later stages of stand succession are obligate or near-obligate lignicoles. Therefore, most of the calicioid species acquired during the later phases of forest succession reflect the increasing incidence of decorticate snags in varying stages of soundness and decay. These findings are significant because definitions of old growth based on coarse-scale stand structure tend to conceal the reality that very old, “antique” forests (sensu Goward & Pojar Reference Goward and Pojar1998) can support species not yet present in “young” old-growth forests. Modern forestry is founded largely on harvest rotations of only 60 to 140 y. Although the fine-scale woody structure requisite for full calicioid development tends to increase with increasing stand age in unmanaged forests, stand management has lately been shown to greatly offset this trend (Michel & Winter Reference Michel and Winter2009). In the Interior Cedar-Hemlock Zone of interior British Columbia, these considerations argue in favour both of adopting an age-class system that distinguishes varying degrees of “oldgrowthness”, and of giving high priority to the conservation value of the oldest old-growth (= antique) stands.
We thank Kim Johnston, Patrick Williston and George Yearsley for assistance in the field, Helen Knight and Patrick Williston for help in the laboratory, and Curtis Björk, Carla Rydholm, Toby Spribille, Matt Stewart, Ken Wright, Steve Selva, Robert LeBlanc, Peter Crittenden, Piret Lõhmus and two anonymous reviewers for constructive criticism of earlier versions of the manuscript. Leif Tibell, Uppsala, is thanked for taxonomic support and Jason Hollinger for kindly preparing the map in Figure 1. We are also grateful to Bruce McCune and János Podani for providing insight into species indicator analysis. Funding for this project was provided by Forest Renewal British Columbia (FRBC), the British Columbia Forest Service and the Canadian Forest Service.