


1. Introduction
Over the last 40 years, enrollment and years of schooling have increased dramatically in many countries. Arguably, households and policymakers have internalized the idea that human capital is key to individual success and to a country’s economic development. Micro evidence strongly suggests individual human capital is tightly linked to real wages, but when it comes to countries, the evidence is less clear.
In particular, the vast majority of countries have approached the U.S. in terms of educational attainment, but not in Gross Domestic Product (GDP) per capita. Fig. 1 illustrates these facts. The upper panel plots, for a large set of countries, average years of schooling relative to the U.S. in 1970 against the same variable in 2010. Notice that most points lie above the 45-degree line, meaning that developing countries have caught up significantly with developed countries when it comes to educational attainment. However, when we repeat this analysis for GDP per capita (lower panel), we find a much more stable distribution across countries.Footnote 1, Footnote 2
Evolution of average years of schooling and GDP per capita, 1970–2010. Source: Barro-Lee Database (average years of schooling) and The Maddison Project (GDP per capita).

Motivated by this tenuous relationship between schooling and income, this paper proposes a simple overlapping generations (OLG) model that emphasizes the role of education quality. Individuals are heterogeneous in their innate ability and make an occupational choice between becoming teachers or market workers. Education quality is measured by the average human capital of teachers.Footnote 3 This is in accordance with key empirical findings from the economics of education literature. For instance, Chetty et al. (Reference Chetty, Friedman and Rockoff2014) show that the quality of teaching is of great importance to students’ future earnings. Moreover, Rivkin et al. (Reference Rivkin, Hanushek and Kain2005) and Rockoff (Reference Rockoff2004) find that teacher fixed effects are key predictors of students’ academic achievement.
Existing growth models that account for education quality, such as Tamura (Reference Tamura2001) and Manuelli and Seshadri (Reference Manuelli and Seshadri2014), usually take it as exogenous or as a policy variable that responds to an arbitrary central planner objective function. This may not fully capture the general equilibrium effects of increasing education quantity. By making education quality endogenous through the individuals’ occupational choice, we try to fill this gap.
We further suppose that human capital accumulation occurs in public schools, meaning that the government raises taxes to pay for teachers’ salaries. The amount spent on education is restricted by the government budget constraint, which determines its capacity to attract individuals with higher levels of innate ability to the teaching career. A tradeoff between quantity and quality of education then emerges given that, by hiring more teachers, the government would have to pay less to each teacher. This leads to a selection issue in which more qualified individuals choose not to be teachers and the average human capital of teachers falls. Consequently, the endogenous reaction of education quality mitigates the effect of education quantity on income. Increasing the quantity of education by hiring more teachers has an ambiguous effect on steady-state human capital and output per capita.
We calibrate the model using data from Latin America and perform numerical exercises to evaluate the expansion of education quantity experienced by these countries between 1970 and 2010. Latin America provides a compelling case study here, since the region has shown a lackluster growth performance over the last decades, despite increases in measured aggregate inputs (Cole et al. (Reference Cole, Ohanian, Riascos and Schmitz2005), Daude and Fernandez-Arias (Reference Daude and Fernandez-Arias2010), Restuccia (Reference Restuccia2013), Ferreira et al. (Reference Ferreira, Pessôa and Veloso2013), Caselli (Reference Caselli2016)), especially human capital quantity (years of schooling). Specifically, average years of schooling went from
 $3.79$
to
 $8.20$
during this period, which represents a sharp increase relative to the U.S. Nonetheless, this was not accompanied by a comparable increase in terms of relative GDP per capita.Footnote 4 Manuelli and Seshadri (Reference Manuelli and Seshadri2011) use the term “excess education puzzle” to denote Latin America’s increase in education quantity that was unmatched by a corresponding increase in output.
More related to our paper, Hanushek and Woessmann (Reference Hanushek and Woessmann2012) suggest that considering a broader measure of human capital—which takes into account quality as well as quantity—can resolve the Latin American development puzzle. This indicates that, although education quantity increased in the region, education quality fell behind, which is in line with the implications our model endogenously delivers. Furthermore, consistent with the mechanism proposed, Levy and Schady (Reference Levy and Schady2013) cite several examples in which this education quality issue is related to the low quality of teachers.
In our quantitative exercises, we explore the case with varying returns to education quantity, in line with Psacharopoulos (Reference Psacharopoulos1994) and Hall and Jones (Reference Hall and Jones1999), which argue that these returns tend to be lower for developed economies. Our results thus indicate that, as countries develop, increases in years of schooling have a progressively smaller effect on GDP per capita. Investments in education quality (which can be obtained by enlarging the education budget) become relatively more important to further raise living standards.
Our main contribution is theoretical by presenting a simple and tractable model to understand the cross-country data on average years of schooling and GDP per capita. This is not the first model to introduce an endogenous tradeoff between education quantity and quality (Gilpin and Kaganovich (Reference Gilpin and Kaganovich2012)), neither to show the importance of education quality in the income convergence process (Tamura (Reference Tamura2001), Manuelli and Seshadri (Reference Manuelli and Seshadri2014)). Nonetheless, to the best of our knowledge, this is the first paper to combine these two features to understand the macroeconomic implications of policies that increase education quantity.
More broadly, our work is related to the literature that studies the importance of human capital to economic growth in a cross-country setting (Barro (Reference Barro1991), Mankiw et al. (Reference Mankiw, Romer and Weil1992), Benhabib and Spiegel (Reference Benhabib and Spiegel1994), Bils and Klenow (Reference Bils and Klenow2000)), especially papers that emphasize the role of education quality (Hanushek and Kimko (Reference Hanushek and Kimko2000), Schoellman (Reference Schoellman2012), Hanushek (Reference Hanushek2013), Lee and Lee (Reference Lee and Lee2024)). It is specifically motivated by the weak correlation between GDP per capita and educational attainment documented by Benhabib and Spiegel (Reference Benhabib and Spiegel1994), Pritchett (Reference Pritchett2001), Easterly (Reference Easterly2002), and many others.
Other papers have suggested potential explanations for this weak correlation, such as poor data quality (Temple (Reference Temple2001), de la Fuente and Domenech (Reference de la Fuente and Domenech2006), Cohen and Soto (Reference Cohen and Soto2007)), model misspecification (Kalaitzidakis et al. (Reference Kalaitzidakis, Mamuneas, Savvides and Stengos2001), Delgado et al. (Reference Delgado, Henderson and Parmeter2014)), misallocation of the more educated individuals to low productivity sectors (Rogers (Reference Rogers2008), Schundeln and Playforth (Reference Schundeln and Playforth2014)), and also that education could be relevant to economic growth only after reaching some threshold (Ahsan and Haque (Reference Ahsan and Haque2017)). Here, we focus on the endogenous response of education quality.
The rest of the paper is organized as follows. Section 2 presents the model economy. In Section 3 we derive our main analytical results regarding the dynamic impact of education policies on human capital accumulation and growth. Section 4 extends the model to endogenize the choice of the tax rate and the public education budget. In Sections 5 and 6 we calibrate the model to a set of Latin American countries, to understand quantitatively the disconnect between growth in GDP per capita and in average years of schooling found in the data. Section 7 concludes.
2. Model
Consider an overlapping generations economy in which growth is the result of human capital accumulation. Individuals live for two periods and have to decide between a job as a teacher and a job in the private market in the second period.Footnote 5 The teachers’ wage is limited by the education budget. A single homogeneous consumption good is produced using the stock of human capital of market workers, which in turn depends on the average human capital of teachers.
2.1 Individuals
As in Galor and Moav (Reference Galor and Moav2000, Reference Galor and Moav2004), there is a continuum of measure 1 of individuals being born in every period. Individuals accumulate human capital in their first period of life and choose a career, work, and consume in their second period of life. Accumulation of human capital is compulsory and occurs in public schools. An individual born at
 $t-1$
derives utility from her consumption (
 $c_t^i$
), the public good provisioned by the government (
 $G_t$
), and the human capital of her offspring (
 $h_{t+1}^i$
):
 \begin{equation} u_t^i = \log (c_t^i) + \psi \log (G_t) + \phi \log (h_{t+1}^i) \end{equation}
where
 $\psi \gt 0$
measures how important the public good is relatively to private consumption, and
 $\phi \gt 0$
measures how altruistic are the parents. The public good
 $G_t$
represents all government-provided goods and services other than education.
Income is the result of occupational choice since we assume that the private market pays a higher wage for individuals with more human capital, whereas the teachers’ wage is the same for all hired individuals.Footnote 6 Specifically, a teacher earns the gross wage
 $w_t^T$
independently of her human capital. In turn, a market worker with human capital
 $h_t^i$
earns
 $w_t^M h_t^i$
, where
 $w_t^M$
is the market gross wage per unit of human capital. Budget constraints for market workers and teachers are respectively
 \begin{equation*} c_t^i \le (1-\tau ) w_t^M h_t^{i} \end{equation*}
 \begin{equation*} c_t^i \le (1-\tau ) w_t^T \end{equation*}
where
 $\tau$
is the tax rate on labor income. Individuals, however, differ in their innate ability
 $a^i$
, which is assumed to be distributed uniformly over the interval
 $[0,\bar{B}]$
(Galor and Moav (Reference Galor and Moav2000), Gilpin and Kaganovich (Reference Gilpin and Kaganovich2012)). Innate ability is a component of the human capital accumulation function, along with the proportion of the first period spent in school
 $s_{t-1}$
, and education quality
 $h_{t-1}^{T}$
. Thus,
 \begin{equation} h_t^{i} = Z a^i (s_{t-1})^\eta (h_{t-1}^{T})^v \end{equation}
where
 $\eta, v \in (0,1)$
, and
 $Z$
is a constant productivity term. We assume that
 $s_t$
is a function of the proportion of teachers in the labor force, which is not under the control of individuals. Specifically, more teachers are needed if children spend more years in school on average. We interpret
 $s_t$
as education quantity, whereas
 $h_t^T$
is education quality, measured by the average human capital of teachers.
Notice that, by assuming that
 $s_t$
is not the result of individuals’ choices, we are considering the case in which something like compulsory-schooling laws are in place (Acemoglu and Angrist (Reference Acemoglu and Angrist2000)). Therefore, one should think of our model as describing advancements in primary and secondary schooling, as they are compulsory in many countries.Footnote 7 Data from Barro and Lee (Reference Barro and Lee2013) indicates that the bulk of the recent increase in average years of schooling in developing countries came indeed from improvements in these education levels. Fig. A.2 in the Appendix shows that, for those middle and low-income countries that we have data, more than
 $94\%$
of the increase in average years of schooling was due to changes in education before college.
Individuals will choose a career, given their level of human capital and innate ability. By making the utility level of a private market worker equal to the utility level of a teacher, we reach the innate ability threshold
 $a_t^\star$
:
 \begin{equation} a_t^\star = \frac{w_t^T}{w_t^M} \cdot \frac{1}{Z.(s_{t-1})^\eta .(h_{t-1}^{T})^v} \end{equation}
Therefore, individuals with innate ability
 $a^i \gt a_t^\star$
will choose to be part of the private market in
 $t$
. Individuals with
 $a^i \lt a_t^\star$
would prefer to be teachers, but we impose as a restriction that the fraction of teachers in the labor force is constant and equal to
 $\theta$
for every
 $t$
. This can be thought of as a physical restriction: for a given educational infrastructure (e.g., a given number of schools), the government must hire
 $\theta$
teachers to make its educational system work properly. It cannot hire less than
 $\theta$
and would not be able to accommodate more than
 $\theta$
.
Teachers are hired through a process that occurs in every period and offers only
 $\theta$
jobs which, through competition among all applicants, are filled by the
 $\theta$
most qualified individuals. Fig. 2 shows what this restriction implies: all individuals with a sufficiently low level of innate ability will end up working in the private market in spite of their initial desire to be teachers.Footnote 8 We constrain the parameter values of this economy such the set
 $\left [a^\star -\bar{B}\theta, a^\star \right ]$
in Fig. 2 falls strictly inside the interval
 $\left [0,\bar{B}\right ]$
. This assumption will be precisely stated in Section 3.
The quality of education received by the generation born at
 $t$
, which is measured by the average human capital of teachers, is given by:
 \begin{equation} h_t^T = \frac{1}{\theta } \int _{a^\star - \bar{B}\theta }^{a^\star } h_t^i(a^i)dF(a^i) \end{equation}
Probability density function of innate ability. The dark gray area is the proportion
 $\theta$
of teachers in the population. Every individual whose innate ability is outside this dark gray area will be a private market employee.

2.2 Production of the consumption good
There is a single homogeneous consumption good being produced every period according to a constant-returns-to-scale production function.Footnote 9 This technology uses the stock of human capital of market workers as the only input. The output produced in
 $t$
is described by:
 \begin{equation} Y_t = A \cdot H_t \end{equation}
where
 $A$
is exogenous TFP and
 $H_t$
is the total human capital of market workers. Using the sets shown in Fig. 2,
 $H_t$
is
 \begin{equation} H_t = \int _{0}^{a^\star - \bar{B}\theta } h_t^i(a^i)dF(a^i) + \int _{a^\star }^{\bar{B}} h_t^i(a^i)dF(a^i) \end{equation}
The representative firm operates in a perfectly competitive environment. Taking the wage rate of private market employees
 $w_t^M$
as given, the producer in
 $t$
chooses the level of
 $H_t$
to maximize profits. As a result of this optimization,
 $w_t^M$
is set to equal the marginal productivity of human capital of market workers, which is also equal to the TFP level
 $A$
.
2.3 Government
A government collects a fraction
 $\tau$
of all individuals’ labor income and spends its revenue in two ways: paying teachers and providing the public good
 $G_t$
.Footnote 10 We assume that a constant fraction
 $p$
of the tax proceeds is allocated to teachers’ wages and that the government balances its budget in every
 $t$
. Therefore:
 \begin{equation} p.[\tau .w_t^M.H_t + \tau .w_t^T.\theta ] = \theta .w_t^T \end{equation}
 \begin{equation} (1-p).[\tau .w_t^M.H_t + \tau .w_t^T.\theta ] = G_t \end{equation}
where
 $w_t^T$
is the teachers’ wage. Equation (7) represents the education budget and is key for the quantity-quality mechanism emphasized here. The introduction of the public good
 $G$
will be important for quantitative purposes—specifically to make the tax rate
 $\tau$
compatible with the data.
Using equation (5) and the fact that
 $w_t^M = A$
, we can rewrite
 $w_t^T$
and
 $G_t$
such that
 \begin{equation} w_t^T = \frac{1}{\theta } \cdot \frac{p\tau }{1-p\tau } \cdot A H_t \end{equation}
 \begin{equation} G_t = \frac{(1-p)\tau }{1-p\tau } \cdot A H_t \end{equation}
2.4 Competitive equilibrium
A competitive equilibrium in this OLG economy is such that the following conditions are satisfied: (i) each adult makes a career decision by taking as given her innate ability level and the innate ability threshold, (ii) the representative firm producing the consumption good maximizes profits taking wages as given, (iii) the government spends all the tax revenue paying teachers and providing the public good, and (iv) markets clear. Thus, a formal definition of the competitive equilibrium can be presented as:
Definition 1.
A competitive equilibrium can be represented by sequences of the aggregate variables
 $\{Y_t, H_t, h_t^T, G_t\}_{t=0}^\infty$
, innate ability threshold
 $\{a_t^\star \}_{t=0}^\infty$
, and wages
 $\{w_t^M, w_t^T\}_{t=0}^\infty$
such that equations (
3
), (
9
), and (
10
) hold,
 $w_t^M=A$
, and human capital variables
 $\{H_t, h_t^T\}_{t=0}^\infty$
are the result of the aggregation of individuals’ occupational choices given the innate ability threshold sequence.
Additionally, the steady-state competitive equilibrium is such that all conditions of Definition 1 are met and both the stock of human capital of market workers (
 $H_t$
) and average teachers’ human capital (
 $h_t^T$
) are constant over time.
In this economy, GDP per capita is given by the sum of gross income of market workers and teachers. Using Fig. 2 intervals:
 \begin{equation*} GDP_t = \int _{0}^{a^\star - \bar {B}\theta } w_t^M h_t^i(a^i)dF(a^i) + \int _{a^\star }^{\bar {B}} w_t^M h_t^i(a^i)dF(a^i) + \int _{a^\star - \bar {B}\theta }^{a^\star } w_t^T dF(a^i) \end{equation*}
which can be rewritten, by using equations (6) and (9), as
 \begin{equation} GDP_t = A H_t + w_t^T \theta = \frac{A H_t}{1-p\tau } \end{equation}
2.5 Aggregation and human capital dynamics
The stock of human capital of market workers and the average human capital of teachers are a direct result of the innate ability distribution and the innate ability threshold. As shown in Fig. 2, every individual with
 $a^i \in [0;a^\star - \bar{B}\theta )$
or
 $a^i \in (a^\star ;\;\bar{B}]$
will end up working in the private market, whereas everyone with
 $a^i \in [a^\star - \bar{B}\theta ;\; a^\star ]$
will end up working as a teacher. By using these innate ability intervals, we can write
 $H_t$
and
 $h_t^T$
as functions of the average human capital of teachers in
 $t-1$
, which describes the dynamics of these variables.
Proposition 1. The stock of human capital of market workers and the average human capital of teachers are given respectively by
 \begin{equation} H_t = \frac{Z\bar{B}}{2} \cdot [(1+\theta ^2)(1-p\tau )] \cdot s^\eta \cdot (h_{t-1}^T)^v \end{equation}
 \begin{equation} h_t^T = \frac{Z \bar{B}}{2 \theta } \cdot [1 - (1+\theta ^2)(1-p\tau )] \cdot s^\eta \cdot (h_{t-1}^T)^v \end{equation}
Proof. See Appendix.
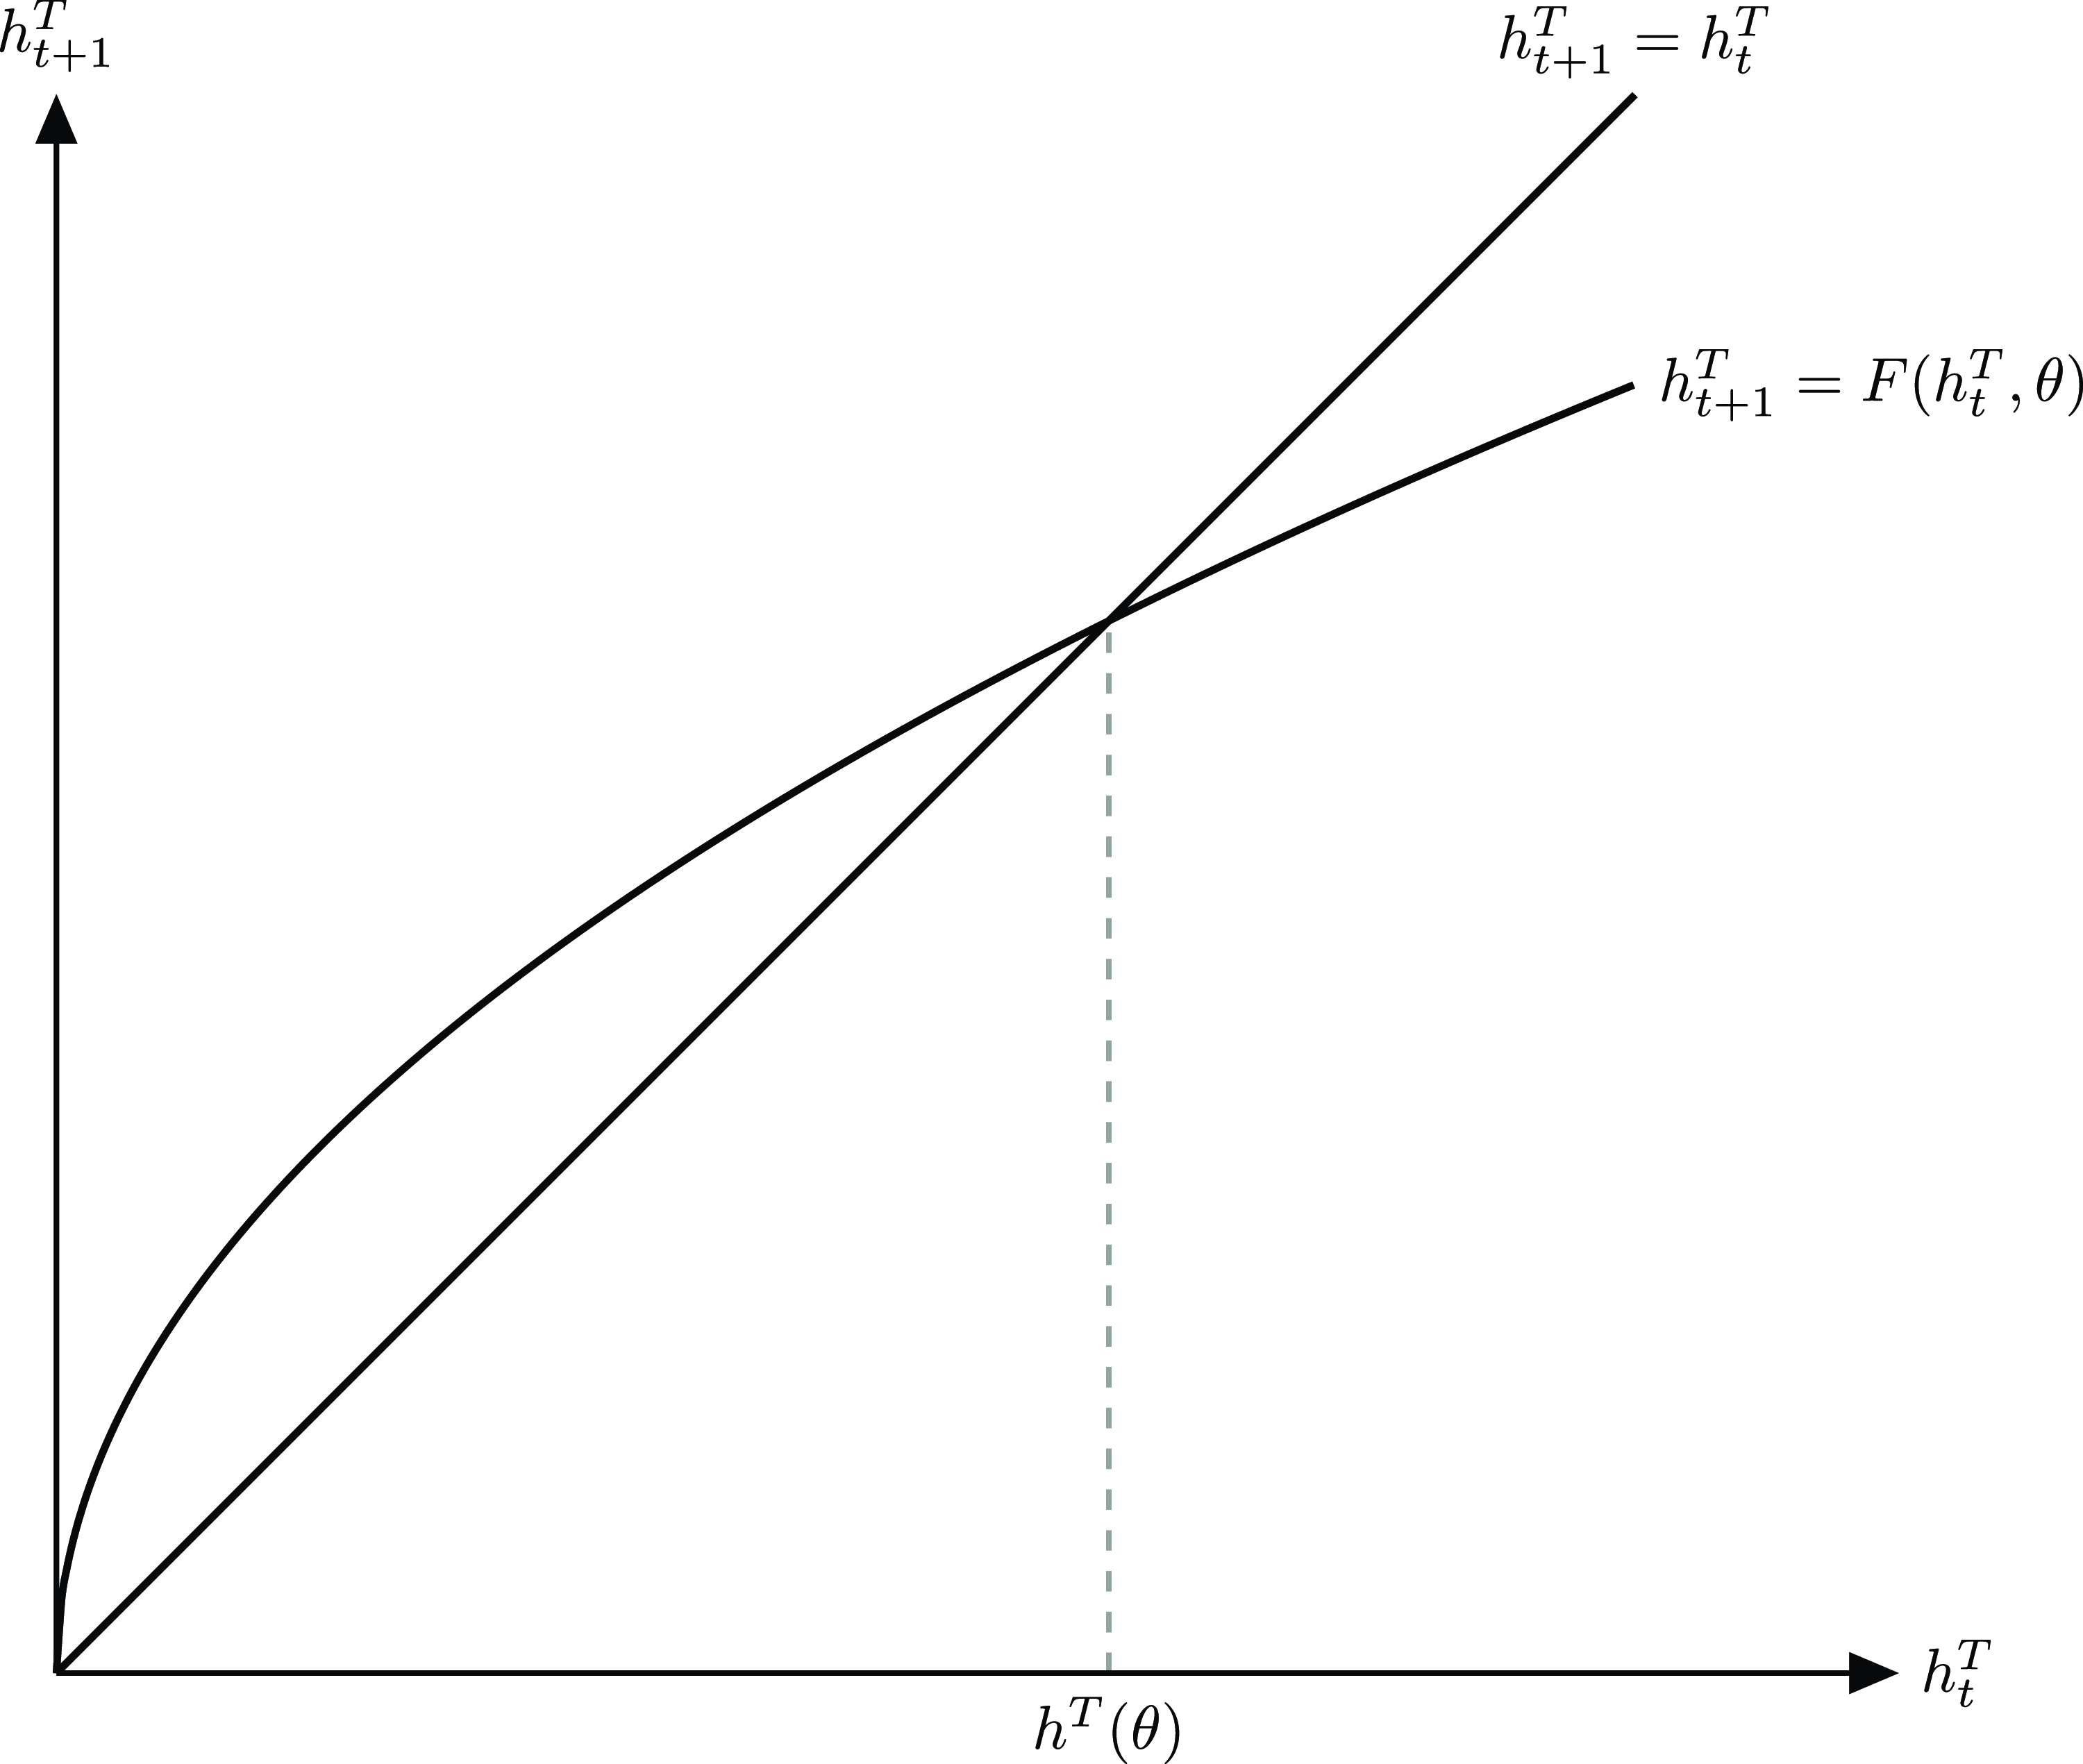
Fig. 3 illustrates the dynamics of the average human capital of teachers as given by equation (13). Equations (12) and (13) also show that the accumulation functions are closely related to the incentives that individuals face in the occupational choice process. Notice that, from these equations, the economywide stock of human capital is
 $\bar{H}_t = H_t + \theta h_t^T = \frac{Z \bar{B}}{2} s^\eta (h_{t-1}^T)^v$
. In particular, teachers’ total human capital
 $\theta h_t^T$
is a fraction
 $1-(1+\theta ^2)(1-p\tau )$
of the economywide human capital. Interestingly, an increase in
 $\theta$
, in spite of making teachers a larger share of the population, lowers their share in the overall human capital. Intuitively, we would have more teachers for the same public education budget, meaning that teachers’ wages would have to go down. As a result, the teaching career becomes less attractive, especially for relatively high-ability individuals that are close to the indifference threshold
 $a_t^\star$
. This leads to a decrease in teachers’ average human capital, as we will discuss in more detail later on.
Dynamics of the average human capital of teachers.
On the other hand, increases in the tax rate (
 $\tau$
) or in the share of education in the government budget (
 $p$
) contribute to raising the education budget. For the same
 $\theta$
, the government is able to pay higher wages for teachers. Relatively high-ability individuals then choose this career, thus increasing the share of teachers in overall human capital
 $\bar{H}_t$
. In line with this intuition, Figlio (Reference Figlio1997) presents evidence that the average starting teacher salary is positively related to the average quality of teachers. Moreover, Nagler et al. (Reference Nagler, Piopiunik and West2015) show that Florida teachers entering the profession during recessions (when the outside options are worse) have a higher average (value-added) quality.
3. The effect of increasing the quantity of education
Our main interest in this section is to understand both the short-run and long-run implications of increasing average years of schooling by hiring more teachers. We would like to answer
 $(i)$
what are the mechanisms through which government decisions affect individuals’ occupational choice and the selection of individuals into the teaching career, and
 $(ii)$
how policies that increase human capital quantity, such as the ones that we observed in the last decades in developing economies, affect the human capital quality and output.
3.1 Effect on the innate ability threshold
First, to guarantee that the fraction of teachers in the population is constant and equal to
 $\theta$
, we have to impose some conditions on the magnitude of
 $\theta$
, the income tax rate (
 $\tau$
) and the share of education in the government budget (
 $p$
) such that
 $a_t^\star$
lies inside the innate ability interval, that is,
 $\theta \bar{B} \lt a_t^\star \lt \bar{B}$
.
Assumption 1.
 $\theta$
,
 $p$
, and
 $\tau$
must be such that
 $ \frac{2 \theta ^2}{p(1+\theta ^2)} \lt \tau \lt \frac{2 \theta }{p(1+\theta ^2)}$
.
Assumption 1 guarantees that the share of teachers is sufficiently small so that the interval
 $\left [a^\star -\bar{B}\theta, a^\star \right ]$
in Fig. 2 always lies inside the ability set
 $\left [0, \bar{B}\right ]$
. In other words, the fraction of teachers is always equal to
 $\theta$
. The model’s dynamics then come entirely from the evolution of the average human capital of teachers, which is affected by the process of occupational choice and by the parameters that define who will become a teacher in the innate ability’s distribution. The following proposition evaluates the effect of increasing the number of teaching positions on occupational choice.
Proposition 2.
The innate ability threshold
 $a^\star$
is given by
 \begin{equation} a^\star = \frac{(1+\theta ^2)}{\theta } \cdot \frac{\bar{B}}{2} \cdot p \cdot \tau \end{equation}
such that
 $a^\star$
is decreasing in
 $\theta$
.
Proof. See Appendix.
Intuitively, a higher proportion of teachers in the economy will make the teaching career less attractive to all individuals, ceteris paribus. The same education budget will have to be divided by a larger number of teachers, which implies that the government will have to pay less for each teacher. By doing so, the individual who was indifferent between the career options will now strictly prefer to work in the private market. A greater
 $\theta$
means that potentially good teachers will face a relatively better outside option in the market. This leads to a selection problem in which the most qualified individuals choose not to apply for a job as a teacher.
We can see this effect in Fig. 2. The increase in
 $\theta$
shifts the set of teachers to the left. As a result, the average ability of teachers goes down. This happens not only because high-ability individuals (close to the threshold) choose to be market workers, but also because the policy pushes down the lower limit of the distribution of teachers. Individuals who would not be previously admitted to the teacher position (because of their lower ability) end up becoming teachers now.
3.2 Effect on aggregate variables
To see how an increase in
 $\theta$
affects the average human capital of teachers, the stock of human capital of market workers, and GDP per capita, we need to define more precisely the relationship between our measure of education quantity (i.e. time spent in school
 $s$
) and the proportion of teachers in the labor force (
 $\theta$
). Since the government has to hire more teachers if it wants to increase years of schooling,
 $s$
and
 $\theta$
are positively correlated. In particular, we assume a linear function:
 \begin{equation} s = K \cdot \theta \end{equation}
where
 $K$
represents a productivity term and may include a set of characteristics of the educational sector.Footnote 11
We now use equation (13) and its steady-state counterpart to understand how the proportion of teachers in the labor force affects the average human capital of teachers in the short and long run. This leads us to the following result:
Proposition 3.
A public policy that aims to increase the average years of schooling by hiring more teachers (i.e., increasing
 $\theta$
) has a negative impact on the average human capital of teachers (education quality) in both the short and long run.
Proof. See Appendix.
The short-run effect is closely related to the effects on occupational choice previously discussed. Notice that the teachers’ set in the ability distribution is
 $\left [a^\star -\bar{B}\theta, a^\star \right ]$
. The increase in
 $\theta$
shifts this set to the left (through a lower
 $a^\star$
) and reduces its lower limit even further. Consequently, the average ability of teachers falls in the short run. This effect is even stronger in the long run, as current teachers transmit their lower human capital to future generations’ teachers.
Fig. 4 illustrates this result and the mechanism through which the education quantity-quality tradeoff arises: the law of motion shifts down in response to the increase in
 $\theta$
and, consequently, the economy converges to a new steady state in which teachers’ average human capital is lower.
Dynamics of the average human capital of teachers and the number of teachers.

We now describe our main analytical results, which show how a policy that raises education quantity affects output per capita. Lemma 1 is useful to establish the long-run effects of such policy.
Lemma 1.
The elasticity of the long-run stock of human capital of market workers
 $H$
with respect to
 $\theta$
is given by
 \begin{equation} \xi _{H,\theta } = \frac{\eta - v}{1 - v} + \frac{2 \theta ^2}{1-v}\left [\frac{1-v}{1+\theta ^2} - \frac{v(1-p\tau )}{1-(1+\theta ^2)(1-p\tau )} \right ] \end{equation}
Proof. See Appendix.
Equation (16) is also the elasticity of GDP with respect to
 $\theta$
, since
 $GDP_t$
and
 $H_t$
are proportional for given tax rate
 $\tau$
and fraction
 $p$
(see equation (11)). In other words, depending on parameter values, GDP per capita may go up or down, as a result of an increase in
 $\theta$
.
Quantitatively,
 $\theta ^2$
is negligible for values of
 $\theta$
that are consistent with cross-country data. Thus,
 $\xi _{H,\theta }$
depends essentially on
 $\eta - v$
. Notice that
 $\eta$
and
 $v$
are, respectively, the exponents of quantity and quality of education in the production function of human capital (see equation (2)). Put differently, long-run GDP per capita tends to decrease (increase) in response to a policy that raises
 $\theta$
, when the return of quality is larger (smaller) than that of quantity.
To understand the meaning of this result, we first shut down the human capital quality channel by making
 $v \rightarrow 0$
. In this extreme case, equation (16) shows that an increase in education quantity (represented by a higher
 $\theta$
) would imply a higher stock of human capital of market workers and, therefore, a higher GDP per capita in the steady state. This is what one would expect as a result of the evolution of average years of schooling in most developing countries in the last decades. As discussed in the introduction, Fig. 1 shows that this is not the case: developing countries approached developed ones in terms of education quantity, but not in terms of GDP per capita.
When the human capital quality channel is working (
 $v\gt 0$
), the endogenous reaction of teachers’ human capital attenuates the effect of a higher
 $\theta$
(notice that
 $v$
enters with a negative sign in equation (16)). This is a direct result of the education quantity-quality tradeoff in which a higher number of teachers leads to an increase in the average years of schooling but also leads to a lower average quality of teachers. If the return of education quality
 $v$
is sufficiently large, steady-state GDP per capita may actually fall in response to an increase in
 $\theta$
, as the reduction in teachers’ human capital more than compensates for the higher education quantity.
In Proposition 4, we examine the effects of an increase in
 $\theta$
both in the short and the long run.
Proposition 4. A public policy that aims to increase average years of schooling by hiring more teachers has a positive impact on the stock of human capital of market workers and GDP per capita in the period right after the shock, but its long-run impact is ambiguous.
Proof. See Appendix.
A higher
 $\theta$
impacts
 $H_t$
and GDP per capita in an unambiguously positive way in the short run. This happens because some relatively skilled individuals who would previously choose the teaching career now prefer the private market. On the other hand, the long-run effect on
 $H_t$
depends on two forces working in opposite directions: skilled individuals are more attracted to the career on the private market, which makes
 $H_t$
higher, but at the same time
 $H_t$
is pulled down by the lower average teachers’ quality.
3.3 The effect of increasing the education budget
In the model, one could increase education quality by raising teachers’ wages, thus attracting more skilled individuals to this occupation. This could be obtained by increasing
 $\tau$
or
 $p$
, while keeping
 $\theta$
constant, thus enlarging the education budget for the same number of teachers. Proposition 5 shows that an increase in one of these two parameters indeed leads to a higher GDP in the long run.
Proposition 5.
The elasticity of
 $GDP$
with respect to
 $\tau$
and the elasticity of
 $GDP$
with respect to
 $p$
are identical and given by
 \begin{equation} \xi _{GDP,\tau } = \xi _{GDP,p} = \frac{p \tau v (1+\theta ^2)}{[1-(1+\theta ^2)(1-p\tau )](1-v)} \end{equation}
Thus, a public policy that increases teachers’ wages through (i) a higher income tax rate, or (ii) a larger fraction of the government budget devoted to education, leads to a higher
 $GDP$
per capita in the steady state.
Proof. See Appendix.
Interestingly, the effect on the human capital of market workers is ambiguous. There are two opposite forces at play here. On the one hand, a larger education budget raises teacher quality, which contributes to increasing the human capital of market workers. On the other hand, relatively skilled individuals end up not choosing to be market workers, which contributes to lowering steady-state
 $H$
. Nonetheless, even if
 $H$
falls in the long run, the increase in teachers’ income more than compensates for this effect. As a result, steady-state
 $GDP$
per capita goes up.
By showing that a higher education budget increases long-run
 $GDP$
per capita, Proposition 5 may be seen as a solution to the education quality problem imposed by increasing
 $\theta$
. A developing country experiencing a rapid increase in school attendance and average years of schooling could raise taxes or the fraction of the government budget assigned to education as a way to offset the negative effects on teacher wages. We return to this discussion in Section 6 and in the Conclusion.
4. Endogenous tax rate and the median voter
As an alternative mechanism for how the income tax rate is chosen, we follow the idea in Persson and Tabellini (Reference Persson and Tabellini1994) and Jaimovich and Rebelo (Reference Jaimovich and Rebelo2017) by making the tax rate the result of the median-voter optimization problem.Footnote 12 Cross-country data indicates that the share of teachers in the labor force is far less than
 $50\%$
. Consistently with this fact, we assume
 $\theta \lt 0.5$
. As we shall see, in this case, the median voter is a market worker. This individual faces the following tradeoff when choosing the tax rate. On the one hand, a higher
 $\tau$
implies a lower consumption level by reducing her disposable income. On the other hand, a higher
 $\tau$
means that the government would be able to increase the provision of the public good
 $G$
and raise teachers’ wages. The latter boosts the average teacher quality and the human capital of children, increasing the utility level of parents.
We can describe the optimization problem that the median-voter faces as the choice of
 $\tau$
that maximizes her utility level subject to her budget constraint, along with equations (2) and (13), which in turn can be written as:
 \begin{align*} \mathop{\text{maximize}}\limits _{\tau }&\qquad \log (c_t^i) + \psi \log (G_t) + \phi \log (h_{t+1}^i)\\[5pt] \text{subject to} &\qquad c_t^i = (1-\tau ) w_t^M h_t^{i}\\[5pt] &\qquad h_{t}^{i} = Z a^i s^\eta (h_{t-1}^{T})^v\\[5pt] &\qquad h_t^T = \frac{Z \bar{B}}{2 \theta } [1 - (1+\theta ^2)(1-p\tau )] s^\eta (h_{t-1}^T)^v \end{align*}
Proposition 6 describes the solution of this problem:
Proposition 6.
Suppose
 $\theta \lt 0.5$
. Then, the median voter is a market worker and her choice for the tax rate is the solution for the equation:
 \begin{equation} -\frac{1}{1-\tau ^\star } + \frac{\psi }{\tau ^\star } + \frac{\phi v p (1+\theta ^2)}{1 - (1+\theta ^2)(1-p\tau ^\star )} = 0 \end{equation}
Moreover,
 $\tau ^\star$
is increasing in
 $\theta$
.
Proof. See Appendix.
Notice that
 $\tau ^\star$
does not depend on the ability level, that is, all market workers would prefer the same tax rate. Since
 $\theta \lt 0.5$
, this guarantees that the median voter is indeed a market worker, and her choice is
 $\tau ^\star$
. From equation (18) one can see that the optimal income tax rate
 $\tau ^\star$
is a function of five objects: (i) how important the public good is to individuals (
 $\psi$
), (ii) the parental altruism parameter (
 $\phi$
), (iii) the education quality rate of return (
 $v$
), (iv) the proportion of teachers in the labor force (
 $\theta$
), and (v) the fraction of the government budget devoted to the education sector (
 $p$
). With the exception of
 $\psi$
, all other parameters are related to how important teachers are for children’s accumulation of human capital and how important children’s human capital is for parents, which in turn justifies an optimal
 $\tau \gt 0$
.
Furthermore,
 $\tau ^\star$
is increasing in
 $\theta$
. This result demonstrates that even a market worker recognizes the importance of attracting skilled individuals to the teaching career. In spite of negatively affecting her disposable income, the median voter would vote for a higher income tax rate in response to an increase in
 $\theta$
to prevent teachers’ salaries from falling too much.
5. Quantitative analysis
We now implement a series of quantitative exercises based on the model. We focus on a set of 16 Latin American countries for which we have complete data: Argentina, Bolivia, Brazil, Colombia, Chile, Costa Rica, Dominican Republic, Ecuador, Guatemala, Haiti, Honduras, Mexico, Nicaragua, Panama, Paraguay, and Uruguay. Together, these countries accounted for about
 $85\%$
of Latin America’s population and GDP in 2010 (data from the World Bank’s World Development Indicators).
As mentioned in the Introduction, the Latin American case is interesting for our study since the region did not experience significant convergence in income per capita relative to industrial economies, even though education quantity grew considerably. Within our sample, between 1970 and 2010, average schooling for these countries grew from
 $3.79$
to
 $8.20$
years. Some papers in the literature (Frankema (Reference Frankema2009), Manuelli and Seshadri (Reference Manuelli and Seshadri2011), Hanushek and Woessmann (Reference Hanushek and Woessmann2012), Levy and Schady (Reference Levy and Schady2013)) argue that education quality is behind this disconnect between education quantity and income in the region, which is precisely the channel we emphasize.
We focus on a policy experiment that increases education quantity by raising the share of teachers in the population (
 $\theta$
). This is done to match data on the share of teachers for Latin America in 1970 and 2010. Except for
 $\theta$
, all other parameters remain fixed. Parameter values are either borrowed from the literature or chosen to match moments from the data. We use the version of the model with
 $\tau$
determined endogenously by the median voter and implemented by the government. The parameter vector is composed of 10 parameters:
 $[\theta _{1970},\theta _{2010},\psi,\phi,Z,\eta,v,\bar{B},p,K]$
, where the first two entries are the share of teachers in 1970 and 2010, which represent the policy change analyzed.
5.1 Calibrated parameters
Policy parameters.—We begin by establishing values for the share of teachers in the population in 1970 and 2010, which we feed into the model to analyze the impact of a policy that increases education quantity. We calculate
 $\theta$
in
 $1970$
and
 $2010$
using census data from the Integrated Public Use Microdata Series (IPUMS, Minnesota Population Center (2020)).Footnote 13 We measure
 $\theta$
as the share of teachers in the population with the following restrictions: (i) the sample is restricted to individuals aged between 15 and 64, (ii) individuals must be part of the labor force and should not be identified as employers, and (iii) worker’s occupation should not be unknown or missing. The population-weighted average for all the 16 countries in our sample is such that
 $\theta = 2.66\%$
in
 $1970$
, and
 $\theta = 4.90\%$
in
 $2010$
.
 $\theta$
is the only parameter that changes over time. In what follows, we discuss the values chosen for the remaining parameters.
Human capital accumulation.—We choose the education quantity rate of return (
 $\eta$
) according to evidence from the microeconometric literature. There is a well-established consensus that the Mincerian return to an extra year of schooling is around
 $6\%-14\%$
(e.g., Psacharopoulos (Reference Psacharopoulos1994)). There is also evidence that the return to an extra year is lower as the average years of schooling increase (Psacharopoulos (Reference Psacharopoulos1994), Hall and Jones (Reference Hall and Jones1999), Caselli (Reference Caselli and Caselli2005)). Thus, we do not set a unique value for
 $\eta$
, but use the three main values in Psacharopoulos (Reference Psacharopoulos1994) which are, respectively, the average values for Sub-Saharan Africa, the world as a whole, and the Organisation for Economic Co-operation and Development (OECD) countries:
 $\eta =13.4\%$
,
 $\eta =10\%$
,
 $\eta =6.8\%$
.
Despite the ample evidence that education quality is indeed relevant for economic development (e.g., Schoellman (Reference Schoellman2012), Chetty et al. Reference Chetty, Friedman and Rockoff2014), that is,
 $v\gt 0$
, there is no consensus on the exact value for education quality’s rate of return
 $v$
. We therefore experiment with different values:
 $v=5\%$
,
 $v=10\%$
and
 $v=15\%$
. For comparison, we also report simulations for the case in which our quantity-quality mechanism is not at play, that is,
 $v=0$
.
Other features of the education sector.—To discipline the fraction of the government budget devoted to the education sector
 $p$
, we use data from the World Bank’s World Development Indicators. We measure
 $p$
as the 2010 population-weighted average of the government expenditure on education as a percentage of total government expenditure. In our sample, this leads to
 $p=16.4\%$
.
From equation (15),
 $K=s/\theta$
. Using 1970 averages across our countries for years of schooling and the proportion of teachers in the labor force, we set
 $K=4.74$
.Footnote 14 The choice of a constant
 $K$
means that we are keeping constant the institutional features of the education sector, which enables us to assess the effects of increasing education quantity in isolation.Footnote 15 Finally, we follow Galor and Moav (Reference Galor and Moav2000) and normalize
 $\bar{B}$
to one. Table 1 summarizes our choice of parameter values.
Calibrated parameters

5.2 Matching empirical moments
The remaining parameters (
 $\psi$
,
 $\phi$
, and
 $Z$
) are chosen such that, for each combination of
 $\eta$
and
 $v$
, the median-voter choice for
 $\tau$
and the ratio between teachers and market workers wages approximate empirical moments from the World Bank and Mizala and Nopo (Reference Mizala and Nopo2011) data. Given a combination of guessed values for
 $\psi$
,
 $\phi$
and
 $Z$
, we first compute
 $\tau ^\star$
for each country (by solving equation (18)), along with the steady-state ratio between teachers and market workers wages,
 $\omega =w^T/ w^M$
. For these calculations, we use country-specific values for
 $\theta$
and
 $p$
, which are taken from the World Development Indicators (year 2010).
We next contrast these simulated values of
 $\tau ^\star$
and
 $\omega$
with the data. In particular, let
 $\mu _\tau$
and
 $\mu _\omega$
be the averages of
 $\tau ^\star$
and
 $\omega$
across the 16 countries in our sample, and
 $\sigma _\tau$
and
 $\sigma _\omega$
be their respective variances. We obtain corresponding values from the data (denoted by an upper bar) using general government revenues as a percentage of GDP in 2010, and the relative hourly earnings between teachers and the comparison group of Mizala and Nopo (Reference Mizala and Nopo2011). Finally, we choose the combination of
 $\psi$
,
 $\phi$
, and
 $Z$
which minimizes:
 \begin{equation} (\mu _\tau -\overline{\mu }_\tau )^2+(\mu _\omega -\overline{\mu }_\omega )^2+(\sigma _\tau -\overline{\sigma }_\tau )^2+(\sigma _\omega -\overline{\sigma }_\omega )^2 \end{equation}
These values are contingent on our choice of
 $\eta$
and
 $v$
. Appendix Table A.1 shows the estimated values for
 $\psi$
,
 $\phi$
, and
 $Z$
, for different combinations of
 $\eta$
and
 $v$
, while Appendix Table A.3 displays targeted moments in comparison with their data counterparts. Even though the model is simple, it is able to approximate well the averages of
 $\tau$
and
 $\omega$
, for all combinations of
 $\eta$
and
 $v$
considered here.Footnote 16,
Footnote 17
6. Numeric simulations
Now we carry out two sets of simulations. First, we evaluate how the government’s decision to increase education quantity by hiring more teachers affects the occupational choice of individuals, and both the short-run and long-run GDP per capita for different combinations of
 $\eta$
and
 $v$
. Since returns to education quantity tend to diminish as schooling increases, this allows us to understand how the atenuation effect that comes from quantity-quality tradeoff varies in countries that were initially less or more educated. Second, we evaluate a policy that targets education quality, that is, an exogenous increase in the education budget which allows the government to pay higher wages to teachers.
6.1 Policy implications of increasing education quantity
Fig. 5 shows the aggregate effects, for different combinations of education quantity and quality rates of return, of an increase in the proportion of teachers in the labor force from
 $2.66\%$
to
 $4.90\%$
. This variation in
 $\theta$
is the result of the observed increase in the average years of schooling of our calibrated economy from
 $3.79$
in
 $1970$
to
 $8.20$
in 2010.
Path of GDP per capita in response to an increasing
 $\theta$
policy for different values of rates of return (distance from 1970 steady-state value).

In the upper panel we keep
 $\eta$
at 10%, and evaluate the paths for different values of
 $v$
. In all cases, output increases by 6.5% in the first period after the shock. As in Proposition 2, a higher
 $\theta$
leads to a lower innate ability threshold. Relatively high skilled individuals, who would previously have chosen a teaching career, now select a job in the private market. This leads to an increase in
 $H_t$
and output in the short run.
When there is no quantity-quality tradeoff (
 $v=0$
), this effect is permanent. However, as we consider higher values for
 $v$
, the short-run effect is attenuated by the endogenous reduction of education quality, as the lower human capital of teachers is transmitted to future generations, which drives down
 $H$
and GDP in the long run. For instance, when
 $v=5\%$
, the long-run increase in GDP is cut by nearly half. As we further increase
 $v$
, the quality reduction becomes stronger. The long-run effect on GDP is basically null when
 $v=10\%$
, and even becomes negative for
 $v$
sufficiently large.
In the lower panel of Fig. 5, we keep the quality parameter fixed (at
 $v=5\%$
), but vary the quantity parameter
 $\eta$
, using the three values suggested by Psacharopoulos (Reference Psacharopoulos1994) and Hall and Jones (Reference Hall and Jones1999)—
 $\eta =13.4\%$
(Sub-Saharan Africa),
 $\eta =10\%$
(world average), and
 $\eta =6.8\%$
(OECD). In other words, richer countries, where the population is already more educated, tend to display lower returns to further increasing education quantity.
As it becomes clear, the higher the return to quantity
 $\eta$
, the larger the impact of increasing
 $\theta$
—both in the short and long run. In other words, for poorer countries, with low schooling, gains in GDP per capita can be achieved through raising education quantity. However, as countries develop, this policy becomes less effective. While this is true even when our main mechanism is not at play (
 $v=0$
), our paper provides an alternative channel to continue raising living standards through human capital accumulation—via investments in education quality. We discuss this exercise next.
6.2 Changes in the education budget
As mentioned in Section 3.3, a country could increase education quality by raising the fraction of the government budget assigned to the education sector
 $p$
, since this would ultimately increase teachers’ wages. We now evaluate this effect quantitatively. We keep
 $\theta$
fixed at its 2010 value of
 $4.90\%$
; the remaining parameter values are those displayed in Table 1. In particular, we consider the economy initially in the steady state with
 $p$
at the baseline value of 16.4%, which corresponds to Latin America’s average education share in overall government spending in 2010.
In a sample of 134 countries around the world, the standard deviation of
 $p$
is 5% in 2010. Thus, starting from our baseline, we consider changes of 1 and 2 standard deviations (i.e., 5 and 10 percentage points) in this parameter. We experiment with two values for the education quality parameter—
 $v=5\%$
and
 $v=10\%$
.
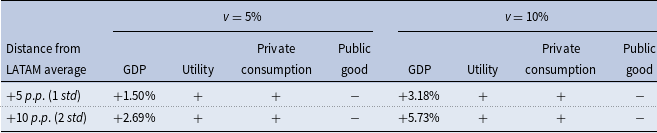
Table 2 displays the results of these exercises. We focus on the long-run impact on GDP per capita. For instance, when
 $v=5\%$
, increasing
 $p$
by 5 percentage points boosts the level of GDP per capita by 1.5%. For higher values of
 $v$
, this effect becomes stronger—3.2% in the case of
 $v=10\%$
.
Long-run effect of increasing the fraction of the government budget allocated to education
Notice that our results are not affected by the return to education quantity parameter
 $\eta$
. This is apparent from Proposition 5, which shows that the elasticity of GDP with respect to
 $p$
does not depend on
 $\eta$
. Taken together, the results from the last two subsections then imply that, as countries develop and the return to education quantity falls, investments in education quality become relatively more important to further raise GDP per capita.
An important question is whether voters would support such an increase in the education budget. The change entails increases in both private consumption and the human capital of children (which raises utility), but a decrease in the public good provision (which lowers utility). In the cases described in Table 2, there is a monotonic increase in the overall utility of private workers as
 $p$
rises from the baseline. So the median voter is better off with the changes in
 $p$
considered here.Footnote 18
7. Conclusion
Over the last half-century, we have witnessed a rapid expansion in average years of schooling especially in developing countries, making the world a less unequal place in terms of education quantity. We have not witnessed, however, a similar convergence pattern in the world distribution of GDP per capita. In this paper, we developed an overlapping generations model in which a tradeoff between the quantity and quality of education can help us to understand what is behind the pattern observed in the cross-country data.
In this model, individuals are heterogeneous in their innate ability, and the human capital accumulated in public schools is influenced by the average quality of those individuals who choose to be teachers in their adulthood. Given the balanced government budget, the model predicts that a policy to increase the population’s average years of schooling will be followed by a decrease in the quality of teachers both in the short and the long run. As a result, the long-run effect of this same policy on both the stock of human capital of market workers and GDP per capita is ambiguous, despite an unambiguous short-run positive effect. Moreover, we show that the sign and magnitude of this long-run effect are directly related to the education quantity and education quality rates of return in the human capital accumulation function.
To understand the quantitative implications of the model, we calibrate it to Latin America. We simulate a policy that matches the increase in average years of schooling observed in the region between
 $1970$
and
 $2010$
. We explore the case where the rate of return on education quantity decreases as a country accumulates human capital by raising years of schooling. This implies that, as countries develop, investments in education quantity become progressively less effective in raising living standards, while investments in education quality gain relative importance.
An important question is why developing countries often do not pursue policies that target education quality. Some, as several Latin American countries, seem to be stuck in a middle-income trap, despite large increases in schooling. Keefer et al. (Reference Keefer, Scartascini and Vlaicu2022), for instance, indicate that public spending in developing countries is more concentrated in current expenditures rather than public investment in capital and education. One potential explanation for this pattern is related to voter preferences over public spending: poorer voters, who have a higher probability of being pivotal in developing countries, are more likely to support policies that are short-run biased, such as cash transfers (Cerda and Vergara (Reference Cerda and Vergara2008), Bursztyn (Reference Bursztyn2016)).Footnote 19
To understand these issues, a potentially fruitful avenue of future research involves incorporating to the model other dimensions of heterogeneity (of preferences, for instance) and a richer treatment of inequality.
Supplementary material
The supplementary material for this article can be found at https://doi.org/10.1017/S1365100524000294
Acknowledgements
We thank an anonymous referee for comments and suggestions that greatly improved this paper. We also thank Carlos Eduardo Goncalves, Cezar Santos, Eduardo Correia, Loukas Karabarbounis, Gabriel Madeira, Marcos Nakaguma, Oded Galor, Ricardo Madeira, Raphael Corbi, Ricardo Sabbadini, Vladimir Ponczek, and seminar participants at University of Sao Paulo, 2016 Brazilian Econometric Society Annual Meeting, and 2017 CAEN-EPGE Meeting for several helpful comments. Danilo Souza gratefully acknowledges financial support from the PhD Fellowship of the Brazil National Council of Technological and Scientific Development and from the Coordination for the Improvement of Higher Education Personnel (CAPES). Mauro Rodrigues thanks CAPES and Fundação Instituto de Pesquisas Econômicas for financial support.
Declarations
No funding was received for conducting this study. The authors have no relevant financial or non-financial interests to disclose. Code and data used in the numeric simulations are available upon request.



