I. INTRODUCTION
We present a prototype G-band receiver module that extends heterodyne high electron mobility transistor (HEMT) amplifier technology to the 140–180 GHz frequency range [Reference Voll1]. This frequency range is important for many astrophysical applications, including the separation of cosmic microwave background (CMB) signal from astrophysical foregrounds [Reference Ade2]. This band can also be used in experiments that conduct broad-band spectral mapping of nearby galaxies and interferometers that map the Sunyaev–Zeldovich effect, which is the inverse Compton scattering of CMB photons by hot gas in galaxy clusters [Reference Sunyaev and Zeldovich3, Reference Sunyaev and Zeldovich4]. For large-scale instruments, the demonstrated compactness and scalability of the module will enable hundreds or thousands of pixels in a single focal plane.
Multichip modules for various applications, including radar and Earth atmospheric sensing, have been developed for a wide range of frequency bands [Reference Samoska, Pukala, Soria and Sadowy5–Reference Khaikin, Zakamov, Shashkin, Kuzmin and Radzikhovsky11]. Cryogenic modules have also been developed at Q- and W-band for astronomical receivers [Reference Cleary12, Reference Sieth13]. The motivation to extend this compact cryogenic receiver technology to the G-band was the development of InP ultra-low-noise amplifiers (LNAs), which are discussed in Section II. B. The module housing was constructed to meet design goals for manufacturing and miniaturization, as outlined in Section II. C. Preliminary data were collected by sweeping the local oscillator (LO) and measuring the double sideband intermediate frequency (IF) output from 25 to 500 MHz. The setup of the Y-factor test method used for noise temperature measurements is reviewed in Section III. The LO sweep data, discussed in Section IV, showed a minimum noise temperature of 384 K at room temperature and 58 K at 22 K physical temperature. Section V describes the setup for the IF sweep data presented in Section VI.
II. MODULE DESIGN
A) Overview
The module design is represented schematically in Fig. 1. Incident radiation is collected by an external feedhorn antenna and directed through a WR-05 waveguide cavity to the components in the block diagram, where the radio frequency (RF) signal is amplified by three LNAs, filtered by bandpass filters, and down-converted to the IF band by a second harmonic mixer. The module has been tested in two different ways: first with two LNAs connected to a single bandpass filter, and then with a third LNA and second filter added before the mixer. The third LNA was added after initial tests showed that the noise contribution of the mixer and backend IF amplifier was significant. The LO signal for the second harmonic mixer is fed into the module housing via WR-10 waveguide. E-plane probes extending into the waveguide cavity provide the transitions from the WR-10 and WR-05 waveguide inputs to the planar monolithic microwave integrated circuit (MMIC) components. The LNAs, mixer, filters, and E-plane probes populating the module were selected based on availability and the desired frequency band (140–180 GHz) and are discussed in Section B.
A block diagram of the module.

The module housing design addressed many construction challenges, including the need for compactness to fit in close-packed arrays and rapid assembly to demonstrate scalability. Reliable connections and signal transmission become more difficult to achieve at higher frequencies, so selecting viable interconnects and signal routing techniques was a challenge. Waveguide inputs were chosen for the RF and LO because they have low loss and because many readily available standard components use waveguide interfaces. The broadband IF signal is routed out of the module through a coaxial connectorFootnote 1 which was chosen because of proven reliability and operation up to 40 GHz. The design characteristics of the module block are discussed in detail in Section C.
B) Components
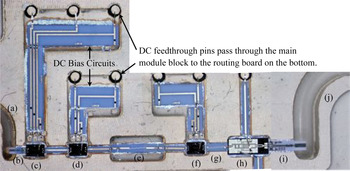
The module components are shown in the housing photograph in Fig. 2. The LNAs, filters, and mixer were designed by the authors at Jet Propulsion Laboratory (JPL) for different applications and selected for this module based on availability and performance. The LNA design is based on Northrop Grumman Corporation's 35 nm InP HEMT technology and is described in detail in [Reference Kangaslahti, Pukala, Gaier, Deal, Mei and Lai14–Reference Kangaslahti16]. The three LNAs amplify the incoming RF signal and pass it to the bandpass filters, which protect against any LO leakage from the mixer that could otherwise cause compression of the nearest LNA. The second harmonic MMIC mixer was designed based on the 1 µm Schottky diode process of United Monolithic Semiconductor. The process has a cut-off frequency of 3 THz and is well suited for mixer work at 150 GHz. The E-plane probe design for the WR-10 waveguide to MMIC transition is described in [Reference Leong and Weinreb17] and was fabricated on 101.6 µm (4 mil) alumina, while the WR-05 probe was fabricated on 58 µm (2.3 mil) alumina. The design and individual performances of these chips are discussed in detail by the authors elsewhere [Reference Voll18], along with a discussion on the expected noise performance of the module. The LNAs, filter, and mixer are connected by pieces of 50 Ω microstrip on 76.2 µm (3 mil) alumina. DC bias for the active components is provided through circuit boards connected to the feedthrough pins. The MMIC components, microstrip lines, and bias circuitry are all epoxiedFootnote 2 into a 254 µm (10 mil) deep cavity in the module housing and connected using gold ribbon wirebonds.
Composite photograph of the MMIC channel. The WR-05 waveguide RF input is labeled (a) and the WR-10 waveguide LO input is labeled (j). The E-plane transition probes are labeled (b) and (i) for the WR-05 and WR-10 scale transitions, respectively. The LNAs are labeled (c), (d), and (f). Bandpass filters are labeled (e) and (g) and the mixer is labeled (h). DC bias circuits and DC feedthrough pins are also shown.

C) Scalability
The module housing was designed to include several important characteristics that demonstrate its capabilities for various instruments. The overall size of the module block was kept as small as possible in order to confirm that hundreds or thousands of modules could be packed into arrays suitable for deployment on a telescope. Scalability to large arrays also requires that the modules be mass-producible, so the design incorporates a split block to allow easy access to the MMIC channel during assembly. In the future, the intent is that these modules can be manufactured quickly and efficiently using an automated assembly process.
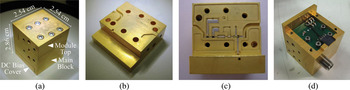
Figure 3 shows photographs of the module housing which illustrate the split-block design and the overall compactness of the module. All the components for amplification, filtering, downconversion, and biasing fit into a gold-plated brass block that is 2.54 × 2.54 × 2.86 cm3. In Fig. 3(c) the chip cavity is exposed, showing how the components fit into the block. The bias circuits connect to DC feedthroughsFootnote 3 that pass through the block to the routing board on the reverse side, shown in Fig. 3(d). This keeps the bias components close to the chips and allows the entire module bias to be condensed into a single nine-pin connectorFootnote 4 input. The coaxial connector for the IF is also visible in Fig. 3(d). Further discussion on the module design characteristics can be found elsewhere [Reference Voll18].
Photographs showing the split-block design of the module, the MMIC cavity on the top of the module housing, and the DC bias routing board on the bottom of the main block that connects to the MMIC cavity via DC feedthrough pins. (a) Photograph with labels and dimensions of the assembled module; (b) Photograph of the module top showing the split waveguide cavities; (c) Photograph of the upper surface of the main block with the module top removed. The module was only populated with two LNAs at the time of this photograph; and (d) Photograph of the bottom of the main module block with the DC bias cover removed. The DC routing board and IF connector are visible.

III. TEST SETUP FOR LO SWEEP MEASUREMENTS
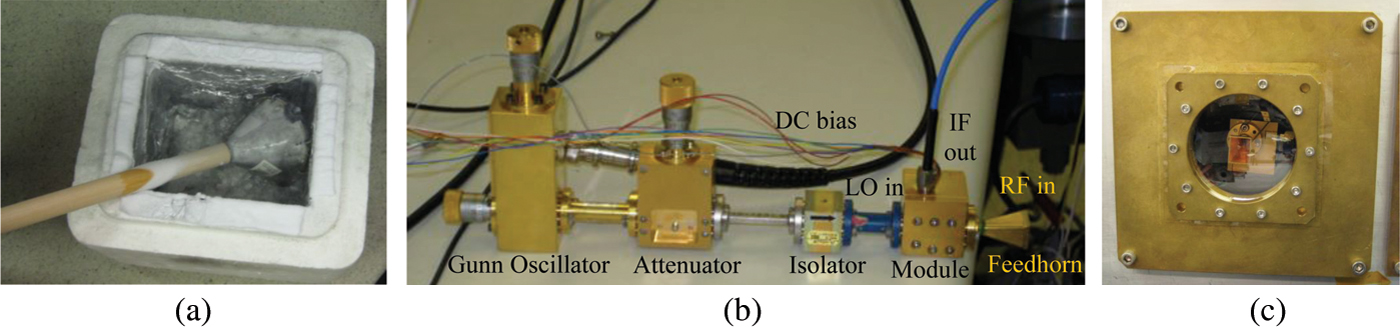
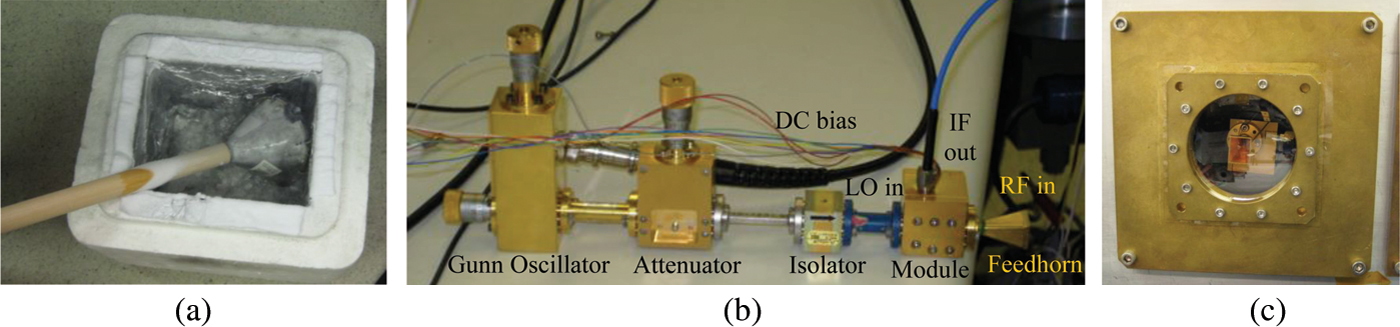
The noise temperature was measured using the standard warm and cold load Y-factor method with a swept LO and IF fixed at 25–500 MHz by backend filters. The warm load was ambient room temperature (295 K) and the cold load was provided by liquid nitrogen (77 K). Cones supporting a micowave absorber liningFootnote 5 were brought into thermal equilibrium with the air or with liquid nitrogen through immersion to provide the loads (see Fig. 4(a)). The total power output of the module setup was measured using a power meter and was calibrated for the backend amplifiers and filters. Total power measurements were collected for the two loads and used to calculate the Y-factor and noise temperature at each LO frequency. Fig. 4(b) shows the room temperature test setup. Cryogenic data were collected at about 22 K physical temperature using a cryostat with a 1 mil mylar window (see Fig. 4(c)) and the same warm and cold loads. The insertion loss of a piece of 1 mil mylar was measured to be 0.3 dB across the RF band. The LO was provided by a Gunn oscillator, with the output power controlled by an attenuator. Bias conditions were optimized for each data point, with LNA drain voltages ranging from 0.35 to 0.80 V and currents from 6.6 to 20.0 mA. The mixer requires around 10 dBm of LO power for optimal operation.
Photographs showing parts of the LO sweep test setup for room temperature and cryogenic measurements. Incoming radiation is incident on the feedhorn antenna and input to the module, which passes the IF signal to the backend readout. The feedhorn antenna and module in the cryostat are visible through the window in (c). (a) Photograph of the cold load used for the Y-factor measurements in a liquid nitrogen bath; (b) Photograph of the room temperature test setup. The second harmonic mixer in the module requires a W-band LO signal input, which is provided by a Gunn oscillator and controlled by an attenuator; and (c) Photograph of the mylar window on the cryostat used for cryogenic testing of the module.
IV. LO SWEEP TEST RESULTS
A) Noise temperature
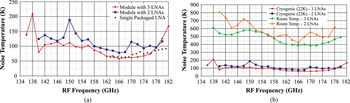
The test results indicate that the module has achieved a spot noise temperature of 384 K at room temperature and 58 K at 22 K physical temperature. In addition, cryogenic tests demonstrate an average noise temperature of 87 K over a 40 GHz band from 140 to 180 GHz (see Fig. 5(a)). The average noise temperature is 65 K over a 14 GHz band from 162 to 176 GHz. The greater noise temperature in the lower part of the band is due to increased conversion loss in the mixer. Room temperature noise values were approximately six times greater than cryogenic values (see Fig. 5(b)).
Cryogenic and room temperature noise measurements for swept LO. (a) Graph of cryogenic (22 K) noise temperature data for the module populated with two LNAs (blue squares) and three LNAs (red diamonds). With three LNAs, the module noise temperature is consistent with the measured noise of a single LNA, which is also plotted; and (b) Graph of noise temperature data collected when the module was at room temperature and populated with two LNAs (orange triangles) and three LNAs (green circles) measurements. The cryogenic noise temperature data from (a) is also included for comparison.

The module populated with only two LNAs was not achieving the necessary gain for successful Y-factor measurements at all frequencies, so a third LNA was added, which decreased the noise temperature by about 20 K. Figure 5(a) also shows the noise temperature of a single-packaged LNA, which was measured in a setup similar to that of the LO sweep module tests [Reference Samoska19, Reference Samoska20]. The LNA package had WR-05 waveguide input and output ports. The noise temperature was measured using the Y-factor method with warm and cold loads provided by the same sources described above. A packaged mixer was attached to the output of the LNA block for signal downconversion. The backend amplifiers and filters that were used on the IF output were the same as for the module measurements, and the total power output was measured with a power meter.
B) Gain
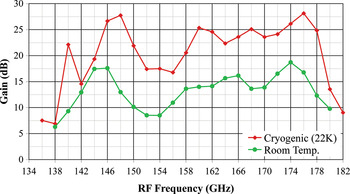
Cooling the module to 22 K increased the module gain by approximately 10 dB compared to room temperature measurements (see Fig. 6). The maximum module gain measured for the LO sweep at cryogenic temperature is 28 dB at 176 GHz RF. The average gain is 22 dB over a 40 GHz RF band from 140 to 180 GHz. The reduced gain around 154 GHz RF is due to greater mixer conversion loss in that range and causes an increase in noise temperature.
Graph of the measured gain for the three LNA module both at room temperature (green circles) and under cryogenic conditions (red diamonds). By cooling the module to 22 K, the gain increased by approximately 10 dB. The LO was swept and the IF was constrained to 25–500 MHz by backend filters.

V. IF SWEEP TEST SETUP
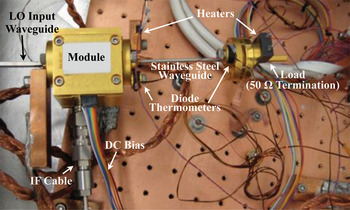
A different test setup that allowed for more automation of the data collection was used for the IF sweep noise temperature and gain tests of the receiver module. The standard Y-factor method was also employed for this setup, but instead of the hot and cold load radiation being collected by a feedhorn antenna through a window, the loads were provided by a 50 Ω termination with an attached resistive heater inside the cryostat. The heated termination load was separated from the module by a length of stainless–steel waveguide to provide a thermal break and was heated to 40 K for the hot load and cooled to 14 K for the cold load. Measurements of the stainless steel waveguide piece were used to automatically calibrate the collected Y-factor data. The module was maintained at a temperature of 16 K throughout the testing for consistency in the results. The IF sweep test setup inside the cryostat is pictured in Fig. 7.
Labeled photograph of the IF sweep test setup inside the cryostat.

The backend for IF sweep tests was also different. The IF signal is amplified outside the cryostat and then downconverted by a backend mixer. The LO for the backend mixer is swept so that the module output power at each frequency in the module IF band can be measured by a spectrum analyzer set to zero span at 200 MHz.
VI. IF SWEEP TEST RESULTS
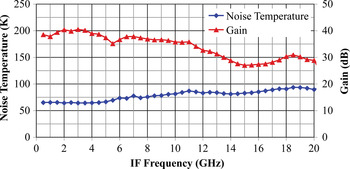
An IF sweep measurement for an LO of 83 GHz is plotted in Fig. 8. The noise temperature is less than 94 K over a 20 GHz band, with a minimum noise temperature of 65 K in the range from 0.5 to 4.5 GHz. The gain ranges from 40 to 27 dB with an average of 34 dB. The gain for these measurements is greater than the gain in the LO sweep measurements because the LNA drain voltages were increased to 1.1–1.3 V. One set of bias settings was used for the full IF sweep. The module was populated with three LNAs for the IF sweep measurements. The module provides no sideband separation, so the measurement at each IF is the combination of both upper and lower sidebands.
Graph of the measured noise temperature (blue diamonds) and gain (red triangles) as a function of IF frequency for an LO of 83GHz.

For the LO sweep tests, it was found that if the drain for the first LNA was biased above about 0.5 V, the current would fall and could not be controlled by the gate or drain values. However, shining a flashlight through the cryostat window and into the feedhorn brought the drain current back, suggesting that there could be an electron trapping effect on the first LNA. When the module was cooled for IF sweep tests the behavior of the first LNA returned to normal, so greater drain voltages were used. Tests are ongoing to understand the behavior of the first LNA and determine the best method for optimal testing.
A) Test for linearity
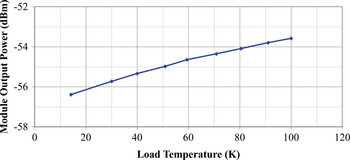
Non-linear effects were a concern for the IF sweep due to the increased drain voltages, so the output power of the module was measured as a function of load temperature. The output power was measured at 0.5 GHz IF frequency because the power was greatest at low IF values. The measurements are plotted in Fig. 9 and show a linear relationship throughout the test range, which extends beyond the 40 K hot load used for the IF sweep.
Graph of the module output power as a function of load temperature, showing that the relationship is linear in the test region.

VII. FUTURE WORK
Additional tests of the current prototype are anticipated to further explore the capabilities of the receiver. The LO sweep tests will be repeated with greater drain voltage values using the heated termination load test setup and IF sweeps will be collected for different LO values. In addition, individual LNAs will be packaged in WR-06 test blocks to measure independently their performance below 160 GHz.
Improvements implemented for a new set of modules are expected to further decrease the average noise temperature and extend the performance to lower frequencies for better coverage of the atmospheric window. These improvements include implementing an IQ system to allow for sideband separation and replacing the mixer with one that has lower conversion loss in the desired frequency band and requires less LO power. The WR-05 waveguide input will be replaced with WR-06 waveguide and a new transition probe.
New design features will also reduce the size of the module and increase the ease of assembling arrays of modules. The coaxial connectors will be replaced by smaller push-on connectors,Footnote 6 allowing fast, snap-on array assembly. The DC feedthrough pins will also be replaced by shorter pins to reduce the thickness of the module.
VIII. CONCLUSION
The prototype G-band module demonstrates a record cryogenic noise temperature for HEMT amplifiers. A spot noise temperature of 58 K is measured at 166 GHz and the average noise temperature is 87 K over a 40 GHz RF band. The IF sweep at an LO of 83 GHz shows a 20 GHz IF band with noise temperature under 94 K and an average gain of 34 dB. This prototype demonstrates compactness to enable scalability for large arrays.
ACKNOWLEDGEMENTS
The authors would like to acknowledge Richard Lai and Gerry Mei of the Northrop Grumman Corporation for development of the HEMT MMIC process used for the LNA. This research was carried out in part at the JPL, California Institute of Technology, under a contract with the National Aeronautics and Space Administration. This work is supported by the JPL Strategic University Research Partnership Program and the SLAC Laboratory Directed Research and Development Program, Department of Energy contract DE-AC03-76SF00515. P.V. thanks the Harriett G. Jenkins Pre-doctoral Fellowship Program for their support.
 Patricia Voll received her B.S. in physics with college honors from the University of Washington in 2007. She is currently a graduate student in Applied Physics at Stanford University, where she has been working on CMB instrumentation with Professor Sarah Church since 2008. She is a Harriet G. Jenkins Pre-doctoral Fellowship Program (JPFP) Fellow.
 Lorene Samoska received the B.S. degree in Engineering Physics from the University of Illinois in 1989, and the Ph.D. degree in Materials Engineering from the University of California, Santa Barbara, in 1995. From 1995 until 1997, she was an associate research engineer at the Electrical and Computer Engineering Department at UC Santa Barbara, where she worked on the design and fabrication of state-of-the-art InP HBT microwave digital circuits. She joined the Jet Propulsion Laboratory in 1998, where she is currently a Principal Engineer. Her research interests include the design and testing of .03–1 THz low–noise radiometers and power amplifiers for local oscillator sources and transmitters in future space missions.
 Sarah Church received her B.A. in 1986 and her Ph.D. in 1991 from Cambridge University. She has been a professor at Stanford University since 1999 and served as the Deputy Director of KIPAC from 2007 to 2011. Her research interests are in observational cosmology, including Cosmic Microwave Background anisotropies and the Sunyaev-Zel'dovich Effect.
 Judy M. Lau received her B.S. degree in engineering physics from University of California, Berkeley in 2002 and her Ph.D. in physics from Princeton University in 2007. She was a postdoctoral scholar at Stanford from 2007–2011. She is currently working at Theranos in Palo Alto, CA.
 Matthew Sieth received his B.S. in 2007 from the Physics department of the University of Wisconsin – Madison. He has been working at Stanford University as a Ph.D. candidate since 2007.
 Todd Gaier is the supervisor for JPLs Microwave Systems Technology Group. He received his Ph.D. in Physics from the University of California, Santa Barbara in 1993. His research interests include millimeter–wave electronics for applications in astrophysics and Earth remote sensing. His group develops technologies and instruments using monolithic microwave–integrated circuit (MMIC) components operating at frequencies 1–250 GHz. Active projects in the group include the Planck-LFI mission to study the anisotropy and polarization of the cosmic microwave background (CMB); the Q/U Imaging Experiment (QUIET) exploring the polarization of the CMB; GeoSTAR an interferometric synthetic aperture imager for Earth atmospheric sounding from geostationary orbit; the Advanced Microwave Radiometers for the Jason-II Mission mapping small variations in sea level across the globe monitoring conditions such as El-Nino and the integrated receivers for the Juno Microwave Radiometers.
 Pekka Kangaslahti received the M.Sc. and Ph.D. degrees from the Aalto University (Formerly Helsinki University of Technology), Espoo, Finland, in 1992 and 1999, respectively. He is currently with Jet Propulsion Laboratory (JPL), California Institute of Technology, Pasadena, where he designs low–noise MMIC amplifiers and receivers for astrophysics and remote sensing applications. Dr Kangaslahti developed microwave and millimeter–wave instruments for Cassini/Huygens, Planck and Juno missionsand currently focuses on receiver development for large arrays.
 Mary Soria is a Senior Engineering Technical Assistant at the Jet Propulsion Laboratory in Pasadena, CA. She has over 25 years of experience in the field of hybrid microelectronics. She has contributed to the assembly, technical support, and testing of numerous atmospheric and interspace projects on lab over the last 12 years. Her specialties include microassembly of MMIC modules from 1–400 GHz. She is a contributing author on numerous IEEE papers, and the recipient of several NASA Tech Brief Awards.
 Sami Tantawi received the B.Sc. and M.Sc. degrees in electrical engineering from Cairo University, Giza, Egypt, in 1984, and 1987, respectively, and the Ph.D. degree in electrical engineering from the University of Maryland at College Park, in 1992. Since 1992, he has been a Stanford Physicist with the SLAC National Accelerator Laboratory in Stanford, CA, where he has been responsible for the design and implementation of high-power RF pulse compression systems. In 2002, he became an Associate professor of particle physics and Astrophysics with SLAC, Stanford University. His research interests include vacuum electronics, high-power RF devices, modeling of RF structures, planner RF circuits, and high–gradient accelerator structures. Dr Tantawi is a Fellow of the American Physical Society. He was awarded the U.S. Particle Accelerator School Prize for achievements in accelerator physics and technology in 2003.
 Dan Van Winkle has a BSEL degree from Cal Poly San Luis Obispo, and an MSEE degree from Santa Clara University. He has been designing circuits in the microwave and mm-wave field for the last 27 years. Dan is currently the department head of the Electronics group in the Instrument and Controls division at the SLAC National Accelerator Laboratory.