1. INTRODUCTION
There are many factors mentioned in the literature as affecting the frequency of ship Grounding Accidents (GA) (Jebson and Papakonstantinou, Reference Jebsen and Papakonstantinou1997; Fujii et al., Reference Fujii, Oshima, Yamanouchi and Mizuki1974; Samuelides et al., Reference Samuelides, Ventikos and Gemelos2009, Briggs et al., Reference Briggs, Borgman and Bratteland2003; Lin, Reference Lin1999; Quy et al., Reference Quy, Vrijling, Gelder and Groenveld2006; Martins and Maturana, Reference Martins and Maturana2010; Brown and Haugene, Reference Brown and Haugene1998; Praetorius, Reference Praetorius2012; Akhtar and Utne, Reference Akhtar and Utne2014; Amrozowicz et al., Reference Amrozowicz, Brown and Golay1997; Pedersen, Reference Pedersen1995; Fowler and Sørgård, Reference Fowler and Sørgård2000; Kite-Powell et al., Reference Kite-Powell, Jin, Jebsen, Papakonstantinou and Patrikalakis1999). Most of them are based on experts' opinions. Moreover, their effects on the expected frequency of GAs have rarely been examined (Mazaheri et al., Reference Mazaheri, Montewka and Kujala2013). In theory, it is possible to list hundreds of factors that may affect the frequency of GA (Jebsen and Papakonstantinou, Reference Jebsen and Papakonstantinou1997), (Figure 1); nevertheless, if any model assessing the grounding frequency is supposed to be used for decision making purposes, the relationship of these factors with GA should be analysed more accurately.
Theoretical factors that can affect the expected frequency of ship grounding accident.

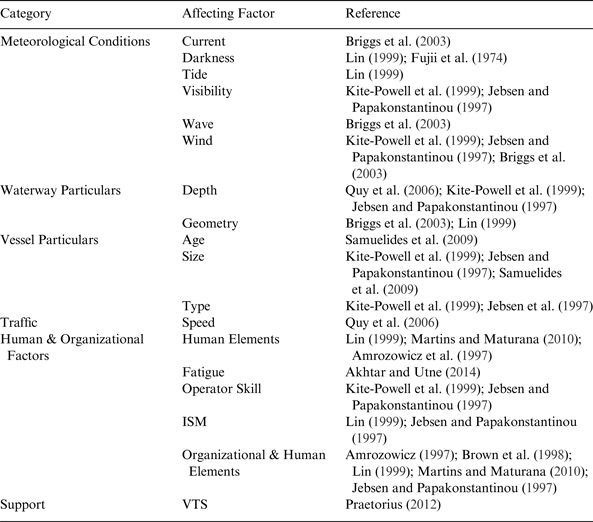
In Table 1 we list all the factors which are believed to affect GAs, which have been studied in the literature so far. However, the effect of ship traffic on GAs, has not been given attention yet, despite its presence in almost all of the existing grounding risk models, see Mazaheri et al. (Reference Mazaheri, Montewka and Kujala2013); Fowler and Sørgård (Reference Fowler and Sørgård2000); Otto et al. (Reference Otto, Pedersen, Samuelides and Sames2002) and Montewka et al. (Reference Montewka, Krata, Goerlandt, Mazaheri and Kujala2011). This situation is mostly accepted as common sense by experts; e.g. Pedersen (Reference Pedersen1995) or simply as a result of generalisation from ship-ship collision assumptions; e.g. Fujii et al., (Reference Fujii, Oshima, Yamanouchi and Mizuki1974). One of the reasons behind the belief of the dependency of ship traffic and GA is that people assume when traffic is denser, the likelihood that the ships have to alter their courses to avoid collision and eventually ending up grounded is higher (Jebsen and Papakonstantinou, Reference Jebsen and Papakonstantinou1997). A contrary belief though exists as the less dense traffic areas may be the more frequent grounding areas, since pilots and navigators may be less experienced in navigating in those areas and thus more likely to end up grounded. However, there is no study available for supporting or rejecting either of these beliefs. Moreover, it is possible that researchers are convinced that navigating a ship is more difficult when traffic is denser; however the question is whether difficulty due to traffic necessarily increases the likelihood of GA.
Studied factors in the literature that affect the expected frequency of ship grounding accident.
One problem that may rise when beliefs without solid foundation become commonly accepted is that the models developed for analysing the phenomenon and assessing the frequency of the accident may not represent the reality, (Goerlandt and Kujala, Reference Goerlandt and Kujala2014; Sormunen et al., Reference Sormunen, Goerlandt, Häkkinen, Posti, Hänninen, Montewka, Stahlberg and Kujala2014; Goerlandt et al., Reference Goerlandt, Montewka and Kujala2014; Hänninen et al., Reference Hänninen, Valdez Banda and Kujala2014a). Moreover if the model is used for risk management and decision making it might result in ineffective or even wrong risk control options (see for example Montewka et al., Reference Montewka, Goerlandt and Kujala2014, Reference Montewka, Ehlers, Goerlandt, Hinz, Tabri and Kujala2014a; Hänninen et al., Reference Hänninen, Mazaheri, Kujala, Montewka, Laaksonen, Salmiovirta and Klang2014).
Therefore, the aim of this article is twofold: firstly we study the statistical dependency between ship traffic and the frequency of GA; secondly we assess the relation between the waterway complexity and the frequency of GA.
For this purpose, GAs are subdivided into numbers and frequency of accident. Frequency of GA is used here as the number of groundings over the number of ship transits. Subdividing ship traffic into density and distribution, we test whether there is any statistical dependency between the number of GAs and density and distribution of ship traffic. Subsequently, we discuss the strength and weakness of the possible dependency. The dependency between the complexity of the waterways and the frequency of GAs is investigated in the same way.
The list given in Table 1 shows that waterway complexity, as the difficulty of a waterway in which to safely navigate a ship, has not yet been studied with regard to GA. Contrary to ship traffic, waterway complexity has not been used in any available risk models for GA so far, despite the commonly accepted belief that GA is a location-dependent accident. However, since waterway complexity is inherent in the design and geographical location of a waterway, it can be seen as a valid factor for assessing the frequency of GA; thus it is worth further analysis.
In this paper, we focus on the Gulf of Finland (GoF), due to its complex-to-navigate archipelagos and intense shipping volume. Besides, the area is one of the shallowest bodies of water in the world (Kuronen et al., Reference Kuronen, Helminen, Lehikoinen and Tapaninen2008), which has resulted in grounding being the most frequent accident type in the area (Kujala et al., Reference Kujala, Hänninen, Arola and Ylitalo2009).
The remainder of this paper is organised as follows: the data used for the analysis is presented in Section 2. The applied methodology and the implemented algorithms for data analysis are provided in Section 3; results of the data analysis are given in Section 4; followed by the discussion of the results and their limitations in Section 5. Finally, the paper is concluded in Section 6.
2. ACCIDENT AND TRAFFIC DATA
Two different sources of data are used in this study. First is Helsinki Commission (HELCOM) statistics regarding ship accidents that occurred in the Baltic Sea between the years 1989 and 2010; second is HELCOM Automatic Identification System (AIS) data of marine traffic in GoF for the year 2010.
2.1. HELCOM statistics
The accident data consist of inputs such as the date and time, geographical coordinates, and type of accident. From among all the available fields, the only input values that have been utilised in this research are the type and the location of the accident.
The dataset was first filtered regarding the type of the accident, and all the accidents that were recorded as “grounding” were chosen. Secondly, the dataset was filtered to limit the data to those accidents that have happened in the GoF, limiting the study area to 21·63o E and 30·31o E longitude, and to 58·90o N and 60·89o N latitude. Consequently, 123 records of GAs which occurred in this area between the years 1989–2010 were detected (Figure 2). The dataset was then filtered to remove those accidents that have erroneously reported as not having occurred near shoals or shallow water areas in the GoF or deep inland areas. As the result, 112 cases were retained and are used in Section 4 for the statistical analysis. The characteristics of the retained cases are shown in Figure 3. It can be seen from Figure 3 that 49 accidents have occurred in winter (January till April) and 63 cases in summer. This will be used later in Section 4.3 for seasonal analysis of the data.
Grounding accidents happening in the GoF (1989–2010) shown in red dots. Green areas show Traffic Separation Schemes.
Characteristics of 112 groundings accidents in GoF between years 1989 and 2010 based on HELCOM statistics.
2.2. HELCOM AIS-database
To extract the properties of marine traffic in the GoF, we utilise AIS data, recorded on average every third minute. The input values of the AIS records, utilised here, are timestamps and geographical locations of the ships. Before using, the AIS data needs to be cleaned, filtered, and sorted. For that, some thresholds are defined for the fields of an AIS record, and the AIS records are filtered based on the defined thresholds. For instance for the speed, the lower boundary of 2 knots (kt) is set in order to remove the stationary vessels, and upper boundary of 50 kt is set since no vessel can travel faster than 50 kt (van Dorp and Merrick, Reference van Dorp and Merrick2009). Thereafter, the AIS records of a single vessel are sorted into separate journeys if a time difference of more than 30 minutes is detected between two sequential AIS records of a single vessel (Goerlandt and Kujala, Reference Goerlandt and Kujala2011). Afterwards, another threshold is defined as the maximum distance allowed between two sequential transmitted AIS records from a single vessel, given the maximum speed that a vessel can travel. This was to remove the recording errors or location sensing errors that may appear during the data collection and transmission process. Thus, given the instant speed of the vessel and the time of the AIS records, any AIS record that has been transmitted within a larger distance of the defined threshold from either of its previous or following AIS records was detected as faulty and thus removed from the records (van Dorp and Merrick, Reference van Dorp and Merrick2009). The filtered AIS data is then used in Section 4 for the statistical analysis.
3. METHODOLOGY
The methodology has three phases: 1. Defining algorithms to extract the characteristics of ship traffic from the AIS data; 2. Quantifying the difficulty of navigating a ship in a waterway (i.e. waterway complexity); and 3. Implementing statistical analysis.
3.1. Traffic Characteristics
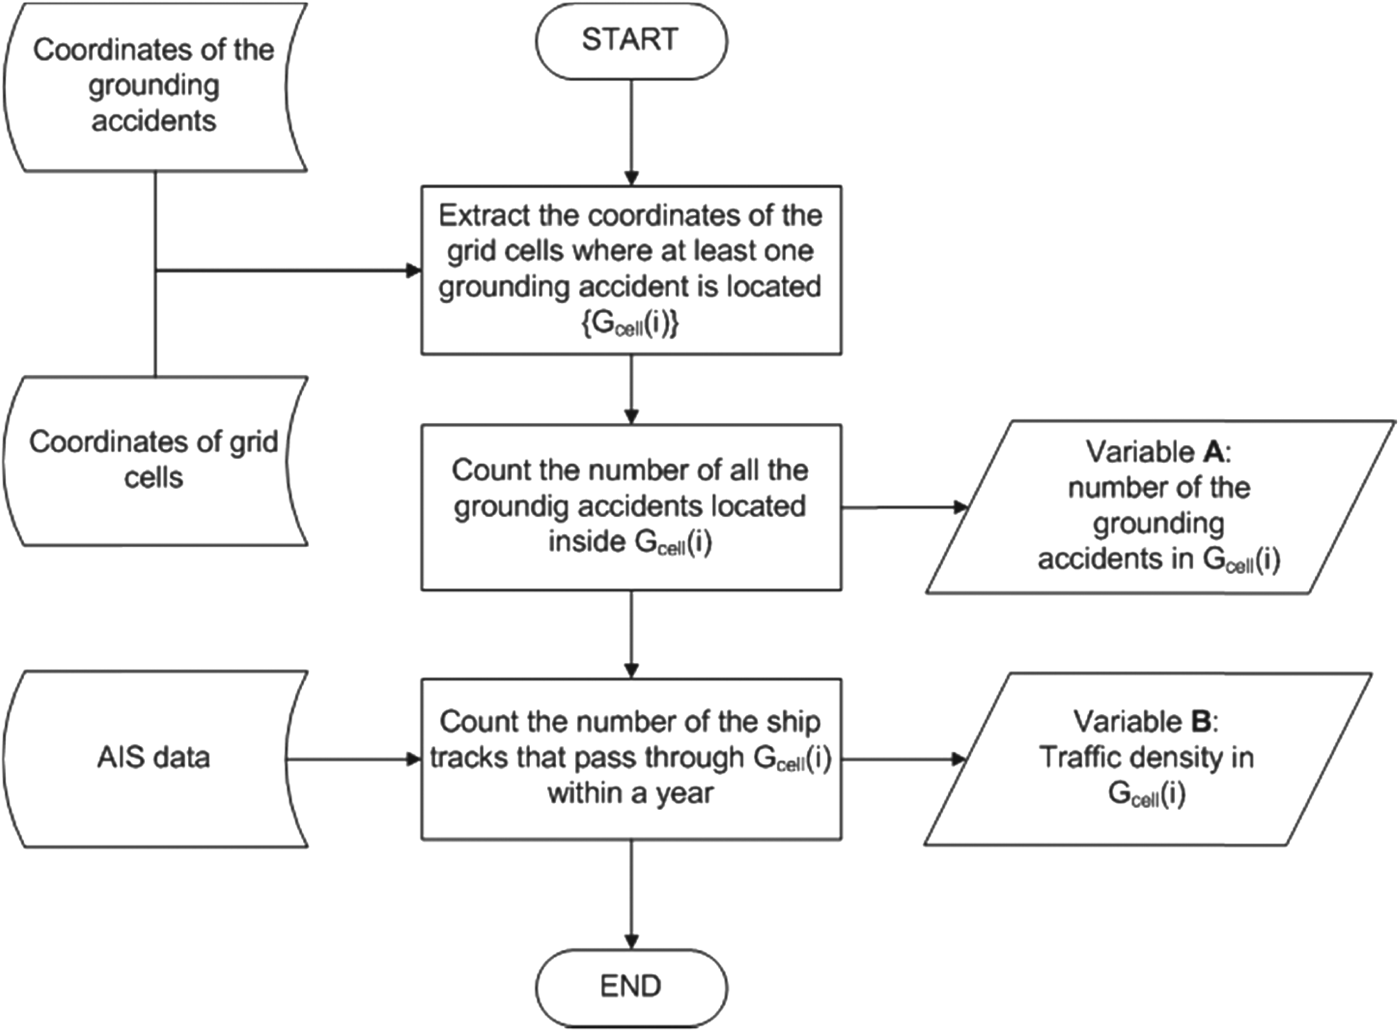
In the existing literature on grounding risk modelling, ship traffic is defined in two ways as density and distribution. Traffic density is defined as the number of ships per unit area within a time window (Mazaheri and Ylitalo, Reference Mazaheri and Ylitalo2010). As we are dealing with large enough samples of the AIS data from year 2010, the time window for this study is defined as a year. The algorithm to estimate the traffic density based on the above definition is shown in Figure 4. In general, the GoF is divided into grid cells of size one by one nautical mile. Thereafter, the number of ship tracks over a year that passed through the cells with at least one GA is counted as traffic density. Although the records of the ships that are in stationary positions are removed from the AIS database beforehand, the speed of the traffic is taken into account by the way that traffic density is extracted. The number of GAs located inside each grid cell is also counted into another variable. These variables are used in Section 4.1 to find the statistical dependency between traffic density and number of GAs.
Algorithm to extract traffic density from AIS data.
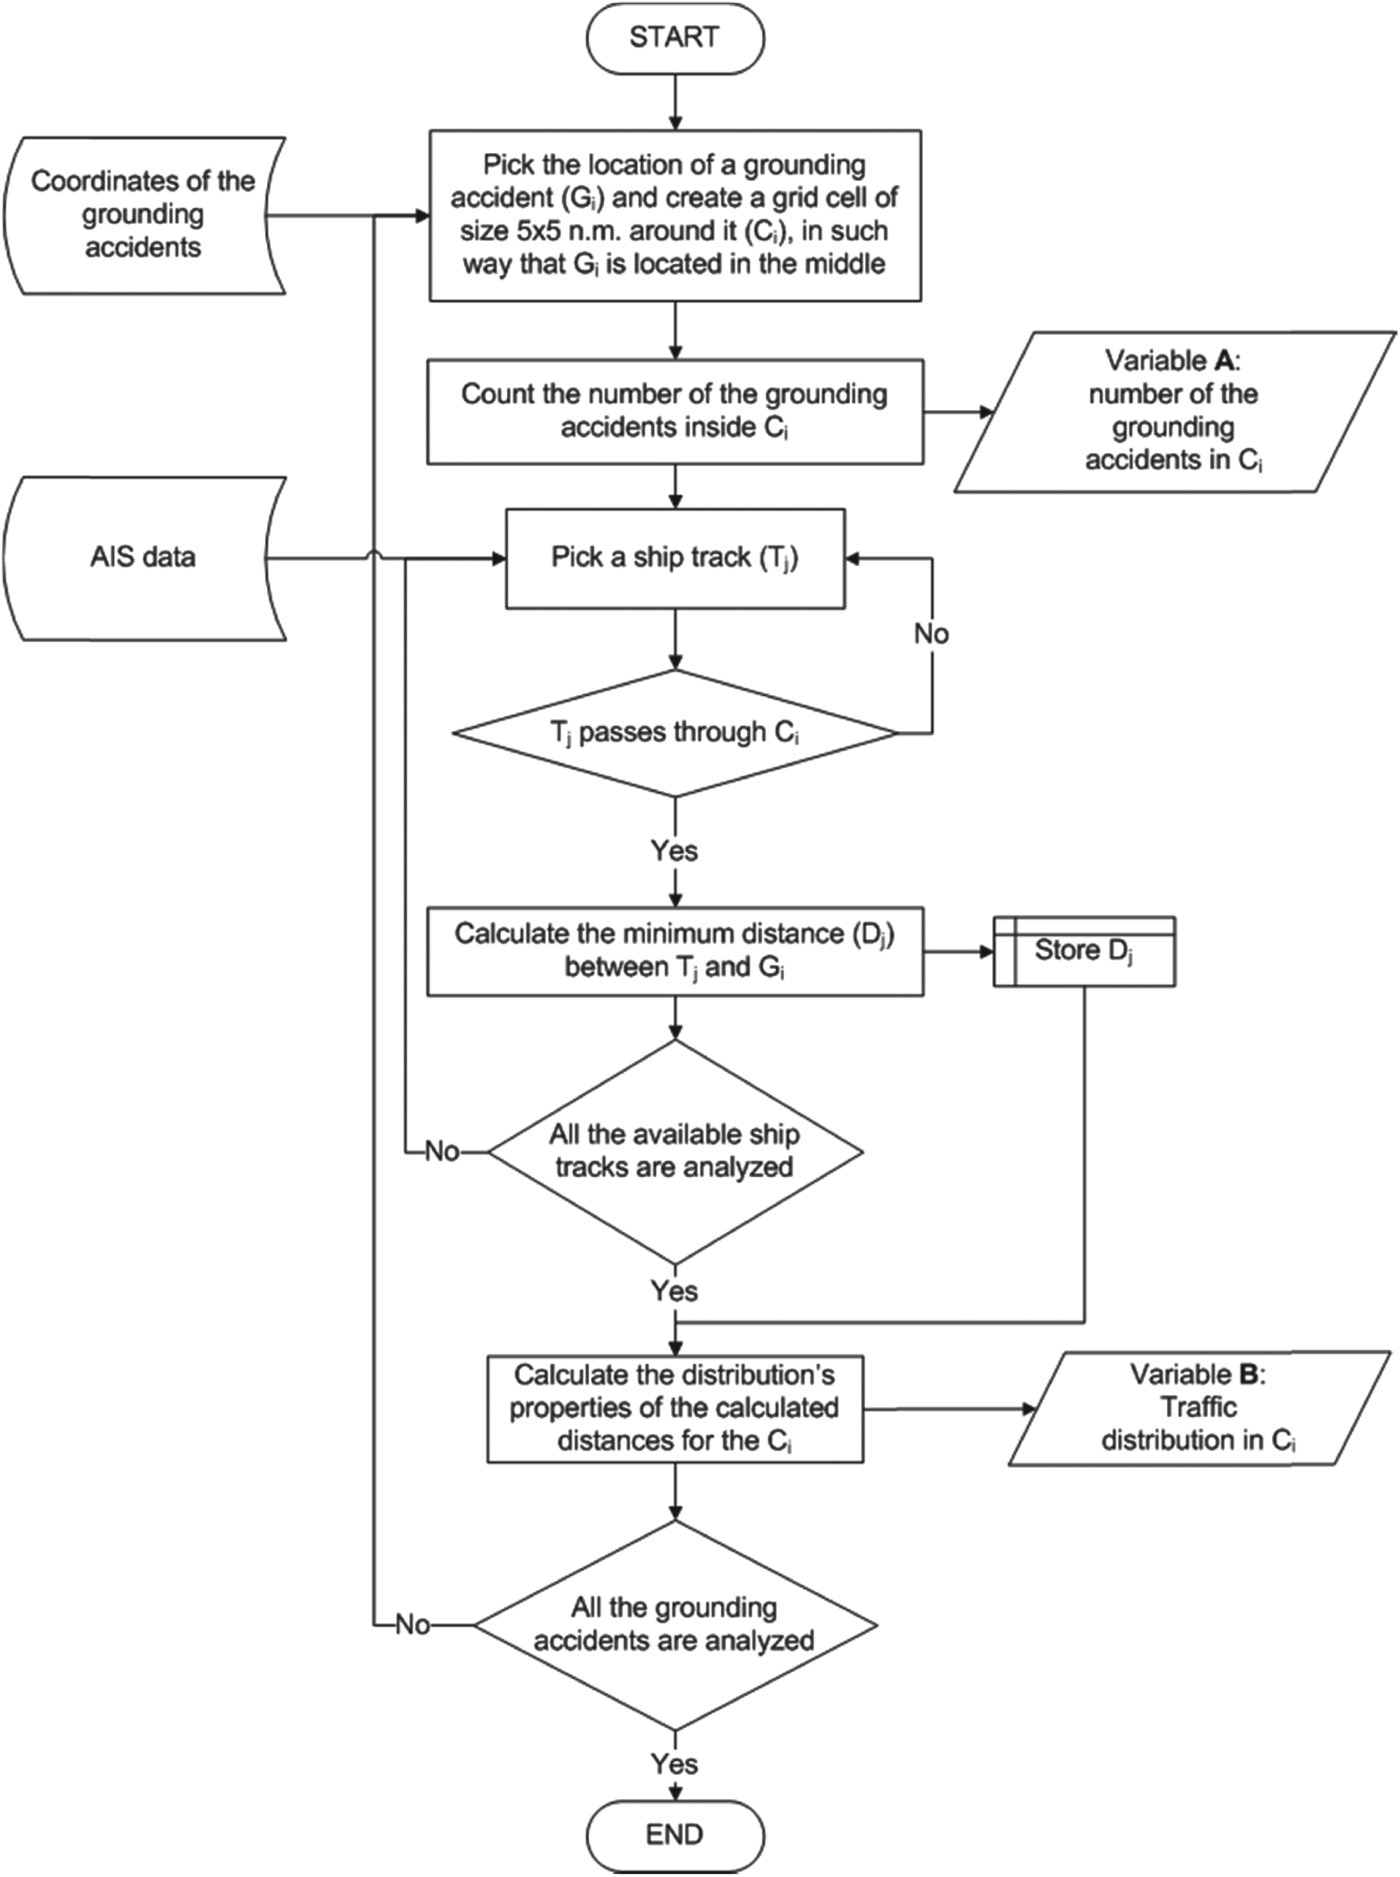
Traffic distribution is defined as the lateral distribution of ship tracks over a waterway. To extract the traffic distributions over a waterway with respect to the location of GAs, we have extracted the distribution of the minimum distances of ship tracks from GAs in the GoF (Figures 5 and 6). Thus, grid cells of size five by five nautical miles are created around the location of each GA in such a way that the location of the GA is located exactly in the middle of the grid. Then for each cell, the minimum distances of the ship tracks from the GA's location are estimated and taken as traffic distribution (see Figure 7). The number of GAs located inside each grid cell is also counted into another variable. These variables are used in Section 4.1 to find the statistical dependency between traffic distribution and number of GAs based on the first and second moments of the obtained distributions.
Minimum distance between a ship and location of a grounding accident.
Algorithm to extract traffic distribution from AIS data.
Extracted distributions of minimum distances between ship tracks and four grounding locations marked in Figure 2 with yellow stars.
To find the effect of the grid sizes used on the results, an additional grid size of three by three nautical miles is used to repeat the studies of traffic density and distribution. Besides, to find the effect of winter season, the study on traffic distribution is repeated by separating the winter and summer traffics. In Sections 4.2 and 4.3 the results of these additional studies are presented respectively and discussed by comparing with the main analyses.
3.2. Waterway Complexity
Waterway complexity is defined as the level of difficulty in handling a ship safely through a waterway. For analysing the statistical dependency between GAs and waterway complexity, a location-dependent, semi-quantitative index, called a Waterway Complexity Index (WCI), is defined. WCI ranks fairways with regard to the difficulty of ship handling. Currently, there is no study available in the literature that shows the parameters that may affect the complexity of a waterway. Thus, WCI is here quantified based on the experience of the local pilots. Since navigating in a fairway is related to human activity, and qualitative methods are often successfully used for such studies (Robson, Reference Robson2008) semi-structured interviews as a qualitative method is used here to acquire knowledge of the local pilots.
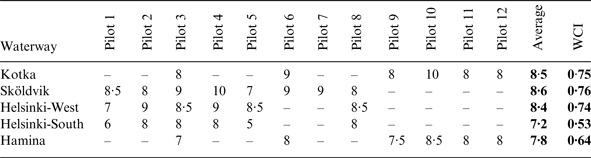
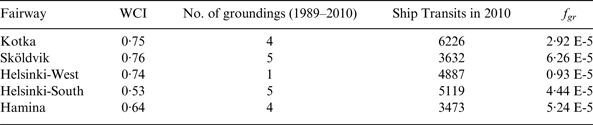
WCI for this study is defined for five waterways (harbour entrance fairways) in the GoF, leading to the following harbours: Helsinki (West and South harbours), Sköldvik, Kotka, and Hamina (see Table 2 and Figure 2). The chosen fairways differ in their geometry and bottom topography. They are also intended to be used for various ship types and sizes. From the operational point of view, these fairways fall within two pilot stations as Helsinki – ships are piloted to Helsinki and Sköldvig – and Kotka – ships are piloted to Kotka, Hamina and Sköldvig. This overlapping in operation is good for the comparability of the gathered results for the studied fairways.
Waterway complexity graded from 4 (the most difficult) to 10 (the easiest) by the interviewed pilots. WCI is scaled based on the Average values and from 0 (the most difficult) to 1 (the easiest).
The focus of the study was mainly on fairway dimensions and geometry. The chosen perspective is based on ship navigators' experience. The experience varies between individuals and in regard to how frequently the fairway is used in general. The aim of the interviews was to make a numerical WCI for typical ships navigating in the studied fairways. Twelve experienced maritime pilots were chosen for the interviews. Their pilot experience varied from seven to 25 years. Each maritime pilot has a set of fairways where he operates with various types of ships, and thus he was interviewed only based on those fairways (Table 2).
The interviews followed a six point routine:
1. Describing for the interviewee what is to be studied and why.
2. Discussing fairway quality in general. This includes the complexity in navigation regarding the turns, width of the fairway, and water depth.
3. Asking about quality-based observations of the interviewee about the fairways where he serves as a pilot. This includes the difficulties that the interviewee has met in the fairways.
4. Interviewee is asked to compare the fairways to rank them according to their difficulty of navigating.
5. Interviewee is asked to give a holistic grade of the difficulty of navigation in the waterway for typical ships navigating there today.
a. The grading was based firstly on the comparison to the other fairways where the interviewee is piloting, and secondly to the severity of the difficulties that are met in the fairway (see Table 2).
b. The scale of the grading was from 4 to 10, as this scale has been widely used earlier at schools in Finland, and Finnish pilots feel comfortable in using it.
c. Grade 4 should be given to a fairway which a pilot considers as being extremely difficult for navigation, and grade 10 to an ideal fairway.
6. Step 5 is repeated to cover all the studied fairways where the interviewee is piloting.
To formulate WCI the results of the grading were expressed on a scale between 0 (the most difficult) and 1 (the easiest), see Table 2. For this purpose, linear opinion pooling was used with equal weights for all the pilots. This method of combining multiple expert opinions into one is known for its simplicity and robustness (O'Hagan et al., Reference O'hagan, Buck, Daneshkhah, Eiser, Garthwaite, Jenkinson, Oakley and Rakow2006). The results gained during the interview process revealed that the pilots considered the following factors, related to a ship and a waterway, as important when assessing the complexity of a waterway:
• Ship draught and size in relation to the available space.
• The need for reduction of ship speed under certain circumstances, e.g. in the presence of two-way traffic.
• Width of the waterway, especially when two-way traffic is allowed.
• Number of turns and the magnitude of course alteration.
• The width of the waterway immediately following the turn.
• Fairway marking, especially in the areas which require increased attention of a pilot, e.g. due to significant course alteration.
Some of the factors related to ship and waterway geometry have been identified in the literature, as listed in Table 1. However to determine the complexity of a waterway, the joint effect of the factors needs to be recognised and the specific circumstances triggering such joint effect needs to be defined. Local experts, as shown in this study, can effectively do the latter.
3.3. Statistical Analysis
The existence of possible statistical dependency between ship traffic and GAs as well as WCI and GAs is studied with Pearson (r) correlation coefficient and Spearman (ρ) and Kendall (τ) rank correlation coefficients. The reliability of the resulting coefficients then tested with χ 2 – goodness-of-fit test assuming the null hypothesis (H 0) as “zero-correlation” against the alternative hypothesis (H 1) of “non-zero correlation” using significance level of 95%.
Although the correlation coefficients used can somehow reveal the possible statistical dependencies between the two variables, one should be aware about their limitations. For instance, the Pearson coefficient is defined assuming the data are normally distributed, or the Spearman coefficient is recommended when both variables are ordinal variables, or one is ordinal and the other is a continuous variable (Lehman, Reference Lehman2005). Therefore, since these assumptions are not perfectly matched with the limitation of our variables, a Mutual Information (MI) test is also utilised in this study for comparison, whenever it is plausible and informative (Steuer et al., Reference Steuer, Kurths, Daub, Weise and Selbig2002, Peng et al., Reference Peng, Long and Ding2005). MI shows how much knowing about one of the variables can decrease the uncertainty of the other variable. Thus, by using the MI test, the uncertainty coefficient (U) is calculated here that determines how large a proportion of the uncertainty about the number and frequency of GAs can be decreased by observing the other variables (Theil, Reference Theil1970).
4. RESULTS
4.1. Grounding vs. Traffic
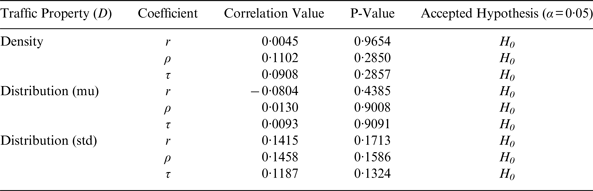
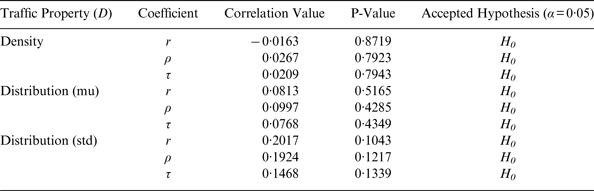
The results show that there is no statistically significant dependency between the two variables of traffic and number of GAs. Table 3 shows the correlation coefficients between the number of GAs and the traffic density with the grid cells of size 1×1 nm and the traffic distribution with the grid cells size of 5×5 nm. As is seen, the null hypothesis (i.e. zero-correlation) cannot be rejected for traffic density and distribution at 95% significance level.
Correlations between number of groundings and traffic, with grid sizes 1×1 nm for traffic density and 5×5 nm for traffic distribution. H0 is Zero-correlation.
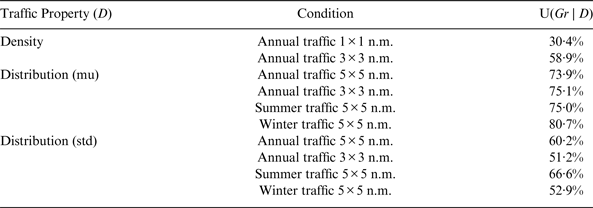
Nevertheless, the MI test on the same data shows that even though knowing about traffic density will not considerably increase our knowledge about the number of GAs, information about the distribution of traffic can significantly increase our knowledge in this regard (Table 6). Therefore, the distribution of the traffic is more informative than the traffic density to assess the expected frequency of GAs.
4.1.1. Effect of Different Grid Sizes
The extracted traffic density and traffic distribution were based on grid sizes of 1×1 nm and 5×5 nm respectively. For finding whether the size of grids can affect the results, the properties of ship traffic were extracted again from the same database and were analysed the same way, but using the grid size of 3×3 nm for both traffic density and distribution.
As is seen in Table 4, similar results for correlation coefficients are obtained using different grid sizes. However, the results of MI test show noticeable changes. Table 6 shows that U for traffic density is increased while for traffic distribution it either remained the same or decreased. Recalling that the size of the grids for traffic density and traffic distribution was increased for the former and decreased for the latter, this shows that the size of the grid has direct relation with the amount of information that can be retrieved from the data. Thus, the critical matter in such studies is to define the optimum size or even shape for a grid in order to deliver meaningful information.
Correlations between number of groundings and traffic, with grid size 3×3 n.m. H0 is Zero-correlation.
4.1.2. Effect of Season
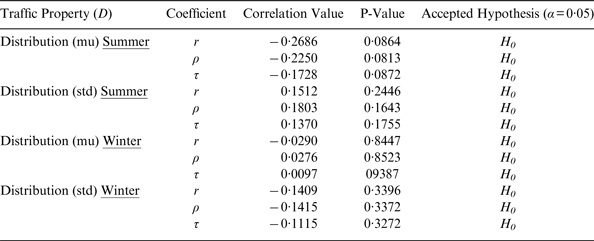
The GoF is often frozen in winter time, which affects the traffic pattern in the area for this period. Therefore, we run the study again only for traffic distribution and number of GAs by separating the summer and winter traffic, using grid size of 5×5 nm. The GoF was frozen in the first four months of the year 2010. Thus, for this study we assigned the data of ship traffic and GA of January till April to winter traffic and the rest to summer traffic.
The results for the correlation coefficients remain the same, showing no statistically significant dependency between the studied variables (Table 5). The uncertainty coefficient (U) for the first moment of the traffic distribution for summer traffic does not show remarkable changes either, while it is increased for winter traffic (Table 6). This may be explained as quite often the ships in winter move in convoy following an icebreaker, or navigate inside an ice channel that is opened by an icebreaker. Therefore, they normally pass a shoal at the same distance, resulting in the winter traffic being more informative regarding the expected value of minimum distance from a shoal. Table 6 also shows that U is increased for the second moment of the summer traffic while it is decreased for winter traffic. Knowing that the second moment of traffic distribution gives information about the traffic scattering, this may be explained as the ships in winter mostly choose not to sail where the ice situation is harsh, which is not constant and may change during a day. Thus, winter traffic is more scattered compared with summer traffic, which makes the data of winter traffic less informative about the scattering of the traffic.
Correlations between traffic distribution and number of groundings for summer and winter traffic in the GoF. H0 is Zero-correlation.
Uncertainty Coefficient (U) for ship traffic (D) and grounding (Gr).
4.2. Grounding vs. WCI
Using WCIs defined in Table 2 and the number of GAs occurring from 1989 till 2010 in the studied waterways (see Table 7), the correlation and rank coefficients show small positive rank and negative linear dependency between WCI and grounding frequency (ρ and τ=0·2 and r=−0·24; see Figure 8). Grounding frequency is defined in Equation (1) as the number of GAs over the ship transits for the studied waterways. Ship transits are estimated based on the AIS data of 2010 for each waterway. Thus, grounding frequency is estimated as:
 $$f_{gr} = N_{gr} /(22 \times N_{Transit} )$$
where f gr is grounding frequency, N gr is the number of GAs in the waterway over 22 years (1989 till 2010), and N Transit is the ship transit of the studied ports based on the AIS data of 2010.
Weak linear dependency of −0·24 is detected between WCI and Grounding Frequency; WCI scaled from 0 (the most difficult) to 1 (the easiest).
Grounding frequency of the studied waterways– WCI scaled from 0 (the most difficult) to 1 (the easiest).
Looking at Figure 8, one notices that data point of Sköldvik can be seen as an outlier since the waterway to Sköldvik is ranked as the easiest waterway to navigate among the studied waterways, while it has the highest frequency of GA (see Table 7). By omitting the data-point of Sköldvik from the dataset, the linear dependency between WCI and the grounding frequency is significantly increased to r=−0·71 (Figure 9), and rank coefficients are also now showing the similar dependency (negative) between the grounding frequency and WCI (ρ=−0·6 and τ=−0·34). Considering Sköldvig as an outlier can be justified by the fact that tankers, which are quite difficult to manoeuvre, especially when they are loaded, use this specific waterway. Separating the tanker traffic from the traffic of other ship types is often practised, see for example Montewka et al. (Reference Montewka, Hinz, Kujala and Matusiak2010).
Strong linear dependency of −0·71 is detected between WCI and Grounding Frequency when data point related to Sköldvik is removed from the dataset; WCI scaled from 0 (the most difficult) to 1 (the easiest).
Separating tanker traffic from the analysis, the obtained results reveal that the more complex a waterway is, the higher frequency of GA in that waterway. Nevertheless, due to the limited number of the studied waterways, the χ2 – and MI tests cannot be performed meaningfully to further confirm the obtained results.
5. DISCUSSION
The results of this study show that although there is no significant statistical correlation between the number of GAs and traffic density and distribution (Table 3), it cannot be said that ship traffic and GA are statistically independent. The MI test shows that although knowing about the traffic density may not significantly increase our knowledge about the expected frequency of GAs in an area, the information about the traffic distribution will do (Table 6). Thus, based on the results of this study and within its boundaries, it can be concluded that only spatial distribution of traffic in an area (not traffic volume) is a factor related to the frequency of GA. This finding can be supported by the recent accident report of HELCOM on the Baltic Sea area (HELCOM, 2011), showing that despite an increase in the traffic density of the area during recent years, the number of GAs has decreased.
The results also show statistical dependency between WCI and the frequency of GA, which means that the more complex a waterway is to navigate, the higher frequency of GA is expected to be seen in the area.
The implemented data, methods, and algorithms add uncertainty into the final results; therefore the limitations of the study are discussed below, along with our recommendations for further studies.
The data utilised for this study comes from statistics of the GoF and the results can only be considered valid for the studied area and for the utilised datasets. Therefore, the derived conclusions are only consistent with the resultant data and they should be later tested and verified using statistical data of different areas.
The AIS data utilised for this research represents maritime traffic of year 2010 in the area, while the historical accident data were from years 1989 till 2010. The recent traffic pattern does not necessarily represent the traffic pattern in the past. In fact, the ship traffic in the area has changed during the past decades, due to the opening of new ports in the area and the economic growth of the neighbouring nations (Kujala et al., Reference Kujala, Hänninen, Arola and Ylitalo2009). Besides, traffic separation schemes in GoF (see Figure 2) have applied since 2001 as part of the joint Vessel Traffic Management and Information System (VTMIS) in the GoF, which has affected the ship traffic in the area (Sonninen et al., Reference Sonninen, Nuutinen and Rosqvist2008). The same effect may have been caused by the implementation of Vessel Traffic Services (VTS) (MSC, 2003) and thereafter Gulf of Finland Reporting (GOFREP) (MSC, 2006) system in the area in 2003 and 2006 respectively. Therefore, the results of the study should be confirmed by performing similar studies and using traffic schemes of different years.
The frequency of GA was estimated assuming uniformity during 22 years and using the AIS data of the year 2010. This assumption brings uncertainty to the result. However, this uncertainty can be reduced if the AIS data of more years are used in order to estimate a better representative distribution of ship transits than uniform distribution.
The size of the data sample that is used for WCI study was small, which was due to the limited available resources. Since WCI can only be estimated via qualitative methods at this stage, the number of studied waterways was limited, which may have increased the uncertainty of the results. Therefore, defining quantitative methods for estimating WCI can help the researchers to increase the size of the studied waterways, which then may decrease the involved uncertainties. In this regard, the next step with WCI is to split up a fairway into pieces regarding its characteristics, such as number and quality of turns, length of the legs, and width of the fairway and then grading these fragments. This can lead us to a quantitative method to easily estimate WCI for every waterway only based on its characteristics.
The results show that although the size of the grids for extracting the traffic properties may not have significant effect on the correlation tests: it certainly has effects on the results of MI tests. This may indicate that the sizes and shape used for gridding are not optimum for such studies. Hence, some other ways of dividing the study area such as hybrid grid cell size, using smaller grid size in more dense areas and bigger one for the less dense areas, may perform better. Additionally, since the results of this study also confirm the statistical dependency between GA and WCI, dividing the study area based on the waterways may be more realistic for such studies. In this way, the waterway legs can serve as the “grids”, from where the traffic properties should be extracted. These are the methods that could be taken into account for future similar studies.
The results show that separating the traffic into winter and summer traffic affects the results of the MI tests on the first and second moments of traffic distribution. Given the result of the dependency between the traffic distribution and GA, it is concluded that the season is an affecting factor on GAs through the traffic distribution. Figure 3 also shows different trends for the number of GAs for the GoF between winter and summer seasons, which can be seen as a support for the above argument. Thus, we recommend future related studies separate the winter and summer traffic in the areas where the sea is covered with ice in winter.
6. CONCLUSION
The objective of this paper was to study the commonly accepted premise about the relationship between the characteristics of maritime traffic (density and distribution) and the frequency of Grounding Accidents (GA). This has been achieved by studying the statistical dependency between: 1. ship traffic and the frequency of GA; and 2. waterway complexity and the frequency of GA.
The study utilised AIS data to obtain traffic characteristics, accident statistics with respect to the grounding accidents in the Gulf of Finland, and experts' knowledge elicitation techniques to deliver an index describing the complexity of waterways. Applying correlation tests and Mutual Information (MI) analysis we carried out statistical analysis on the data.
The obtained results reveal that statistical dependency exists between the frequency of grounding accident and traffic distribution and between the former and the complexity of the waterway. Using these results we can conclude that traffic distribution and waterway complexity are affecting factors on the expected frequency of grounding accident, and are valid variables to be used when modelling the risk of grounding accidents.
It is also shown that there is no statistically significant dependency between the traffic density and grounding accidents. Therefore, the results of this study recommend not using traffic density as an input variable to models assessing the frequency of grounding accidents, especially for the studied area.
Since this outcome is a counter to the currently accepted beliefs, it highlights that it is important to conduct more statistical research on recognising the most significant affecting factors on the expected frequency of grounding accident when this type of accident is being modelled.
ACKNOWLEDGEMENTS
HELCOM is acknowledged for providing us with the AIS and accident data related to the study area. The authors are also grateful to the sea pilots, who willingly participated in the interviews, for their valuable inputs to this research.
FINANCIAL SUPPORT
This study was conducted as part of “Minimizing risks of maritime oil transport by holistic safety strategies” (MIMIC) project. The project was partly funded by the European Union and the financing comes from the European Regional Development Fund, The Central Baltic INTERREG IV A Programme 2007–2013; the City of Kotka; Kotka-Hamina Regional Development Company (Cursor Oy); Centre for Economic Development, and Transport and the Environment of Southwest Finland (VARELY).