INTRODUCTION
Least limiting water range (LLWR) is defined as the range in soil water content within which limitations to plant growth associated with water potential, aeration and mechanical resistance to root penetration are minimal (Da Silva & Kay Reference Da Silva and Kay1997). It is also the minimum range of volumetric soil water content in which the biological processes are least limited by soil water or oxygen availability (Drury et al. Reference Drury, Zhang and Kay2003). As a multi-factor index, LLWR integrates several physical properties into a single variable (Da Silva et al. Reference Da Silva, Kay and Perfect1994) and has been proposed as an indicator for evaluating soil physical quality under different management systems (Benjamin et al. Reference Benjamin, Nielsen and Vigil2003; Lapen et al. Reference Lapen, Topp, Gregorich and Curnoe2004; Leão et al. Reference Leão, Da Silva, Macedo, Imhoff and Euclides2006). It has proved to be a useful indicator for evaluating the adopted management on soil organic carbon (SOC) mineralization or sequestration (Yoo & Wander Reference Yoo and Wander2006; Chen et al. Reference Chen, Shi, Zhang, Liang, Jia, Fan and Wei2011; Medeiros et al. Reference Medeiros, Da Silva, Cerri, Giarola, Figueiredo and Fracetto2011).
The soil pore system serves as a pathway for transporting water, air and heat, and as a habitat for soil biota, thereby potentially controlling organic matter decomposition in soils (Thomsen et al. Reference Thomsen, Schjønning and Christensen2003; Blagodatsky & Smith Reference Blagodatsky and Smith2012). The relationship between total porosity or soil bulk density and biotic activity is not well understood (Sasal et al. Reference Sasal, Andriulo and Taboada2006), but information about the changes in soil pore-size distribution may provide additional insight on the carbon (C) decomposition processes and why C may accumulate in different pore classes (Sleutel et al. Reference Sleutel, Bouckaert, Buchan, Van Loo, Cornelis and Sanga2012). Numerous criteria have been used to define pore-size classes and their size class boundaries have often been arbitrarily defined (Kay & VandenBygaart Reference Kay and VandenBygaart2002). However, pores >100 μm are often classified as large macropores, and 30 μm is often taken as the boundary between small macropores and mesopores (Kay & VandenBygaart Reference Kay and VandenBygaart2002; Hayashi et al. Reference Hayashi, Ken'ichirou and Mizuyama2006). Yoo et al. (Reference Yoo, Nissen and Wander2006) suggested that an attempt to establish the critical value for soil physical factors controlling SOC mineralization should focus on the analysis of the small macropore range (which they defined as 15–150 μm) rather than soil bulk density or total porosity. In addition, the calculation of LLWR has usually relied on soil bulk density rather than porosity distribution data, so using soil pore size instead may improve the prediction accuracy of LLWR as an indicator of SOC mineralization. Thus, there is a desire for better understanding of soil structure controls over SOC mineralization imposed by soil pore characteristics.
The LLWR and soil pore-size distribution are both helpful to predict whether or not the adoption of no tillage (NT) practice can change C dynamics (Yoo et al. Reference Yoo, Nissen and Wander2006). Moreover, soil pore-size distribution may provide useful information about the relationship between soil structure and microbial activity (Sleutel et al. Reference Sleutel, Bouckaert, Buchan, Van Loo, Cornelis and Sanga2012). However, the relationship between LLWR, soil pore-size distribution and which pore size accounts for most of the LLWR, calculated based on soil bulk density changes, remain unexplored. The present study may be useful for deeper understanding of LLWR variation and its significance as an indicator of SOC mineralization. Consequently, based on the previous work (Chen et al. Reference Chen, Shi, Zhang, Liang, Jia, Fan and Wei2011, Reference Chen, Wang, Shi, Zhang, Liang, Jia, Fan and Wei2013), the present paper compares soil pore-size distribution under no-tillage and conventional tillage and investigates the relationship between LLWR, calculated on the basis of soil bulk density and soil pore-size distribution. The aim was to determine whether or not LLWR calculated from soil pore-size distribution could reflect more sensitively the variation of LLWR than soil bulk density and improve the prediction accuracy of LLWR as an indicator of SOC mineralization in Northeast China.
MATERIALS AND METHODS
Experimental site and treatments
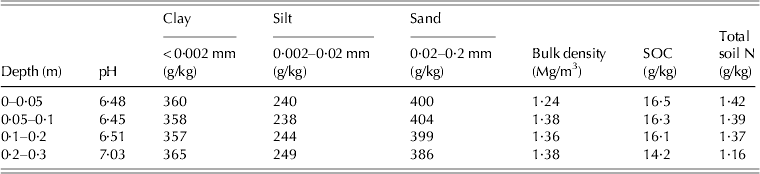
The study area was initiated in 2001 at the Black Soil Experiment and Demonstration Base (44°12′N, 125°33′E, 205 m a.s.l.) of Northeast Institute of Geography and Agroecology, Chinese Academy of Sciences, in Dehui County, Jilin Province, China. The type of soil in the present study was a clay loam soil (Typic Hapludoll). Soil pH in the 0–0·2 m layer was c. 6·5, classified as neutral or slightly acidic. The climate was a semi-humid temperate continental monsoon. The 30-year mean annual temperature was 4·4 °C and mean annual precipitation was 520 mm. More than 70% of the annual precipitation occurred in June, July and August. Before the establishment of the current tillage experiment, the land had been used to grow monoculture maize under conventional management for >10 years. Selected soil physical and chemical properties are provided (Table 1) and have been given previously by Liang et al. (Reference Liang, Zhang, Fang, Yang and Drury2007).
Selected soil physical and chemical properties at different depths in the study site prior to running the experiment (Liang et al. Reference Liang, Zhang, Fang, Yang and Drury2007)

The tillage treatments, consisting of NT and mouldboard ploughing (MP), were arranged in a randomized complete block design with four replicates. Plots were 10·4×20 m. Rotations included maize–soybean (M–S) with both crops present each year and continuous maize (M–M). The present study was based on plots just planting maize. No tillage had no soil disturbance except for planting using a KINZE-3000 NT planter (Kinze Manufacturing Inc., USA). Mouldboard ploughing included one autumn ploughing (c. 0·2 m deep) after harvest, one spring discing (0·075–0·1 m deep) and ridge-building before planting. Crop residues were left on the soil surface after harvest for the NT treatment. In a change from the standard practice, residue in the MP treatment was removed prior to ploughing in the autumn and manually replaced after ploughing in order to control erosion. This approach was the same as that used by farmers in Northeast China (Wang et al. Reference Wang, Chen, Zhao, Liu and Wang2009). The reason why this was done and what implication this had on interpretations of the data analysis were as follows: firstly, in Northeast China, especially Jilin Province, the agricultural machinery used (rotary cultivator) cannot plough the crop residue into deep soil, only to a depth of 0·1–0·15 m (Wang et al. Reference Wang, Chen, Zhao, Liu and Wang2009). Secondly, if agricultural machinery (rotary cultivator) was used to incorporate crop residue into the soil at the required depth for the present study (0·20 m), soil mixed with crop residue would lead to low germination rates in the second year in Northeast China (Zhao et al. Reference Zhao, Wang, Liu, Wang, Liu and Wang2006). For maize, 100 kg nitrogen (N)/ha, 45·5 kg phosphorus (P)/ha and 78 kg potassium (K)/ha were applied each year as starter fertilizer and an additional 50 kg N/ha was applied as top dressing at the six-leaf stage (V6, Simmons & Jones Reference Simmons and Jones1985). For soybean, all fertilizers were applied as starter fertilizer, including 40 kg N/ha, 60 kg P/ha and 80 kg K/ha.
Soil sample collection and analysis
In autumn 2009, after the maize harvest, composite soil samples (seven sub-samples per plot) were collected down to a depth of 0·3 m from each NT and MP plot using a manual soil probe with 0·026 m internal diameter (Jia et al. Reference Jia, Yang, Wang, Qiu and Ju1995). The core samples were then cut into four depth segments (0–0·05, 0·05–0·1, 0·1–0·2 and 0·2–0·3 m) and composited on a plot by depth-segment basis for NT and MP. Soil samples were then taken back to the laboratory, gently broken and air-dried to determine SOC and clay content. After manually removing visibly identifiable crop residues, soil was ground to pass through a 0·25 mm sieve. Total soil C was determined by FlashEA1112 Elemental Analyzer (Thermo Finnigan Inc, Italy). Since the soils were free of carbonates, SOC was assumed to equal the total soil C. Soil bulk density was measured using 0·05×0·05 m diameter soil cores from the following determination of soil pore-size distribution. Soil clay content (%) (International system) was determined by the pipette method (Soil Science Society of China 2000). Soil organic C mineralization was evaluated by the specific C mineralization rate (RESPsp) described by Franzluebbers et al. (Reference Franzluebbers, Hons and Zuberer1995) and further refined by Yoo & Wander (Reference Yoo and Wander2006).
Least limiting water range calculation
The LLWR was computed where soil biological activities were least limited by soil water availability or soil compaction (Yoo & Wander Reference Yoo and Wander2006). It was calculated on the basis of critical soil volumetric water content (θ) for plant growth defined by water potential, soil resistance and air-filled porosity (Da Silva & Kay Reference Da Silva and Kay1997) as follows: the soil moisture at field capacity (θ fc) (Ψ=0·01 MPa) (Haise et al. Reference Haise, Haas and Jensen1955), soil moisture at wilting point (θ wp) (Ψ=1·5 MPa) (Richards & Weaver Reference Richards and Weaver1943), soil moisture at which penetration resistance (θ sr) reached 2 MPa (Taylor et al. Reference Taylor, Roberson and Parker1966) and soil moisture corresponding to 10% of air-filled porosity (θ afp) (Grable & Siemer Reference Grable and Siemer1968).
Prior to LLWR computation, it was necessary to determine a soil water retention function and a soil resistance function. The function that was selected depended on the purpose of modelling soil water retention and soil resistance curves. To characterize the influence of soil properties and tillage (class variable) on the soil water retention and soil resistance curves, Da Silva & Kay (Reference Da Silva and Kay1997) developed the pedotransfer functions from the soil water retention function proposed by Ross et al. (Reference Ross, Williams and Bristow1991) and soil resistance function employed by Busscher (Reference Busscher1990).
The above two functions were as follows:
 $${\rm Ln}\theta = {\rm Ln}a + b{\rm Ln}\Psi $$
where Ln is the natural log, θ is the volumetric water content (m3/m3), Ψ is the matric potential (MPa), and a and b are constants (Ross et al. Reference Ross, Williams and Bristow1991).
 $${\rm LnSR} = {\rm Ln}c + d{\rm Ln}\theta + e{\rm Ln}D_{\rm b} $$
where SR is the soil resistance (MPa), θ is the volumetric water content (m3/m3), D b is soil bulk density (Mg/m3), and c, d and e are constants (Busscher Reference Busscher1990).
In order to assess the impact of soil properties and tillage (class variable) on the latent variables of a, b and c, d, e, multiple regression analysis (SAS Institute 1991) was carried out following Williams et al. (Reference Williams, Ross, Bristow, Van Genuchten, Leij and Lund1992) and Eqns (1) and (2) were expressed as the following equations, respectively.
 $${\rm Ln}\theta = a_0 + a_1 p_1 + a_2 p_2 + \ldots a_{\rm i} p_{\rm i} + (b_0 + b_1 p_1 + b_2 p_2 + \ldots b_{\rm i} p_{\rm i} ){\rm Ln}\Psi $$
where p i represents the soil properties (sand content, silt content, clay content, SOC, D b) and a i and b i are constants.
 $$\eqalign{{\rm LnSR} = & c_0 + c_1 p_1 + c_2 p_2 + \ldots c_{\rm i} p_{\rm i} \cr & + (d_0 + d_1 p_1 + d_2 p_2 + \ldots d_{\rm i} p_{\rm i} ) {\rm Ln}\theta \cr & + (e_0 + e_1 p_1 + e_2 p_2 + \ldots e_{\rm i} p_{\rm i} ){\rm Ln}D_{\rm b}} $$
where c i, d i and e i represent constants and p i are sand content, silt content, clay content, SOC.
Multiple regression analysis showed that soil water retention curve was related to clay content, SOC and D b (R 2=0·94), soil resistance curve was related to clay content and SOC (R 2=0·86) and tillage had no independent effect in either of the two functions (Da Silva & Kay Reference Da Silva and Kay1997). The latent variables (a, b, c, d and e) were also determined by multiple regression analysis (Da Silva & Kay Reference Da Silva and Kay1997):
 $$a = e^{ - 4 {\cdot} 15 + 0 {\cdot} 69{\rm LnCLAY} + 0 {\cdot} 40{\rm LnSOC} + 0 {\cdot} 27{\rm LnDb}} $$
 $$b = -0{\cdot}55 + 0{\cdot}11{\rm LnCLAY} + 0{\cdot}02{\rm LnSOC} + 0{\cdot}10{\rm Ln}D_{\rm b} $$
 $$c = -3{\cdot}67-0{\cdot}14{\rm CLAY} + 0{\cdot}77{\rm SOC}$$
 $$d = -0{\cdot}48-0{\cdot}12{\rm CLAY} + 0{\cdot}21{\rm SOC}$$
 $$e = 3{\cdot}85 + 0{\cdot}10{\rm CLAY}$$
Therefore, the pedotransfer functions used to predict the soil moisture release curve (Eqn (10)) and soil resistance curve (Eqn (11)) in the present study were as follows (Da Silva & Kay Reference Da Silva and Kay1997):
 $$\eqalign{ {\rm Ln}\theta = & -4{\cdot}15 + 0{\cdot}69{\rm LnCLAY} + 0{\cdot}40{\rm LnSOC} \cr & + 0{\cdot}27{\rm Ln}D_{\rm b}+ (-0{\cdot}55 + 0{\cdot}11{\rm LnCLAY} \cr & + 0{\cdot}02{\rm LnSOC} + 0{\cdot}10{\rm Ln}D_{\rm b} ){\rm Ln}\Psi} $$
 $$\eqalign{{\rm LnSR} = & -3{\cdot}67 - 0{\cdot}14{\rm CLAY} + 0{\cdot}77{\rm SOC} \cr & + (-0{\cdot}48-0{\cdot}12{\rm CLAY} + 0{\cdot}21{\rm SOC}) \cr & \times{\rm Ln}\theta + (3{\cdot}85 + 0{\cdot}10{\rm CLAY}){\rm Ln}D_{\rm b}} $$
where θ was the volumetric water content (m3/m3), CLAY was soil clay content (%) as a weighted average at 0–0·3 m, SOC was weighted average SOC (%) at 0–0·3 m depth, D b was weighted average soil bulk density (Mg/m3) at 0–0·3 m, Ψ was the matric potential (MPa), and SR was soil penetration resistance (MPa). Soil θ fc (Ψ=0·01 MPa) (Haise et al. Reference Haise, Haas and Jensen1955) and θ wp (Ψ=1·5 MPa) (Richards & Weaver Reference Richards and Weaver1943) were calculated from Eqn (10). Equation (11), which was used to compute the water content (θ sr) when SR=2 MPa, where soil resistance became limiting (Taylor et al. Reference Taylor, Roberson and Parker1966). Soil θ afp was calculated as total porosity −0·1 (Grable & Siemer Reference Grable and Siemer1968). Total porosity was calculated using the equation (total porosity=1–Db/PD), where PD was particle density assumed to be 2·65 Mg/m3 (Ilstedt et al. Reference Ilstedt, Nordgren and Malmer2000) and D b was also the soil bulk density of a weighted average at 0–0·3 m. Soil θ fc and θ afp were the upper values while soil θ wp and θ sr the lower values (Wu et al. Reference Wu, Feng, Letey, Ferguson, Mitchell, Mccullough-Sanden and Markegard2003). The LLWR was determined by subtracting the larger of the two lower values from the smaller of the two upper values (Wu et al. Reference Wu, Feng, Letey, Ferguson, Mitchell, Mccullough-Sanden and Markegard2003).
The LLWR value at each depth was determined by the same method using the above equations. The difference lay in the input value, which was not the weighted average value but the value of D b, CLAY and SOC at each depth (Chen et al. Reference Chen, Wang, Shi, Zhang, Liang, Jia, Fan and Wei2013).
Although the LLWR values in the previous studies were calculated based on the corresponding weighted average of each variable at all depths (Da Silva et al. Reference Da Silva, Kay and Perfect1994; Da Silva & Kay Reference Da Silva and Kay1997; Zou et al. Reference Zou, Sands, Buchan and Hudson2000; Wu et al. Reference Wu, Feng, Letey, Ferguson, Mitchell, Mccullough-Sanden and Markegard2003; Lapen et al. Reference Lapen, Topp, Gregorich and Curnoe2004; Leão et al. Reference Leão, Da Silva, Macedo, Imhoff and Euclides2006; Medeiros et al. Reference Medeiros, Da Silva, Cerri, Giarola, Figueiredo and Fracetto2011), the role of weighted average may conceal certain differences in different layers; therefore, determining LLWR at each depth perhaps would enable more information to be extracted from the same data. Chen et al. (Reference Chen, Wang, Shi, Zhang, Liang, Jia, Fan and Wei2013) found that the LLWR value at each depth indicated more clearly the differences of SOC sequestration in the soil surface (0–0·05 m) and soil sub-surface (0·05–0·3 m) than LLWR of weighted average, and was more suitable in evaluating the situation of SOC stratification. Consequently, data of LLWR which were calculated based on soil bulk density at each depth were used to determine the relationship between LLWR and soil pore-size distribution in the present study.
Soil pore-size distribution determination
To determine the soil pore-size distribution, two replications of four undisturbed soil samples from each NT and MP plot at the same previously mentioned sampling time were collected with 0·05 m diameter cylinders at the four (0–0·05, 0·05–0·1, 0·1–0·2 and 0·2–0·3 m) depths, thus making 32 samples per treatment. These soil samples were saturated and submitted at 1500 Pressure Plate (0–1500 kPa pressure potential range) (Soil Moisture Equipment Inc, USA). Soil pore-size distribution was determined by the relationship between pore size and capillary water retention (Bhattacharyya et al. Reference Bhattacharyya, Prakash, Kundu and Gupta2006). Equivalent pore diameter (EPD) of a given matric pressure was estimated according to the following equation:
 $${\rm EPD} = 300/{\rm h}$$
where EPD was the diameter of the smaller pores drained (μm) and h was the soil water pressure potential (kPa) (Bhattacharyya et al. Reference Bhattacharyya, Prakash, Kundu and Gupta2006).
Soil pore-size distribution was presented as pore volume occurring within a given size interval per unit soil (total) volume (Hayashi et al. Reference Hayashi, Ken'ichirou and Mizuyama2006). Although numerous criteria have been used previously to define pore-size classes and their size class boundaries were often arbitrarily defined (Kay & VandenBygaart Reference Kay and VandenBygaart2002), pores >100 μm were often classified as large macropores and 30 μm was often taken as the boundary between small macropores and mesopores, whereas pores of <0·2 μm were generally referred to as micropores (Kay Reference Kay1990; Kay & VandenBygaart Reference Kay and VandenBygaart2002; Hayashi et al. Reference Hayashi, Ken'ichirou and Mizuyama2006). In addition, VandenBygaart et al. (Reference VandenBygaart, Protz and Tomlin1999) used 100 and 30 μm to investigate tillage impacts on pore-size distribution. Hence, pore-size distribution in the present study was classified into four pore size classes, which were large and small macropores (>100 and 30–100 μm, respectively), and meso- (0·2–30 μm) and micropores (<0·2 μm), according to the criteria defined by Kay (Reference Kay1990) and VandenBygaart et al. (Reference VandenBygaart, Protz and Tomlin1999). The LLWR was also calculated using the pore volume of small macropores.
Statistical analysis
The SPSS.11.5 (SPSS Inc, USA) software was used for all of the statistical analysis. Treatment main effects on LLWR which was calculated based on soil bulk density and small macropores and soil pore-size distribution were tested using one-way analysis of variance (ANOVA). Since the main objectives of the present study were to compare the effects of tillage practices rather than crop rotations on soil pore-size distribution and LLWR, calculated based on soil bulk density and small macropores at the same soil depth, a two-way ANOVA was not used. Treatment means were compared using the least significant difference (LSD) at P<0·05. The relationships between soil pore-size distribution and LLWR were calculated based on soil bulk density, as well as LLWR (calculated based on soil bulk density and small macropores) and SOC mineralization were determined using Pearson linear correlation analysis.
RESULTS
Soil pore-size distribution under no-tillage and conventional tillage
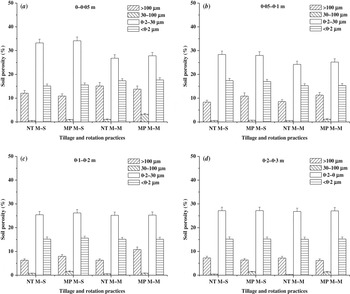
Soil pore-size distribution was mainly concentrated in the meso- (0·2–30 μm) and micropore range (<0·2 μm) under NT and MP treatments (Fig. 1). The NT treatment had a significantly (P<0·05) greater volume of large macropores (>100 μm) than MP soils at 0–0·05 (11·1 v. 14·3%) and 0·2–0·3 m (10·3 v. 16·1%) depths for M–S and M–M systems, respectively (Fig. 1). However, the 0·05–0·2 m layer had significantly (P<0·05) less volume of large macropores in NT than MP soils under both M–S and M–M rotations in the present study (Fig. 1). The volume of small macropores (30–100 μm) was significantly (P<0·05) less in NT than MP at each depth under both M–S and M–M treatments (Fig. 1). No significant differences in the volume of meso- and micropores were observed between NT and MP among crop rotations at any depth (Fig. 1). However, a significant (P<0·05) effect of crop rotation was observed on the volume of meso- and micropores in the top two soil depth intervals (0–0·05 and 0·05–0·1 m) under different tillage treatments (Fig. 1).
Soil pore-size distribution at different depths under tillage and rotation practices. M–S, maize–soybean rotation; M–M, continuous maize system; NT, no tillage treatment; MP, mouldboard ploughing treatment. The horizontal bars indicate s.e. (n=4).

Relationship between least limiting water range as determined by soil bulk density and soil pore-size distribution
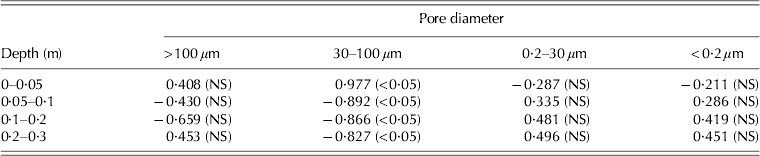
Differences were seen in the correlation between soil pore-size distribution and LLWR calculated based on soil bulk density (Table 2). The data showed a significant (P<0·05) correlation between LLWR calculated based on soil bulk density and the volume of small macropores (30–100 μm) at each depth (Table 2): it was positive (r=0·977) at 0–0·05 m but negative (r=−0·892, −0·866, −0·827, respectively) at 0·05–0·3 m (Table 2). No significant correlation was observed between LLWR calculated using soil bulk density and volume of large macropores (>100 μm) or meso- (0·2–30 μm) and micropores (<0·2 μm) in each layer (Table 2).
Pearson correlations between soil pore-size distribution and LLWR calculated based on soil bulk density (n=16) (Values outside and inside the brackets represent the Pearson correlation coefficients and significance for these coefficients, respectively.)

NS: not significant.
Comparison of least limiting water range calculated based on small macropores and soil bulk density
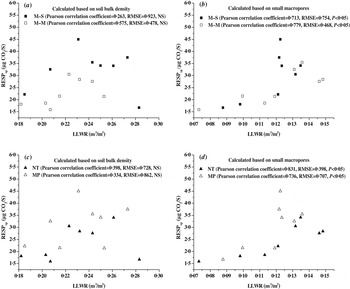
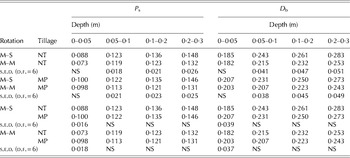
The LLWR calculated based on small macropores for NT and MP soils ranged from 0·073 to 0·148 m3 water/m3 soil, respectively, whereas those LLWR values based on soil bulk density ranged from 0·182 to 0·283 m3 water/m3 soil under NT and MP, respectively (Table 3). The differences between NT and MP among M–S and M–M systems in the LLWR (calculated based on soil bulk density), differed on average by 0·013 with an sd of 0·005, whereas the above differences differed on average by 0·006 with an sd of 0·002 in the LLWR that was calculated based on small macropores (Table 3). As seen from the LLWR calculated based on soil bulk density and small macropores, LLWR at 0–0·05 m depth was significantly (P<0·05) lower for NT than for MP, whereas LLWR in the 0·05–0·3 m layer in NT soil was consistently higher than in MP soil in two rotation systems (not significant) (Table 3). In terms of crop rotation, no significant differences were observed among crop rotations in the top 0–0·05 m depth, whereas M–S had significantly (P<0·05) greater LLWR than M–M in the 0·05–0·3 m depth (Table 3). In addition, LLWR calculated based on small macropores was on average 48·6% lower than that of soil bulk density at each depth (Table 3). Both LLWR which was calculated based on soil bulk density and that calculated using small macropores increased with depth under different tillage and rotation practices (Table 3). There were positive correlations between SOC mineralization and LLWR calculated based on soil bulk density (r=0·263, 0·575, 0·398 and 0·334 for M–S, M–M, NT and MP, respectively), as well as LLWR calculated based on small macropores under different tillage and rotation practices (Fig. 2). However, significant correlations (P<0·05) (r=0·713, 0·779, 0·831 and 0·736 for M–S, M–M, NT and MP, respectively) were only observed for the LLWR calculated based on small macropores (Fig. 2). Compared with LLWR which was calculated based on soil bulk density, Pearson correlation coefficients between the LLWR, which was calculated based on small macropores and SOC mineralization were greater under different tillage and crop rotation systems (Fig. 2).
Relationship between LLWR (calculated based on small macropores and soil bulk density) and RESPsp in the soil profile of 0–0·3 m under different tillage and rotation practices. LLWR: least limiting water range; RESPsp: specific C mineralization rate; M–S: maize–soybean rotation; M–M, continuous maize system; NT, no tillage treatment; MP, mouldboard ploughing treatment; NS, not significant.

Comparison of calculated LLWR value using small macropores (Ps) and soil bulk density (Db) (m3 water/m3 soil)

M–S, maize–soybean rotation; M–M, continuous maize system; NT, no tillage; MP, mouldboard ploughing.
s.e.d., standard error of difference; d.f., degrees of freedom; NS, not significant.
DISCUSSION
Soil pore-size distribution under no-tillage and conventional tillage
No tillage resulted in a change in the soil pore-size distribution compared with MP. The alteration in soil pore-size distribution could be attributed to the fact that the formation processes of soil structure such as differences in mechanical disturbances lead to pore characteristics differing among tillage systems (Benjamin Reference Benjamin1993). This was in accordance with results obtained by Fernández-Ugalde et al. (Reference Fernández-Ugalde, Virto, Bescansa, Imaz, Enrique and Karlen2009). No tillage generally resulted in less traffic, less soil disturbance and larger soil aggregates compared with the mouldboard tillage on fine-textured soil (Gregorich et al. Reference Gregorich, Reynolds, Culley, Mcgovern and Curnoe1993; Chen et al. Reference Chen, Cavers, Tessier, Monero and Lobb2005). The results from the present study, in which the pore volume was mainly distributed in the meso- and micropore range, has also been reported by Yoo et al. (Reference Yoo, Nissen and Wander2006) who found meso- and micropores account for most of soil pore-size distribution in silty clay loam and silt loam soils. In the present study, the greater volume of large macropores in NT in the 0–0·05 m layer was mainly due to less soil disturbance in NT soil after crop root death, forming larger pores (Wahl et al. Reference Wahl, Bens, Buczko, Hangen and Hüttl2004). The volume of large macropores in the 0·2–0·3 m layer was greater in NT than MP due to the emergence of a plough pan in the ploughed soils. Kay & VandenBygaart (Reference Kay and VandenBygaart2002) reported a greater proportion of pores >100 μm equivalent diameter under NT than conventional tillage. In the current experiment, the lower volume of large macropores at the 0·05–0·2 m depth in NT was probably due to less soil disturbance.
Compared with NT, the MP treatment had a significantly greater volume of small macropores at each depth under the two rotation systems. This could be due to the partial destruction of large macropores by soil disturbance, resulting in the formation of a greater volume of small macropores under MP. Kay & VandenBygaart (Reference Kay and VandenBygaart2002) reported in their review that converting from conventional tillage to NT generally resulted in a decreased volume fraction of pores 30–100 μm. Similar results reported by Wairiu & Lal (Reference Wairiu and Lal2006) indicate no significant difference in meso- and micropore categories at either depth under NT and MP. Therefore, the differences in pore-size distribution were more pronounced in small macropores and tillage had a profound impact on small macropores (30–100 μm).
Relationship between least limiting water range as determined by soil bulk density and soil pore-size distribution
In the correlation analysis of soil pore-size distribution to LLWR calculated by soil bulk density, only the relationship between LLWR and small macropores (30–100 μm) achieved a significant correlation. This result means that although small macropores represent a small portion of soil total porosity, they explain most of LLWR variation similar to the observations of Chen et al. (Reference Chen, Shi, Zhang, Liang, Jia, Fan and Wei2011, Reference Chen, Wang, Shi, Zhang, Liang, Jia, Fan and Wei2013). This finding leads to the conclusion that even with a slight change in small macropores, LLWR will also be affected.
Pore structure is a mechanism controlling the effects of fluctuations in soil moisture and thus the decomposition and sequestration of organic matter in soil (Yao et al. Reference Yao, Zhang and Hu2011). Effects of soil porosity and pore-size distribution on LLWR are mainly attributed to the impact of different degrees of soil disturbance on soil water content, aeration, and soil structure under different tillage practices (Buczko et al. Reference Buczko, Bens and Huttl2006). Ilstedt et al. (Reference Ilstedt, Nordgren and Malmer2000) reported soil moisture available to support microbial activity should be determined in the context of structure. Although Pengthamkeerati et al. (Reference Pengthamkeerati, Motavalli, Kremer and Anderson2005) reported that soil total porosity (or soil bulk density) affects soil microbial activity through soil structure changes, pore-size distribution determines where water resides in the pore system. The microflora and fauna depend on this water for motility and oxygen diffusion (Strong et al. Reference Strong, De Wever, Merckx and Recous2004). In addition, water location has an important influence on the biological activity in different pore classes (Strong et al. Reference Strong, De Wever, Merckx and Recous2004). Consequently, soil pore-size distribution could play a more important role than soil bulk density (or soil total porosity) in C decomposition processes. Stockdale & Brookes (Reference Stockdale and Brookes2006) and Lugato et al. (Reference Lugato, Morari, Nardi, Berti and Giardini2009) also reported that soil porosity distribution strongly affects SOC dynamics, with the volume of 0·1–5 μm pores promoting a faster SOC turnover while the pore class of 30–75 μm promotes its protection/stabilization against microorganisms and enzymes via spatial inaccessibility. Small macropores are responsible for ‘optimizing’ both gas and water ‘fluxes’ simultaneously in soil (Strudley et al. Reference Strudley, Green and Ascough2008). Hence, LLWR calculated using small macropores instead of soil bulk density can be more specific about evaluating impacts of tillage on soil C sequestration.
Comparison of least limiting water range calculated based on small macropores and soil bulk density
Least limiting water range values calculated based on small macropores and soil bulk density all fell within the range of 0·000–0·310 m3 water/m3 soil calculated by Da Silva & Kay (Reference Da Silva and Kay1997) for 64 different soils in Ontario, Canada. Although the variation trend of LLWR calculated based on small macropores was consistent with the LLWR calculated based on soil bulk density, the range of the former (102·9%) was greater than the latter (55·5%). The LLWR in the former calculation method was less than the latter, mainly because the value of small macropores was less than soil bulk density (or total porosity). Compared with LLWR, which was calculated based on soil bulk density, descriptive statistics results of greater Pearson correlation coefficients, smaller RMSEs and significant level in the correlation between LLWR which was calculated based on small macropores and SOC mineralization indicated an improved correlation. These results indicated that using small macropores instead of soil bulk density to calculate LLWR can reflect more sensitively the variation of LLWR.
The correlations between LLWR calculated based on soil bulk density or small macropores and SOC mineralization were improved more in NT than in MP soil. These results are related to lower soil disturbance, which preserves the soil structure (Alaoui et al. Reference Alaoui, Lipiec and Gerke2011) and increases physically protected SOC in NT soil (Lützow et al. Reference Lützow, Kögel-Knabner, Ekschmitt, Matzner, Guggenberger, Marschner and Flessa2006). However, in the conventional tillage system, soil preparation destroys the structure, reduces the connectivity of pores, and makes gas exchange in the soil profile difficult (Medeiros et al. Reference Medeiros, Da Silva, Cerri, Giarola, Figueiredo and Fracetto2011). Oorts et al. (Reference Oorts, Nicolardot, Merckx, Richard and Boizard2006) also reported that differences in soil structure created by tillage systems had large impacts on C mineralization. No tillage had significantly greater SOC content than MP treatment at the surface 0–0·05 m under the two rotation systems, owing to a lack of soil disturbance, which causes crop residues to remain on the soil surface as was also observed by Chen et al. (Reference Chen, Shi, Zhang, Liang, Jia, Fan and Wei2011). In addition, the residues on the soil surface decompose much more slowly than incorporated residues, due to reduced contact with soil organisms and less moisture conditions (Franzluebbers et al. Reference Franzluebbers, Schomberg and Endale2007). However, SOC content in the 0·05–0·3 m layer was less in NT than MP plots. This is explained by the following two reasons: first, it is difficult to obtain organic inputs below 0·05 m depth due to lack of soil disturbance in NT soil (Chen et al. Reference Chen, Shi, Zhang, Liang, Jia, Fan and Wei2011). Another reason is likely that MP promotes the inversion of soil layers and incorporation of crop residues, thus resulting in SOC accumulation more easily than the NT treatment (Chen et al. Reference Chen, Shi, Zhang, Liang, Jia, Fan and Wei2011). Negative effects of NT on SOC accumulation were also reported by Wander et al. (Reference Wander, Bidart and Aref1998) at 0·05–0·3 m of fine-textured soil. According to the values of LLWR calculated based on soil bulk density and small macropores, NT resulted in significantly lower LLWR in the surface (0–0·05 m) and higher LLWR in the subsurface (0·05–0·3 m) relative to MP soil. This was consistent with the C dynamics (surface (0–0·05 m) greater and sub-surface (0·05–0·3 m) less in NT than MP soils) of the field site (Chen et al. Reference Chen, Shi, Zhang, Liang, Jia, Fan and Wei2011). Due to the difference in the amount and characteristics of crop residue between the M–M and M–S system, M–M showed greater SOC at 0–0·05 m and significant SOC enrichment at 0·05–0·3 m than M–S system in NT and MP soils (Chen et al. Reference Chen, Wang, Shi, Zhang, Liang, Jia, Fan and Wei2013). In the field site used for the present study, soybean was shown to have fewer residues than maize in the same year and higher C mineralization was observed when soybean was in the rotation due to its lower C : N ratio (Chen et al. Reference Chen, Wang, Shi, Zhang, Liang, Jia, Fan and Wei2013). In addition, decomposition rates are regulated by other residue properties such as lignin, polyphenol, and silica content which suggests that soybean has suitable chemical characteristics for rapid C mineralization (Balota et al. Reference Balota, Filho, Andrade and Dick2004). From the view of crop rotation, the lower LLWR values calculated based on soil bulk density and small macropores and SOC mineralization were found in M–M than M–S systems at each depth. This was consistent with the results of greater SOC at 0–0·05 m and significantly greater SOC at 0·05–0·3 m in M–M than M–S systems (Chen et al. Reference Chen, Wang, Shi, Zhang, Liang, Jia, Fan and Wei2013). Both LLWR that was calculated based on soil bulk density and small macropores increased with depth under different tillage and rotation practices. This should be attributed to the decrease in SOC mineralization with depth, which is most likely due to (1) less heat and (2) greater distance for gas exchange with the atmosphere. Therefore, LLWR calculated based on soil bulk density and small macropores can both be used as an indicator of SOC mineralization. The LLWR from two kinds of calculation methods and SOC mineralization were all positively correlated which confirmed the results of Yoo et al. (Reference Yoo, Nissen and Wander2006) in silty clay loam and silt loam soil in America and Medeiros et al. (Reference Medeiros, Da Silva, Cerri, Giarola, Figueiredo and Fracetto2011) in a sub-tropical soil in Brazil. However, the correlation of LLWR calculated based on small macropores and SOC mineralization was improved over that of LLWR calculated based on soil bulk density and SOC mineralization. This suggested that using small macropores rather than soil bulk density to calculate LLWR can more accurately reflect the relationship between LLWR and SOC mineralization and improve the prediction accuracy of LLWR as an indicator of SOC mineralization.
Consequently, tillage practices through the effects of variation of small macropores on LLWR influenced SOC mineralization. In other words, soil structure limited water availability for biological activity and increased physical protection of SOC. Changes in soil structure were reflected in water content and gas diffusion, and therefore in biological activity (Yoo & Wander Reference Yoo and Wander2006). Compared with MP, NT had a smaller volume of small macropores due to less soil disturbance which led to the variation of LLWR and further benefits to SOC. This result should be attributed to the better soil structure and better pore connectivity, providing moisture, temperature and gas exchange conditions that are more suitable for biological activity in NT soil (Oorts et al. Reference Oorts, Nicolardot, Merckx, Richard and Boizard2006). Liu et al. (Reference Liu, Herbert, Hashemi, Zhang and Ding2006) also reported less tillage intensity can reduce C loss. LLWR was more sensitive to indicating SOC mineralization by using small macropores in the calculation of LLWR. Therefore, it is better to use soil small-macropore volume instead of soil bulk density when interested in using LLWR as an indicator of SOC mineralization.
This research was supported by the National Natural Science Foundations of China (grant numbers 41201217 and 31170483), the Key Knowledge Innovation Programme of Chinese Academy of Sciences (grant no. KZCX2-EW-QN307) and Foundation of Excellent Young Talents in Northeast Institute of Geography and Agroecology, Chinese Academy of Sciences (grant no. C08Y13).