

1. Introduction
Mesozoic and Cenozoic igneous rocks are widely distributed in the Lhasa Terrane, where they form the Gangdese magmatic arc (Coulon et al. Reference Coulon, Maluski, Bollinger and Wang1986; TBGMR, 1993; Yin & Harrison, Reference Yin and Harrison2000; Kapp et al. Reference Kapp, Harrison, Kapp, Grove, Lovera and Ding2005). The arc is generally divided into the northern, central and southern belts (Pan, Wang & Li, Reference Pan, Wang and Li2002; Pan et al. Reference Pan, Mo, Hou, Zhu, Wang, Li, Zhao, Geng and Liao2006; Lu, Zhang & Ren, Reference Lu, Zhang and Ren2004). The southern and central belts have traditionally been interpreted as the result of northward low-angle subduction of Neo-Tethyan oceanic lithosphere beneath the Lhasa Terrane (Coulon et al. Reference Coulon, Maluski, Bollinger and Wang1986; Hodges, Reference Hodges2000; Yin & Harrison, Reference Yin and Harrison2000). In contrast, the northern belt has been considered to reflect subduction of Palaeo-Tethyan oceanic lithosphere, now represented by the Bangong–Nujiang ophiolites, emplaced during collision between the Qiangtang and Lhasa terranes (Pan, Wang & Li, Reference Pan, Wang and Li2002; Pan et al. Reference Pan, Mo, Hou, Zhu, Wang, Li, Zhao, Geng and Liao2006).
The Rutog pluton in the westernmost part of the Lhasa Terrane belongs to the northern belt of the Gangdese arc. Our new geochronological data reveal that the intrusion is a Late Mesozoic body. Thus, study of this body can provide important clues to the origin of the Mesozoic igneous rocks in the Gangdese arc and their role in the tectonic evolution of the Tibetan Plateau.
In this paper, we present new SHRIMP zircon dates, whole-rock major and trace element data and Sr–Nd isotopic analyses for the Rutog pluton. This new dataset documents that the pluton was formed by partial melting of thickened continental crust. The melting was probably triggered by underplated basaltic magmas produced during northward subduction of Neo-Tethyan oceanic lithosphere.
2. Geological background
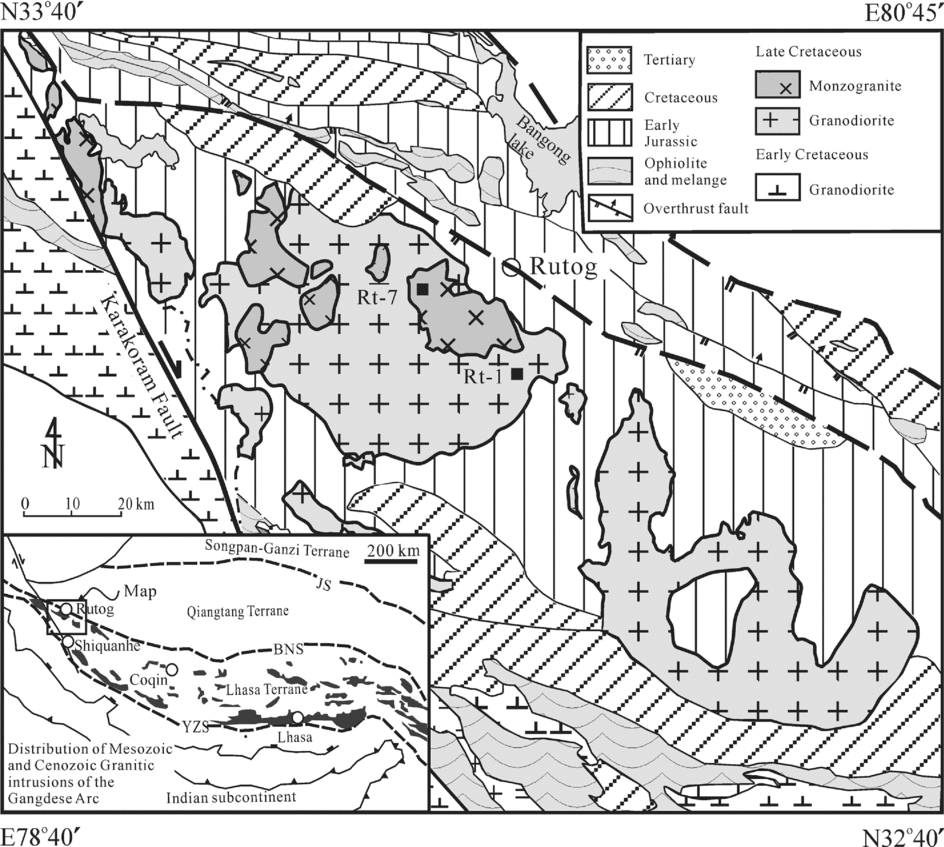
Tibet is an amalgamation of terranes accreted to the southern margin of Eurasia during the Phanerozoic (Chang & Zheng, Reference Chang and Zheng1973; Allègre et al. Reference Allègre1984). From north to south, it comprises the Qilian, Kunlun–Qaidam, Songpan–Ganzi, Qiangtang and Lhasa terranes, which are separated from one another by major suture zones marked by ophiolitic fragments and mélanges (Yin & Harrison, Reference Yin and Harrison2000). The Lhasa Terrane is separated from the Qiangtang Terrane to the north by the Bangong–Nujiang suture zone and from the Indian subcontinent to the south by the Yarlung–Zangbo suture zone (Fig. 1).
Simplified geological map of the Shiquanhe region, NW Tibet, showing the tectonic framework of the Tibetan Plateau (inset map) and the location of the Rutog pluton. JS – Jinshajiang suture; BNS – Bangong–Nujiang suture; YZS – Indus–Yarlung–Zangbo suture.

The Bangong–Nujiang suture zone, which extends for more than 1200 km across central Tibet, is marked by ophiolitic fragments and thick sequences of Jurassic flysch, mélange and volcanic rocks (Yin & Harrison, Reference Yin and Harrison2000). The Jurassic ophiolitic fragments along this belt are unconformably overlain by upper Jurassic–upper Cretaceous strata and were emplaced probably at c. 170 Ma (Zhou et al. Reference Zhou, Malpas, Robinson and Reynolds1997; Yin & Harrison, Reference Yin and Harrison2000). This ophiolitic belt is up to 100 km wide, probably reflecting the presence of intra-oceanic arc terranes (Pearce & Mei, Reference Pierce and Mei1988; Matte et al. Reference Matte, Tapponnier, Arnaud, Bourjot, Avouac, Vidaal, Liu, Pan and Wang1996).
The Yarlung–Zangbo suture zone contains several well-preserved fragments of Neo-Tethyan oceanic lithosphere that were emplaced in the Cretaceous (Allègre et al. Reference Allègre1984; Aitchison et al. Reference Aitchison, Badengzhu, Liu, Luo, Malpas, McDermid, Wu, Ziabrev and Zhou2000). Final continent–continent collision, leading to the present configuration, probably occurred in Eocene times (Molnar & Tapponnier, Reference Molnar and Tapponnier1975).
The Lhasa Terrane, 100 to 300 km wide, consists of a gneissic basement overlain by Palaeozoic to Cenozoic strata. Palaeozoic strata are represented by a sequence of Ordovician to Permian shallow marine sedimentary rocks (Yin & Harrison, Reference Yin and Harrison2000). Lower Cretaceous sedimentary rocks are locally overlain by early Tertiary volcanic sequences of the Linzizong Formation (Allègre et al. Reference Allègre1984; Murphy et al. Reference Murphy, Yin, Harrison, Dürr, Chen, Ryerson, Kidd, Wang and Zhou1997).
The Linzizong Formation, together with Cretaceous–Early Tertiary granitic batholiths, comprise the Gangdese arc in the Lhasa Terrane (Allègre et al. Reference Allègre1984; Coulon et al. Reference Coulon, Maluski, Bollinger and Wang1986; Kapp et al. Reference Kapp, Yin, Harrison and Ding2005). The volcanic rocks consist chiefly of calc-alkaline andesites and andesitic pyroclastic rocks, similar to those of the Andean continental-margin arc (Coulon et al. Reference Coulon, Maluski, Bollinger and Wang1986; Mo et al. Reference Mo, Zhao, Deng, Dong, Zhou, Guo, Zhang and Wang2003).
Granitoids are widespread in the Shiquanhe area in the western part of the Lhasa Terrane (Fig. 1) and consist mainly of diorite and granodiorite. A muscovite-bearing granitic pluton intrudes Permian strata east of Shiquanhe. Synkinematic muscovite from a south-directed shear zone yielded a K–Ar age of 83 ± 4 Ma, which is believed to date reactivation of the suture zone near Bangong Lake (Ratschbacher et al. Reference Ratschbacher, Frisch, Lui and Chen1994). Ophiolitic mélange in Rutog has been thrust southward over lower Tertiary red beds, suggesting local shortening during the India–Asia collision (TBGMR, 1993).
3. Petrography of the Rutog pluton
The Rutog pluton is about 25–30 km wide and 190 km long, and crops out over an area of more than 3315 km2 (TBGMR, 1993) (Fig. 1). It intrudes Lower–Middle Jurassic and Lower Cretaceous strata, and the contact is marked locally by dark hornfels (TBGMR, 1993). The intrusion is compositionally zoned, with an early, marginal phase of granodiorite and a later phase of biotite monzogranite. Abundant dioritic xenoliths and small pegmatitic dykes occur throughout the intrusion.
The granodiorites are coarse-grained and porphyritic in the central part to fine-grained and aphyric along the margins. They are mainly composed of quartz (±20 modal%), plagioclase (±50%), K-feldspar (< 10%) and biotite + hornblende (±15%). The plagioclase has well-developed oscillatory zoning, and some quartz grains contain needles of rutile.
The biotite monzogranite crops out mainly in the northern part of the intrusion (Fig. 1) and is hosted in the granodiorite. The monzogranite is coarse-grained and porphyritic, and consists of quartz (±30 modal%), plagioclase (±30%), microcline perthite (±25%), biotite and hornblende (±10%). Accessory minerals include titanite, apatite, magnetite and zircon. The mineralogy suggests that these are I-type granites.
4. Analytical methods
4.a. SHRIMP zircon dating
Zircons were separated using magnetic and heavy liquid techniques, mounted in epoxy and ground to about half their thickness. Cathodoluminescence imaging was used to investigate the crystal zoning and to select analytical spots.
The zircon U–Pb dating was performed at the SHRIMP Ion Probe Centre, Chinese Academy of Geological Sciences, Beijing. The analytical procedures are described in Zhao et al. (Reference Zhao, Zhai, Xia, Li, Zhang and Wan2004). The standard zircon, Temora (417 Ma), was used to correct for elemental fractionation, and standard SL13 was used to monitor analytical precision. Common Pb was corrected using non-radiogenic 204Pb. The programs SQUID 1.02 and ISOPLOT were used to reduce the data (Ludwig, Reference Ludwig2001), and IUGS values (Steiger & Jäger, Reference Steiger and Jäger1977) were used to calculate the ages. Uncertainties in Table 1 are reported at the 1σ level and the mean ages are reported at the 95% confidence interval.
SHRIMP zircon U–Pb analytical data for rocks from the Rutog pluton

PbC and Pb* denote the common Pb and radiogenic Pb, respectively, while the common Pb was corrected using non-radiogenic 204Pb.
4.b. Major and trace element analyses
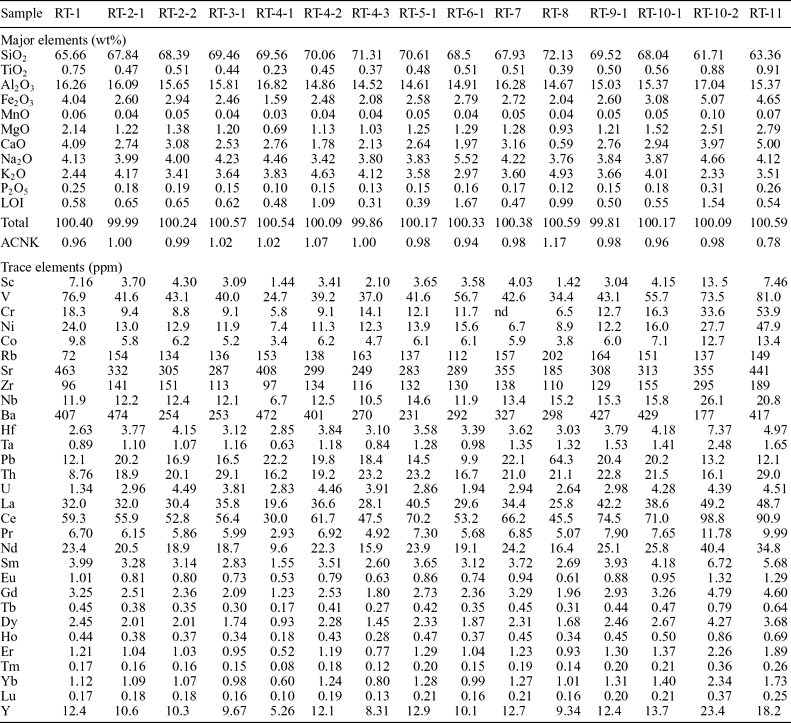
Samples from the Rutog pluton were analysed for major and trace elements at the Guangzhou Institute of Geochemistry, Chinese Academy of Sciences (Table 2). Samples were pulverized in a jaw crusher and then powdered in an agate mill to a grain size smaller than 160 mesh. Major oxides were determined using an X-ray fluorescence spectrometer (XRF) on glass discs, following the analytical procedures described by Goto & Tatsumi (Reference Goto and Tatsumi1996). Analytical uncertainties for most major elements are estimated to be less than 1%, based on repeated analyses of U.S.G.S. standards BHVO-2 (basalt), MRG-1 (basalt) and W-2 (diabase). The measured values of international standards are in satisfactory agreement with the recommended values.
Major and trace element compositions for Rutog granites

LOI – Loss On Ignition; ACNK – molecular ratio of Al2O3/(CaO +Na2O+K2O).
Trace element data were obtained by Inductively Coupled Plasma-Mass Spectrometry (ICP-MS), following the analytical procedures described in Qi, Hu & Gregoire (Reference Qi, Hu and Gregoire2000). About 50 mg of rock powder were dissolved in distilled HF–HNO3 in Savillex screw-top Teflon® beakers held at 150 °C for four days. Analytical precision for REE and HFSE is estimated to be 5% from repeated analyses of U.S.G.S. standards, BHVO-1 and W-2.
4.c. Sr and Nd isotope analyses
For Sr–Nd isotopic analyses, sample powders (~100 mg) were dissolved overnight in distilled HF–HNO3 using Savillex screw-top Teflon® beakers at 150 °C. Separation of Nd from the REE was carried out on HDEHP columns with a 0.18 N HCl elutant. The isotopic analyses were performed using a Micromass Isoprobe Multi-Collector ICP-MS, also at the Guangzhou Institute of Geochemistry.
Measured Sr and Nd isotopic ratios were normalized using a 86Sr/88Sr value of 0.1194 and a 146Nd/144Nd value of 0.7219. The Sr and Nd blanks were 0.5 and 0.3 ng, respectively. Analyses of standards gave the following results: NBS987 87Sr/86Sr = 0.710243 ± 14 (2σ) and Shin Etou 143Nd/144Nd = 0.512124 ± 11 (2σ), equivalent to a value of 0.511860 for the La Jolla international standard (Tanaka et al. Reference Tanaka2004).
5. Analytical results
5.a. SHRIMP zircon dating results
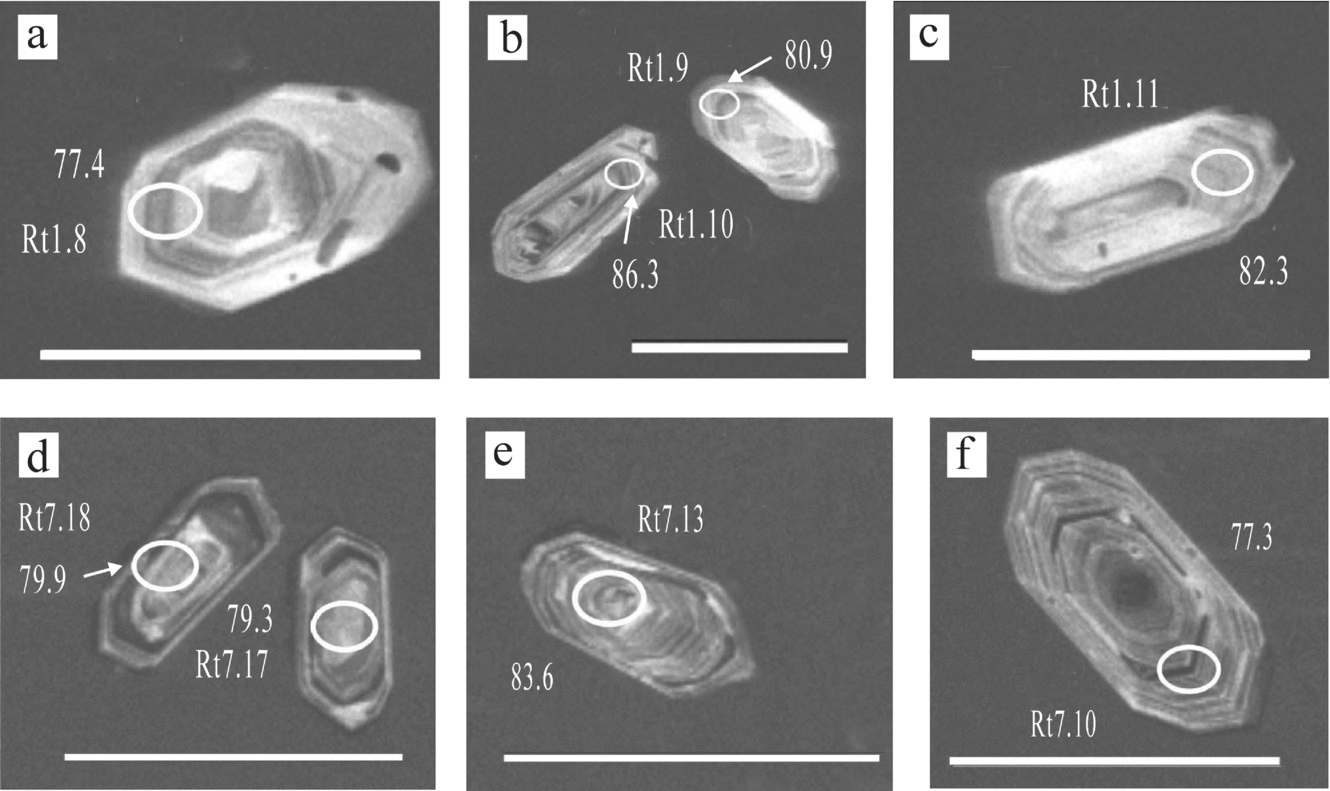
Zircons used for SHRIMP U–Pb dating were separated from a granodiorite (RT-1) and a monzogranite (RT-7). Zircons from the granodiorite (RT-1) are euhedral and prismatic with clear oscillatory zoning indicating a magmatic origin (Fig. 2). These zircons have length to width ratios of 2:1 to 3:1.
Cathodoluminescence images of zircons from the Rutog pluton. SHRIMP analysis points are white circles. The scale is 200 μm.

Cathodoluminescence (CL) imaging reveals that there are some mineral inclusions (e.g. spots RT-1.5 and RT-1.6). A total of 20 analyses were obtained, with Th contents ranging from 15 to 120 ppm and U from 23 to 390 ppm, giving Th/U ratios of 0.32 to 0.95. The analytical results are listed in Table 1 and shown on concordia plots in Figure 3. Fourteen analyses from the inner and outer parts of different grains form a tight cluster with an average 206Pb–238U age of 80.0 ± 1.2 Ma. Six analyses yield slightly younger 206Pb–238U ages due to high U contents or loss of Pb.
SHRIMP U–Pb concordia plots of zircons from the Rutog pluton.

Zircons from the monzogranite (RT-7) contain many inclusions and have well-defined magmatic zoning revealed by CL imaging (Fig. 2). Only those zircons without inclusions or inherited cores were selected for analysis. Nineteen analyses have Th contents ranging from 39 to 195 ppm and U contents from 51 to 317 ppm, yielding Th/U ratios of 0.71 to 1.61 (Table 1). Sixteen of the analyses plot near the concordia and yield 206Pb–238U ages ranging from 74.6 ± 1.7 Ma to 84.5 ± 0.2 Ma with a weighted average of 79.4 ± 0.9 Ma (Fig. 3). Two points have large errors in the 206Pb–238U ages, although they are still within the analytical uncertainties. One analysis (RT-7.1.1) has 355 ppm U, 724 ppm Th and 3.25 ppm Pb and yielded an age of 68.1 ± 1.5 Ma. The ratios of Pb/U and Pb/Th are 0.009 and 0.004, respectively, which are the lowest among all the zircons. This analysis is not included in the final calculation.
The granodiorite and monzogranite have identical 206Pb–238U ages of 80.0 ± 1.2 Ma and 79.4 ± 0.9 Ma, respectively, suggesting that the Rutog pluton formed in the late Cretaceous (c. 80 Ma).
5.b. Major and trace elements
Both the granodiorites and monzogranites have similar compositions, with SiO2 ranging from 61.7 to 72.1 wt%, Al2O3 from 14.5 to 17.0 wt%, Fe2O3 from 1.59 to 5.07 wt% and MgO from 0.69 to 2.79 wt% (Table 2). Their K2O ranges from 2.33 to 4.93 wt% and Na2O from 3.42 to 5.52 wt%, yielding Na2O/K2O ratios of 0.7 to 2.0 (average of 1.2). They have Mg no. ranging from 12.0 to 15.9, with an average of 13.2. Most samples have A/CNK (molecular ratio of Al2O3/(CaO + Na2O + K2O)) values less than 1.1, indicating that they are Al-undersaturated. There are obvious negative correlations between SiO2 and Fe2O3, TiO2, MgO and CaO, and positive correlations between SiO2 and K2O (Fig. 4). These relationships suggest fractionation of ilmenite and plagioclase.
SiO2 v. other major element oxides of rocks of the Rutog pluton.

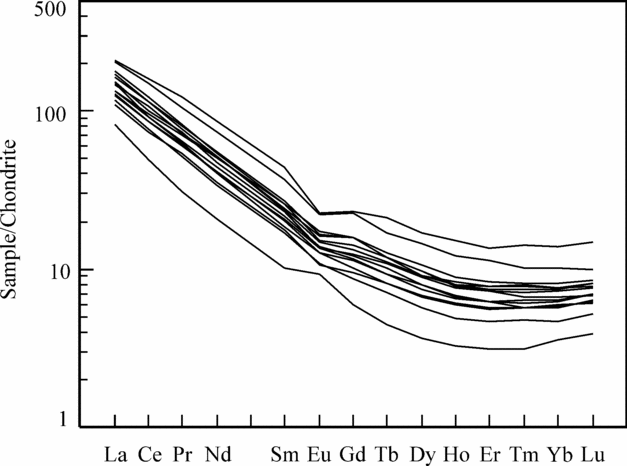
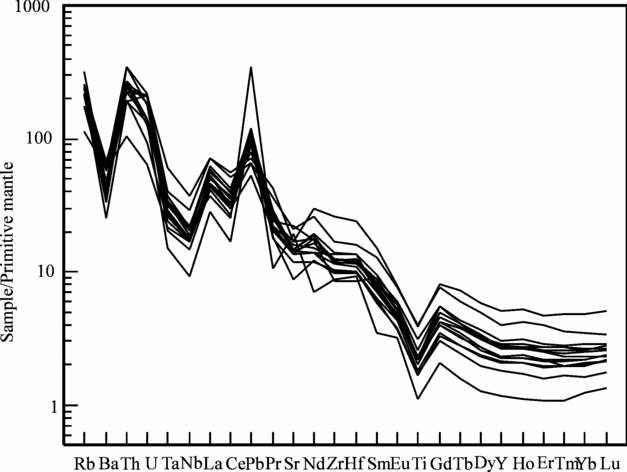
The rocks have high La (19.6 to 49.2 ppm) and low Yb (0.6 to 2.3 ppm), yielding high (La/Yb)n ratios of 15–26. They have LREE-enriched chondrite-normalized REE patterns with slightly negative Eu anomalies (δEu = 0.68–1.15) (Fig. 5). All samples are also enriched in LILE and depleted in HFSE, and display negative Nb–Ta and positive Zr–Hf anomalies in the primitive mantle-normalized trace element diagram (Fig. 6). They have relatively high Sr (163 to 185 ppm) and high Sr/Y ratios (15 to 78, average 30) (Table 2).
Chondrite-normalized REE patterns for rocks from the Rutog pluton. Normalization values are from Sun & McDonough (Reference Sun, McDonough, Saunders and Norry1989).

Primitive mantle-normalized trace-element diagram for rocks from the Rutog pluton. Normalization values are from Sun & McDonough (Reference Sun, McDonough, Saunders and Norry1989).

5.c. Rb–Sr and Sm–Nd isotopes
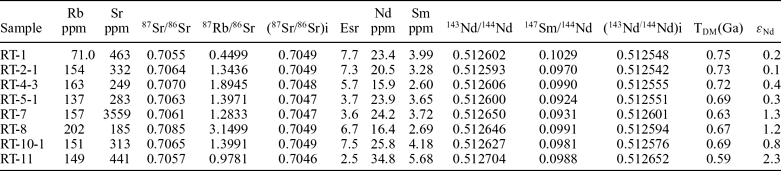
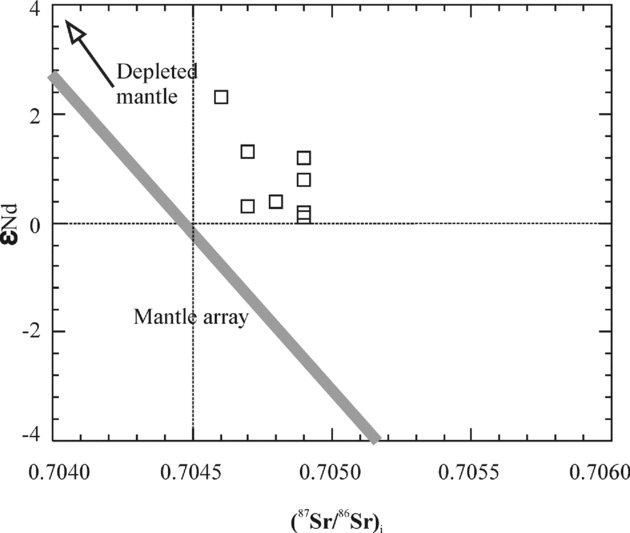
Samples from the Rutog pluton have a wide range of 87Rb/86 Sr ratios (0.45 to 3.15), but a narrow range of initial 87Sr/86Sr ratios (0.7045 to 0.7049) (Table 3). Their f Sm/Nd values range from −0.48 to −0.53, within the range of −0.4 ± 0.2 for corrected TDM calculation (Wu et al. Reference Wu, Jahn, Wilde, Lo, Yui, Lin, Ge and Sun2003a). Therefore, we use a single model age for the discussion. Their initial 143Nd/144Nd ratios range from 0.5125 to 0.5126 and ɛNd (t = 80 Ma) values range from +0.1 to +2.3 with Nd model ages (TDM) of 0.59–0.75 Ga. All samples have higher initial 87Sr/86Sr ratios than the mantle array in the plot of Sr versus Nd isotopes (Fig. 7).
Sr–Nd isotope compositions of rocks from the Rutog pluton

Plots of Sr–Nd isotopes for rocks from the Rutog pluton.

6. Discussion
6.a. Classification of the Rutog granitic rocks
According to their protolith, granitic rocks are normally classified into I-, S-, M- and A-types (Chappell & White, Reference Chappell and White1974; Pitcher, Reference Pitcher and Hsu1982, Reference Pitcher1993).
Chappell & White (Reference Chappell and White1992, Reference Chappell and White2001) pointed out that I-type granites commonly display more regular linear variations in their chemical compositions than S-type granites, which generally display poor correlations between SiO2 and P2O5 and between SiO2 and Pb, different from I-type granitoids (Chappell & White, Reference Chappell and White1992). Well-defined linear trends in the Harker diagrams and a negative correlation between SiO2 and P2O5 suggest that the Rutog rocks are unlikely to be S-type granitoids (Fig. 4).
I-type granitic rocks normally have high Na2O, CaO and low Al2O3 and A/CNK values (molar Al2O3/(CaO+Na2O+K2O) < 1.1) compared to S-type granitoids, although there may be some overlap between them as observed in the Lachlan Fold Belt (Chappell & White, Reference Chappell and White2001). The relatively high Na2O (3.42–5.52 wt%) and K2O (2.33–4.93 wt%) and low Al2O3 (14.52 to 17.04 wt%) and aluminum saturation index A/CNK values (0.78 to 1.17) of the Rutog granitoids are consistent with an I-type classification. This classification is also supported by their low normative corundum (< 1.0 vol.%, except sample RT-8).
The Rutog granitoids do not contain mafic alkaline minerals such as arfvedsonite and riebeckite, and they have low concentrations of Na2O+K2O (6.57 to 8.69 wt%), low (Na2O+K2O)/CaO (1.53–14.7), Fe2O3/MgO (1.67–2.30) and 1000 Ga/Al (1.82–2.39) ratios compared to A-type granitoids (Whalen, Currie & Chappell, Reference Whalen, Currie and Chappell1987). They are also depleted in Nb, Zr, Ce and Y, again typical of I-type granitoids (Whalen, Currie & Chappell, Reference Whalen, Currie and Chappell1987).
6.b. Magmatic differentiation
Fractional crystallization normally occurs during magma emplacement. The negative correlation between SiO2 and MgO of the Rutog granitoids (Fig. 4) suggests accumulation/fractionation of mafic minerals such as hornblende and biotite. Obvious Eu, Sr and Ba negative anomalies (Figs 5, 6) further demonstrate the fractionation of plagioclase (Wu et al. Reference Wu, Jahn, Wilde, Lo, Yui, Lin, Ge and Sun2003b). A positive correlation between Sr and Ba (Fig. 8a) further indicates the fractionation of plagioclase (Li et al. Reference Li, Li, Li, Liu, Yuan, Wei and Qi2007). There is only a weak correlation between Rb and Sr (Fig. 8b), suggesting that K-feldspar was not a fractionating mineral.
Fractional crystallization vector diagrams of Sr v. Ba (a) and Sr v. Rb (b) for the Rutog granites. The vectors are from Li et al. (Reference Li, Li, Li, Liu, Yuan, Wei and Qi2007).

Separation of Ti-bearing minerals (such as ilmenite and titanite) and apatite lead to depletion of Nb–Ta–Ti and P, respectively (Wu et al. Reference Wu, Jahn, Wilde, Lo, Yui, Lin, Ge and Sun2003b). The strong depletion of Nb–Ta–Ti of the Rutog rocks (Fig. 6) indicates fractionation of Ti-bearing phases, and the negative correlation of P2O5 with SiO2 is consistent with fractionation of apatite.
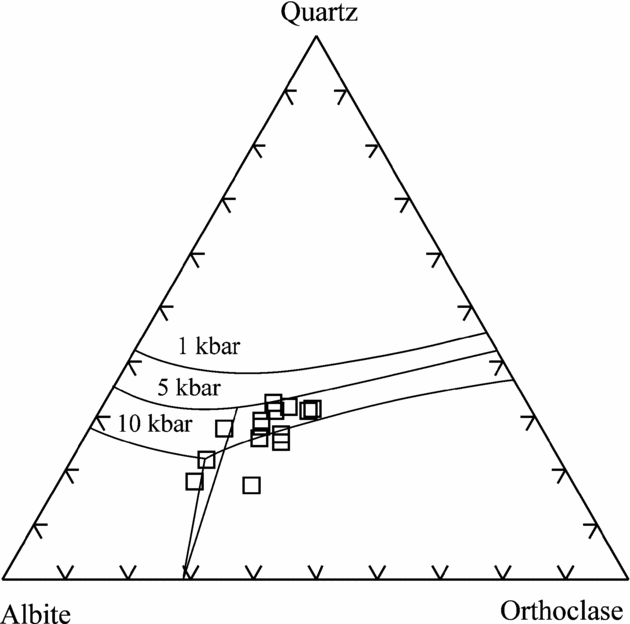
In the CIPW-normative Qz–Ab–Or diagram (Fig. 9), most samples plot in the low-pressure field between 10 kbar and 5 kbar, and to the right of the cotectic/eutectic minima of the H2O-saturated haplogranite system, typical of high-level emplacement of natural low-temperature granites (Johannes & Holtz, Reference Johannes and Holtz1996), suggesting that the Rutog granodiorites were emplaced at pressures less than 1.2 GPa. This conclusion is also consistent with unidirectional growth of dendritic alkali feldspar (Shannon et al. Reference Shannon, Walker, Carten and Geraghty1982).
CIPW-normative Qz–Ab–Or diagram with low-temperature melt compositions at 1, 5 and 10 kbar (Johannes & Holtz, Reference Johannes and Holtz1996).

6.c. Petrogenesis of the Rutog pluton
It is well known that I-type granites can be produced by (1) mafic mineral fractionation at an early stage of mantle-derived magmas, (2) mixing between mantle and crustal melts and (3) partial melting of mafic crust.
Fractional crystallization during the early stages of mafic magma evolution may produce evolved felsic magmas (e.g. Litvinovsky et al. Reference Litvinovsky, Jahn, Zanvilevich and Shadaev2002). Although the Rutog granitoids experienced low-pressure fractional crystallization of amphibole and feldspars as discussed above, there is little evidence that the Rutog rocks were produced by differentiation of mantle-derived melts. Granitoids produced by differentiation of such melts should have model ages approximately similar to their emplacement age (e.g. Sun & Zhou, Reference Sun and Zhou2008). However, the Rutog granitoids have one-stage Sm–Nd modal ages (0.59–0.75 Ga) that are much older than their SHRIMP zircon U–Pb ages of c. 80 Ma. In addition, no mafic plutons have been identified in the region. Therefore, it is highly unlikely that the Rutog pluton was a product of differentiation from mafic magmas.
Mixing between mantle-derived mafic magma and crustal felsic melts can also produce I-type granites (Chappell, Reference Chappell1996; Yang et al. Reference Yang, Wu, Wilde, Xie, Yang and Liu2007). However, the Rutog granitoids have relatively homogeneous compositions, which are atypical of rocks formed by magma mixing. Rocks formed by magma mixing may have different types of zircon with distinct morphologies (Yang et al. Reference Yang, Wu, Wilde, Xie, Yang and Liu2007). Zircons from the Rutog pluton are all euhedral and prismatic with clear oscillatory zoning (Fig. 2), and two samples produce identical U–Pb ages (Fig. 3), suggesting that they were yielded from a homogeneous source region, rather than from mixing of mafic and felsic magmas. In addition, the Rutog rocks have relatively constant 87Sr/86Sr ratios (0.7045–0.7049), high ɛNd(t) values (+0.1 to +2.3), and uniform REE and trace elemental patterns, all of which are inconsistent with a formation by magma mixing.
The Rutog rocks have TDM ranging from 0.59 to 0.75 Ga, suggesting that they formed by melting of older crust. The relatively high ɛNd(t) values and low (87Sr/86Sr)i ratios suggest that their protolith was derived from a depleted mantle source. The Gangdese granitoids and Linzizong volcanic rocks in the same region have similar 87Sr/86Sr ratios (0.704–0.705) and ɛNd(t) values (+2 to +4) (Harris et al. Reference Harris, Xu, Lewis, Hawkesworth and Zhang1988), indicating that they shared a common source region.
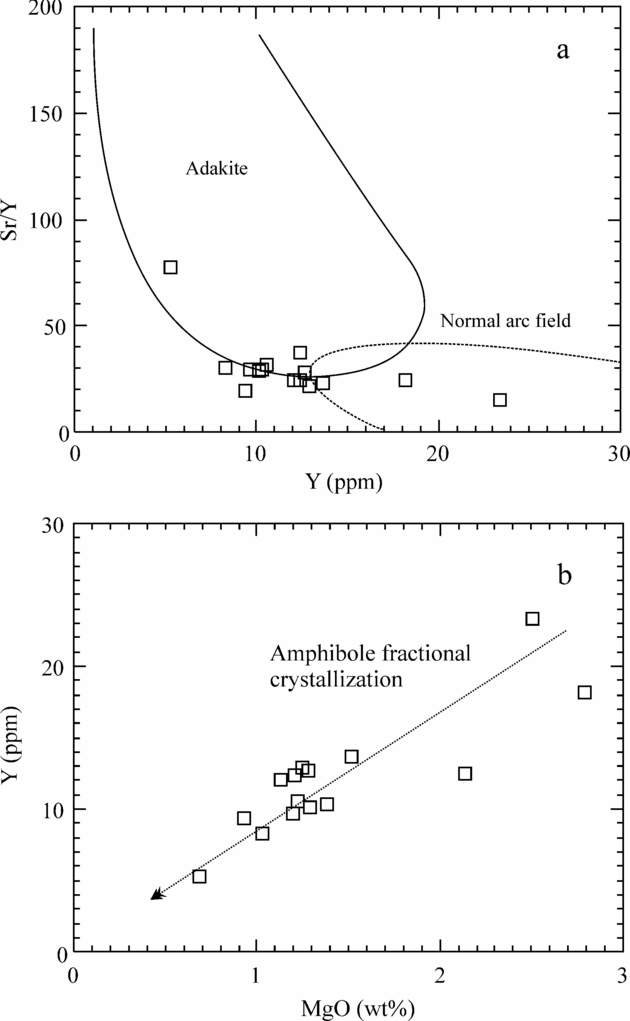
The Rutog rocks have Sr/Y ratios (15.2–78) and Y contents (8.31–23.4) transitional between normal arc and adakitic compositions (Fig. 10a). Three samples that have relatively high MgO and Y (Fig. 10b) and plot in the field of normal arc rocks can be explained by accumulation of amphibole, because amphiboles have relatively high Y contents (Castillo, Janney & Solidum, Reference Castillo, Janney and Solidum1999). Partial melting of thickened, mafic continental crust (>40 km) under relatively high pressures normally produces adakites (Xu et al. Reference Xu, Shinjio, Defant, Wang and Rapp2002; Wang et al. Reference Wang, McDermott, Xu, Bellon and Zhu2005; Xiong, Adam & Green, Reference Xiong, Adam and Green2005; Zhao & Zhou, Reference Zhao and Zhou2008). Experiments have demonstrated that strongly fractionated adakite-like REE patterns, as well as low HREE contents, can only be generated from sources where garnet is stable under vapour-absent conditions at more than 1.2 Gpa (Rapp, Watson & Miller, Reference Rapp, Watson and Miller1991; Rapp & Watson, Reference Rapp and Watson1995; Sen & Dunn, Reference Sen and Dunn1994).
(a) Sr/Y v. Y for the rocks from the Rutog pluton. Fields for adakite or high-Al TTG and normal arc andesite and dacite are from Drummond & Defant (Reference Drummond and Defant1990). (b) MgO v. Y for the rocks from the Rutog pluton showing the fractional crystallization of amphibole.

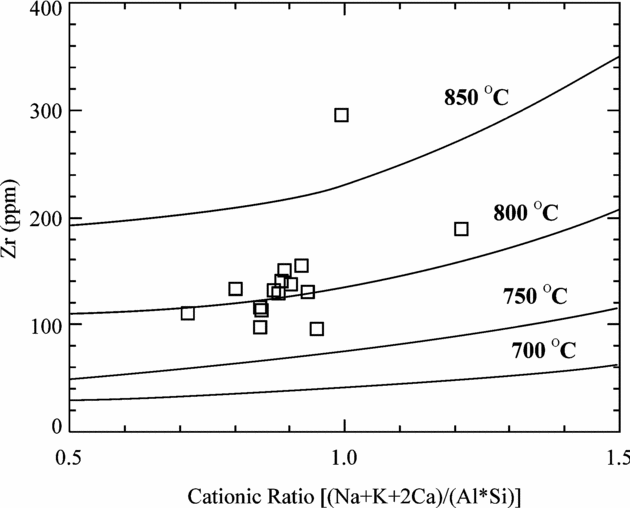
The temperatures of partial melting can be estimated by empirical equations for saturation temperatures of accessory mineral phases, such as monazite and zircon (Watson & Harrison, Reference Watson and Harrison1983; Rapp, Ryerson & Miller, Reference Rapp, Ryerson and Miller1987). Zr solubility is a function of the cation ratio ((Na +K+ 2Ca)/(Al*Si)) and temperature in hydrous peraluminous or metaluminous melts (Fig. 11) (Watson & Harrison, Reference Watson and Harrison1983). Using this formula, we calculate that the Rutog granodiorites were produced at about 800 °C.
Plots of Zr concentration against the cation ratios of (Na+K+2Ca)/(Al*Si) (Watson & Harrison, Reference Watson and Harrison1983).

Wu et al. (Reference Wu, Jahn, Wilde, Lo, Yui, Lin, Ge and Sun2003a,Reference Wu, Jahn, Wilde, Lo, Yui, Lin, Ge and Sunb) proposed a two-stage process to explain the highly fractionated I-type granites in NE China. We apply the same model to explain the petrogenesis of the Rutog pluton. In stage one, the parental magmas were generated by partial melting of the lower part of a thickened mafic crust and then underwent extensive differentiation at low pressures (5–10 kbar) and temperatures (800 °C) at a later stage.
6.d. Secular tectonic evolution of the Gangdese arc
6.d.1. Early Late Cretaceous crustal thickening in Tibet
Recognition of the c. 80 Ma Rutog I-type granitoids has significant implications for the tectonic evolution of the Gangdese arc and the Tibetan Plateau as a whole.
Accretionary orogeny in southern Tibet may have occurred in Late Cretaceous times. Significant upper crustal shortening of the Lhasa Terrane during the Cretaceous resulted in thickening of the continental crust. In the Coqin area, Murphy et al. (Reference Murphy, Yin, Harrison, Dürr, Chen, Ryerson, Kidd, Wang and Zhou1997) documented > 180 km of Cretaceous north–south shortening. The mid-Cretaceous Takena Formation near Lhasa experienced ~40% shortening prior to deposition of the overlying Linzizong volcanic rocks (Y. Pan, unpub. Ph.D. thesis, State Univ. New York, 1993). Large parts of the Lhasa Terrane experienced crustal shortening during Cenozoic times (Yin et al. Reference Yin, Harrison, Ryerson, Chen, Kidd and Copeland1994).
Cretaceous shortening and magmatism in central Tibet are attributed to northward underthrusting of the Lhasa Terrane beneath the Qiangtang Terrane along the Bangong–Nujiang suture zone during low-angle subduction of Neo-Tethyan oceanic lithosphere (Kapp et al. Reference Kapp, Harrison, Kapp, Grove, Lovera and Ding2005). Thus, there might have been substantial crustal thickening in Tibet prior to the India–Asia collision, consistent with the occurrence of the Rutog pluton. Tertiary shortening in central Tibet may record continuous underthrusting of the Lhasa Terrane along the Bangong–Nujiang suture, which may have both accommodated, and been driven by, insertion of the Indian subcontinent into a previously thickened Tibetan crust (Kapp et al. Reference Kapp, Murphy, Yin, Harrison, Ding and Guo2003).
The Lower Cretaceous strata deposited in a flexural foreland basin are thought to have resulted from the Lhasa–Qiangtang collision (Yin et al. Reference Yin, Harrison, Ryerson, Chen, Kidd and Copeland1994). The occurrence of widely exposed Albian–Aptian shallow marine strata is taken as evidence that the Bangong–Nujiang suture zone was near sea level during mid-Cretaceous times (Kapp et al. Reference Kapp, Murphy, Yin, Harrison, Ding and Guo2003).
Thus, we infer that during the early Late Cretaceous, Tibet was situated in an accretionary convergent margin where orogenic processes involving arc magmatism, crustal thickening and rapid tectonic uplift may have been operating actively. This interpretation further suggests that accretionary orogeny took place in the Late Cretaceous and that a high mountain range in the northern part of the Lhasa Terrane in the Late Cretaceous already existed in Tibet prior to the India–Asia collision.
6.d.2. Post-orogenic origin and possible mechanism of melting
Crustal melting is dependent on the thickness and temperature of the crust. Granitic melts are generated where thickened crust is affected by (a) major crustal shears or thrusts (e.g., Barbarin, Reference Barbarin1996), (b) in situ radiogenic heating from the over-thickened crust and (c) conductive heating from underplated magma in a post-collisional setting (e.g. Wang et al. Reference Wang, Fan, Sun, Liang, Zhang and Peng2007).
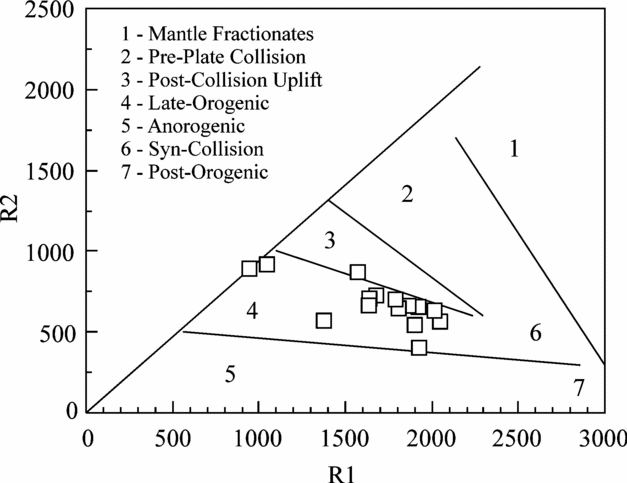
The negative Nb and Ti anomalies of the Rutog pluton are similar to those of syn-collisional granites in continental margins, indicating that the Rutog granitoids formed in a collisional environment (Pearce et al. Reference Pearce, Harris and Tindle1984). On the Y v. Nb diagram, all of the Rutog samples plot in the field of volcanic arc granites (Fig. 12a), whereas on the Y+Nb v. Rb diagram they fall in the field of post-orogenic granitic rocks (Fig. 12b). In addition, all of the Rutog samples plot in the late orogenic field on the R1–R2 diagram (Fig. 13), suggesting that these rocks formed in a post-orogenic setting during early Cretaceous times.
Plots of Y v. Nb (a) and Y+Nb v. Rb (b) for rocks from the Rutog pluton. Reference fields are from Pearce, Harris & Tindle (Reference Pearce, Harris and Tindle1984). Syn-COLG – Syn-collisional Granite; WPG – Within Plate Granite; ORG – Orogenic Granites; VAG – Volcanic Arc Granite.

R1–R2 multi-cationic diagram of rocks from the Rutog pluton (after De la Roche et al. Reference De la Roche, Leterrier, Grand Claude and Marchal1980). R 1 and R 2 are parameters calculated from chemical analyses, R 1 = 4Si − 11(Na+K) − 2(Fe+Ti) and R 2 = 6Ca+ 2Mg+ Al.

We therefore propose that the Rutog pluton formed by crustal melting during continent–continent collision following closure of the Bangong–Nujiang Tethyan ocean. The emplacement of ophiolites along the Bangong–Nujiang suture zone may have occurred at 173 Ma (Zhou et al. Reference Zhou, Malpas, Robinson and Reynolds1997), and collision of the Qiangtang and Lhasa terranes occurred at least in the late early Cretaceous (about 100 Ma) (Pan, Wang & Li, Reference Pan, Mo, Hou, Zhu, Wang, Li, Zhao, Geng and Liao2002), 20 Ma earlier than the formation of the 80 Ma Rutog pluton.
Following closure of the ocean and crustal thickening, some areas of the orogen were invaded by mafic magmas, which promoted dehydration melting of the crustal rocks, generating large volumes of post-orogenic K-rich calc-alkaline granitic rocks including the Rutog pluton. The Sr–Nd isotopic compositions of these rocks indicate that the original magmas were mostly derived from juvenile Neoproterozoic arc material.
Partial melting of this crust was probably initiated by underplating of mafic magma above a flat subduction zone at c. 80 Ma. The wide distribution of Cretaceous arc magmatism in southern Tibet has led some workers to suggest that flat subduction occurred in the region before the India–Asia collision (e.g. Coulon et al. Reference Coulon, Maluski, Bollinger and Wang1986).
7. Conclusions
The Rutog granitic pluton is a composite body with an age of 80 Ma. The Rutog rocks are geochemically I-type granitoids, and were formed by partial melting of a lower part of a thickened continental crust and emplaced at a shallow depth above a flat subduction zone from the south.
Acknowledgements
This work was supported by the CAS Hundred Talents Project (to ZKJ). The authors thank Ms Tao Hua for her assistance with the zircon SHRIMP U–Pb isotope analyses and Xu Yong-Hang for his help with the XRF and ICP-MS analyses. Zhang Yuxiu and Zhong Lifeng assisted with the field work. We thank Prof. Nick T. Arndt, Prof. Paul T. Robinson, and Dr Christina Y. Wang for their comments that helped to improve an early version of this paper. We also thank Dr Mark Allen and Mrs Jane Holland for their editorial work.