1. Introduction
The study of nonlinear coherent structures has always been pursued keenly in several physical contexts. The richness of nonlinear interactions in laser plasma interaction provides a fertile ground for the formation of such structures. For instance, a rich class of one-dimensional nonlinear solitonic structures has been predicted and their stability and interaction have been studied (Kaw, Sen & Katsouleas Reference Kaw, Sen and Katsouleas1992; Naumova et al. Reference Naumova, Bulanov, Esirkepov, Farina, Nishihara, Pegoraro, Ruhl and Sakharov2001a; Esirkepov et al. Reference Esirkepov, Nishihara, Bulanov and Pegoraro2002; Poornakala et al. Reference Poornakala, Das, Kaw, Sen, Sheng, Sentoku, Mima and Nishikawa2002a,Reference Poornakala, Das, Sen and Kawb; Shukla & Eliasson Reference Shukla and Eliasson2005; Romagnani et al. Reference Romagnani, Bigongiari, Kar, Bulanov, Cecchetti, Esirkepov, Galimberti, Jung, Liseykina and Macchi2010; Sundar et al. Reference Sundar, Das, Saxena, Kaw and Sen2011; Verma et al. Reference Verma, Das, Kaw and Tiwari2015, Reference Verma, Bera, Kumar, Patel and Das2017). An approximate fluid model electron magnetohydrodynamics (EMHD) (Biskamp, Schwarz & Drake Reference Biskamp, Schwarz and Drake1996; Isichenko & Marnachev Reference Isichenko and Marnachev1987) describing plasma response at fast electron time scales provides for nonlinear coherent solutions comprising of rotating electron currents in two dimensions. They form stationary magnetic monopoles and propagating dipole structures. Their dynamics has been described by several authors (Bulanov et al. Reference Bulanov, Esirkepov, Lontano and Pegoraro1997; Das Reference Das1999) with the help of fluid simulations of EMHD and its generalizations (Yadav, Das & Kaw Reference Yadav, Das and Kaw2008; Yadav et al. Reference Yadav, Das, Kaw and Sengupta2009; Yadav Reference Yadav2011). Particle-in-cell simulations studying the properties of the electron vortex current have also been carried out, even as late as in 2018 by Lezhnin et al. (Reference Lezhnin, Kamenets, Esirkepov and Bulanov2018), showing the annihilation of the magnetic field in a collisionless inhomogeneous plasma. An experimental study by Yabuuchi et al. (Reference Yabuuchi, Das, Kumar, Habara, Kaw, Kodama, Mima, Norreys, Sengupta and Tanaka2009) confirms anomalous dissipation of energy in electron current structures passing through an inhomogeneous plasma as predicted by Yadav et al. (Reference Yadav, Das, Kaw and Sengupta2009). With the inclusion of ion dynamics particle-in-cell studies have revealed the explosion of these structures at ion time scales (Lezhnin et al. Reference Lezhnin, Kamenets, Esirkepov, Bulanov, Gu, Weber and Korn2016).
The generation of a two-dimensional quasistatic magnetic field by a relativistically intense laser propagating in an underdense plasma was shown in one of the earliest works by Askar'Yan et al. (Reference Askar'Yan, Bulanov, Pegoraro and Pukhov1994). Magnetic structures with the topological profile of monopolar and dipolar symmetry in two dimensions have also been observed in many beam/laser plasma interaction simulations. For instance, the formation of coherent structures at the wake of the laser pulse propagating inside an underdense plasma medium has been shown in several studies (Bulanov et al. Reference Bulanov, Lontano, Esirkepov, Pegoraro and Pukhov1996; Naumova et al. Reference Naumova, Koga, Nakajima, Tajima, Esirkepov, Bulanov and Pegoraro2001b). In another work (Jia et al. Reference Jia, Mima, Cai, Taguchi, Nagatomo and He2015) the formation of magnetic dipoles has been shown in a laser interacting with an overdense plasma medium and also for the case of counter-streaming beams Nakamura (Reference Nakamura, Bulanov, Esirkepov and Kando2008, Reference Nakamura and Mima2010). The application of an external magnetic field was, however, shown to be necessary for dipole formation in the case of a counterstreaming beam. For the case of a laser interacting with overdense plasma medium, the detachment and propagation of the dipoles from the critical surface was possible only in the presence of an external magnetic field.
Studies showing the formation of coherent structures by a laser falling on an overdense plasma medium have, therefore, been few and seem to require an external magnetic field. In addition to being an issue of fundamental interest, the formation of such structures by a laser on overdense plasma targets may also have certain other implications. For instance, it is often desirable to transport and dump energy in an overdense plasma region which is inaccessible to lasers. The energetic electron beams created by the laser at the critical density layer of the plasma medium is usually employed for the task. Electron beam divergence and associated electromagnetic (EM) instabilities often make this feat challenging. It is desirable that the electron beam should carry high energy and it should propagate towards the desired spot where one wishes to dump the energy with minimal loss. A question that has often been a topic of investigation is: Can coherent structures formed by localized electron current flows be of any help for this task? In a recent work by Yadav et al. (Reference Yadav, Bera, Verma, Kaw and Das2020), it has been shown that the localized electron current vortices permitted by the EMHD model can be guided and made to traverse at a desired location by appropriately tailoring the plasma density profile. Several questions then arise: (i) Can coherent rotating electron currents directly be generated by laser when it falls on the overdense plasma medium without requiring any external magnetic field? (ii) Can these structures have relativistic energies (so as to pack as high energy as possible in the structure)? (iii) Do these relativistic structures remain robust? (iv) What are the characteristic dynamical traits of such relativistic structures? Our paper here aims at addressing some of these questions.
We thus aim to address the role of an intense laser ( $I=10^{21}$ W cm
 $^{-2}$) in the spontaneous formation of coherent structures when it is incident on an overdense plasma
 $(10 n_c(n_c= \omega _L^2 m_e\epsilon _0/e^2))$. The laser transverse profile has been chosen to be finite in our simulations. At this laser intensity, under the influence of strong electric field of laser, electrons gain a directed velocity of the order of the speed of light (
 $\sim c$) in the system. Hence, a pulse can propagate deeper than skin depths as the effective plasma frequency gets modified due to relativistic modification of the electron mass (Kaw & Dawson Reference Kaw and Dawson1970; Davies Reference Davies2008; Kaw Reference Kaw2017). We show the dynamics of energetic electrons under the influence of self-generated magnetic and electric field in the plasma. The energetic electrons are trapped inside a partially evacuated electron density cavity while background plasma electrons are piled up at the periphery of these structures. The energetic electrons (generated by the laser pulse) and background plasma electrons thus organize themselves as coherent current structures which are found to be quite robust and stable. It is also observed that once two such structures with currents rotating in opposite directions come close to each other (within a distance of electron skin depth), they behave like propagating dipolar magnetic structures. Due to their localized nature, a huge EM field, and hence a considerable amount of energy, is packed within a dipole. As these structures generate and propagate in an overdense plasma medium they can be suitable for a compact and efficient source of energy transport in high density plasmas. With the advancements in laser technology, strong EM fields of laser
 $(E_0= 10^{12}-10^{13}$ V m
 $^{-1})$ while interacting with overdense plasma open up the possibility of formation of such coherent structures. We observe the formation of dipolar structure around the critical layer. Due to the overdense nature of plasma, approximately
 $32\,\%$ of laser pulse energy is seen to get reflected. The remaining energy is transferred to the electrons, which form the coherent structures.
The paper has been organized as follows. Section 2 describes simulation set-up. Section 3 explains the formation of coherent magnetic structures and their propagation dynamics. Section 4 illustrates the behaviour of electrons as they interact, get entrained and subsequently get emitted from these magnetic dipoles. Section 5 provides the concluding remarks.
2. Simulation details
We have employed an OSIRIS 4.0 framework to carry out particle-in-cell simulations (Hemker Reference Hemker2000; Fonseca et al. Reference Fonseca, Silva, Tsung, Decyk, Lu, Ren, Mori, Deng, Lee, Katsouleas and Adam2002, Reference Fonseca, Martins, Silva, Tonge, Tsung and Mori2008) for our study. We chose a two-dimensional slab geometry with the  $x$–
 $y$ plane as our simulation domain. A square box with each side having a length
 $L= 500d_{e}$ with
 $25\,000 \times 25\,000$ cells is considered (
 $d_e= c/\omega _{pe}$ is the skin depth of the plasma corresponding to a plasma density
 $n_0$, which is chosen for normalization). Time has been normalized by
 $t_N=\omega _{pe}^{-1}$, where
 $\omega _{pe}$ is the plasma frequency corresponding to the density
 $n_0$. The length is normalized by
 $x_N= d_e$, fields by
 $B_N=E_N= m_ec\omega _{pe}/e$, current density with
 $J_N=n_0ec$. The normalization of vector potential is provided by
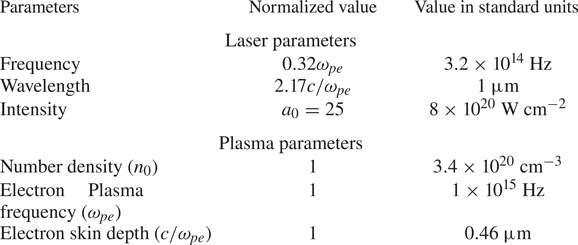
 $A_n = m_ec^2/e$. From now onwards all the variables will be expressed in these units unless explicitly specified. Table 1 presents laser and plasma parameters in normalized units and possible values in the standard units.
Simulation parameters: in normalized units and possible values in standard units.

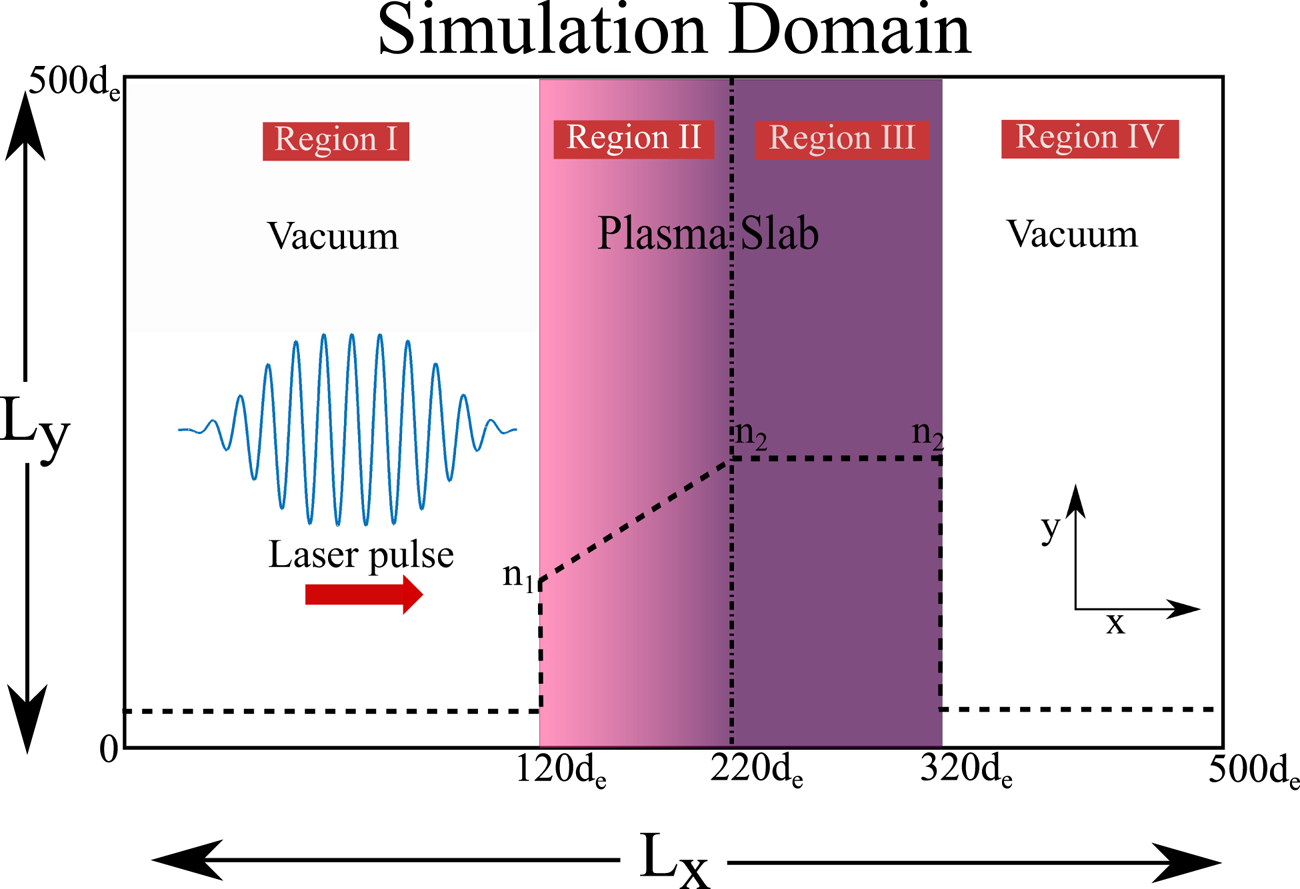
Figure 1 shows the schematic of the simulation geometry. The simulation box along  $x$ has been divided into four regions. Regions I and IV are vacuum regions. The plasma slab is confined within regions II and III. The plasma density linearly rises with
 $x$ from a value of
 $n_1$ (at the vacuum plasma interface of region I and II) to
 $n_2$ in region II. Thereafter, in region III the plasma density remains constant at the value of
 $n_2$. Region IV is again vacuum. Simulations have been carried out for a choice of
 $n_1 = 5.0 n_c$ and
 $n_2 = 5.5n_c$ and
 $10n_c$. The two choices of
 $n_2$ have been made to observe the influence of sharp and shallow density gradients on the dynamics. Ions have been kept stationary in the simulation and serve as a neutralising background.
Schematic of simulation set-up (not to scale) used for this study. The simulation plane has been divided into four regions where region I and IV are vacuum and region II and III contain plasma. A finite longitudinal and transverse extent intense pulse is incident on this plasma slab. We take three different cases in our simulation: (i) homogeneous density (case (A)) with  $n_1=n_2=10n_c$; (ii) inhomogeneous density (case (B)) with
 $n_1=5n_c, n_2= 10 n_c$; (iii) inhomogeneous density (case (C)) with
 $n_1=5n_c, n_2= 5.5 n_c$.

A  $p$-polarized laser pulse (with electric field lying in the two-dimensional plane of the simulation) is incident normally from the left-hand side of the target. The longitudinal profile of laser pulse is a polynomial function with a rise and fall time of
 $35 \omega _{pe}^{-1}$ and flat top for
 $10 \omega _{pe}^{-1}$. The laser profile along the transverse
 $\hat {y}$ is Gaussian with a full width at half-maxima of
 $30d_e$. The boundary condition for particles and EM fields are absorbing in both the directions.
3. Observations
We have studied the interaction of an intense laser pulse (i.e.  $a_0>1$) with an overdense plasma slab. The pulse can penetrate deeper than electron skin depths due to relativistic modification in plasma frequency (Kaw & Dawson Reference Kaw and Dawson1970; Davies Reference Davies2008; Kaw Reference Kaw2017). The electrons in this region accelerate into the plasma target giving rise to a forward current which is balanced by the reverse shielding current by the background electrons (Modena Reference Modena1995; Malka & Miquel Reference Malka and Miquel1996; Wharton et al. Reference Wharton, Hatchett, Wilks, Key, Moody, Yanovsky, Offenberger, Hammel, Perry and Joshi1998; Adam, Héron & Laval Reference Adam, Héron and Laval2006). Such a configuration of interpenetrating currents is susceptible to various instabilities (Weibel Reference Weibel1959; Califano, Pegoraro & Bulanov Reference Califano, Pegoraro and Bulanov1997; Califano et al. Reference Califano, Prandi, Pegoraro and Bulanov1998; Bret, Firpo & Deutsch Reference Bret, Firpo and Deutsch2005). In the nonlinear phase, instabilities would lead to the generation of coherent structures and/or turbulence (Chatterjee et al. Reference Chatterjee, Schoeffler, Singh, Adak, Lad, Sengupta, Kaw, Silva, Das and Kumar2017). In this work, we focus on formation of coherent structures via self-organization of EM fields in plasma.
In our simulation we consider two cases, one in which we choose  $n_1=n_2$, which corresponds to a homogeneous plasma slab in the combined region II and III. In the other case we choose
 $n_1 \neq n_2$ for which plasma density in region II is inhomogeneous, followed by region of homogeneous plasma density profile (region III). The formation of coherent structures for the homogeneous and inhomogeneous cases has been explained in separate subsections followed by a discussion of their characteristic features and dynamical traits.
3.1. Homogeneous plasma
In this section, we focus our study on the formation of coherent structures for the case when a laser falls on a homogeneous plasma slab. For these simulations, therefore, the plasma density in region II and region III (figure 1) is chosen to be identical, i.e.  $n_1 = n_2 = 10n_c$, where
 $n_c$ denotes the critical density for the incident laser. We term this simulation run as case (A). The plasma is overdense for the laser pulse. We choose a high value of laser intensity corresponding to
 $a_0 = e \mid A \mid /m_ec^2 = 25$, where
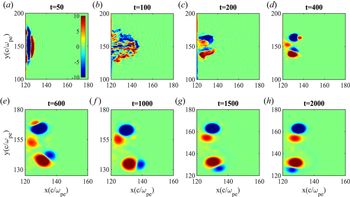
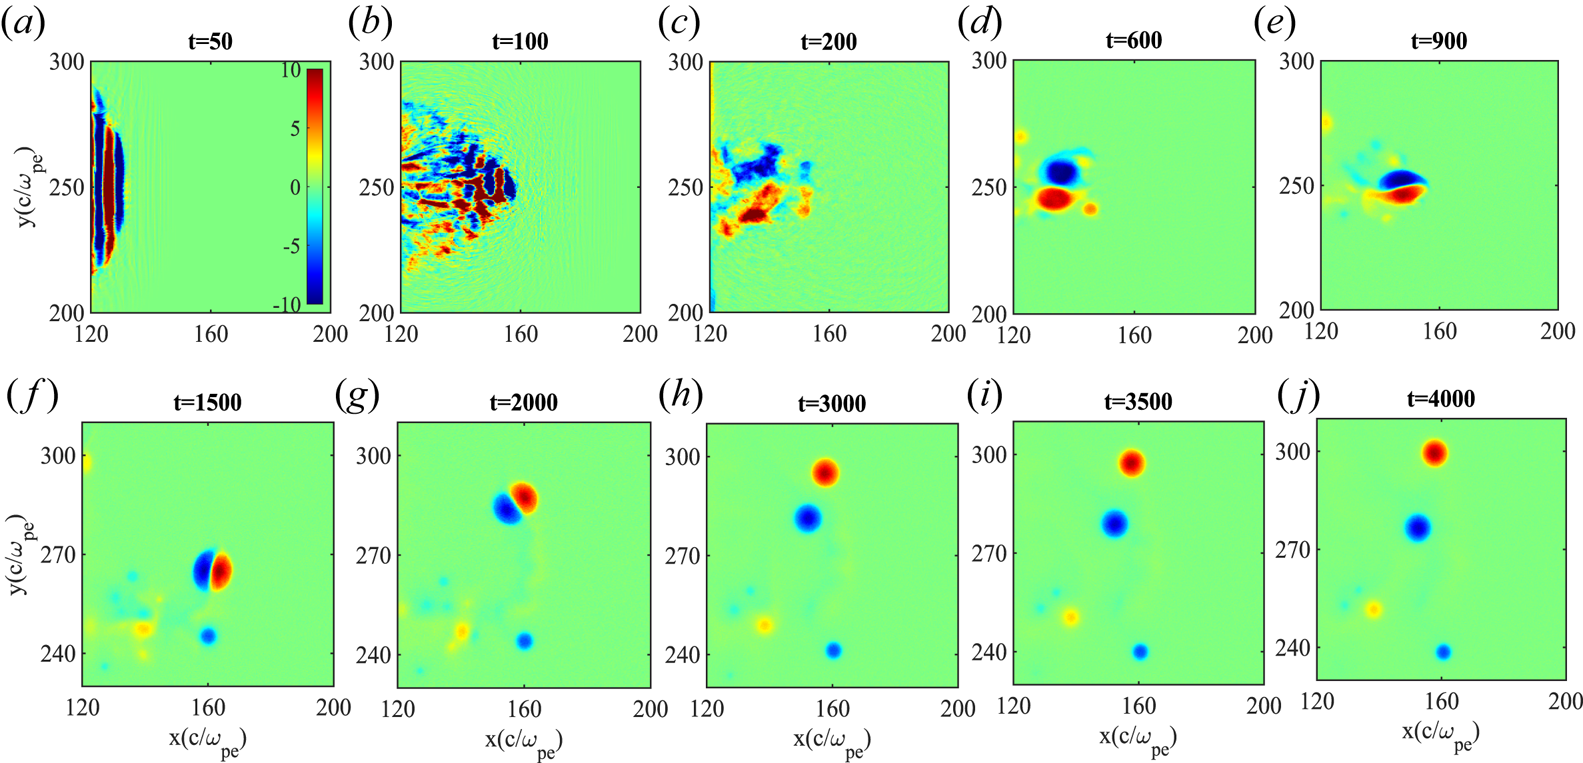
 $\boldsymbol {A}$ is the vector potential of the laser. It can be observed from figure 2, (
 $t= 50$) that magnetic field structures start appearing in the region where plasma density is finite. This indicates that currents have been generated in the plasma system due to the flow of electrons. At subsequent times, deep regions of plasma get disturbed. The magnetic structures initially appear to be disordered and fragmented (figure 2,
 $t= 100$), however, subsequently they appear to organize and form structures with bigger scales (
 $t = 200$). The blue and the red colour regions in the plot show magnetic fields with opposite polarity. The magnetic structures with similar polarity are observed to coalesce with each other and form bigger structures. Thereafter, more reorganization takes place and robust coherent structures are formed.
Evolution of  $B_z(m_ec\omega _{pe}/e)$ for the case where the plasma slab has homogeneous density profile, i.e.
 $n_1=n_2=10n_c$ (case (A)).

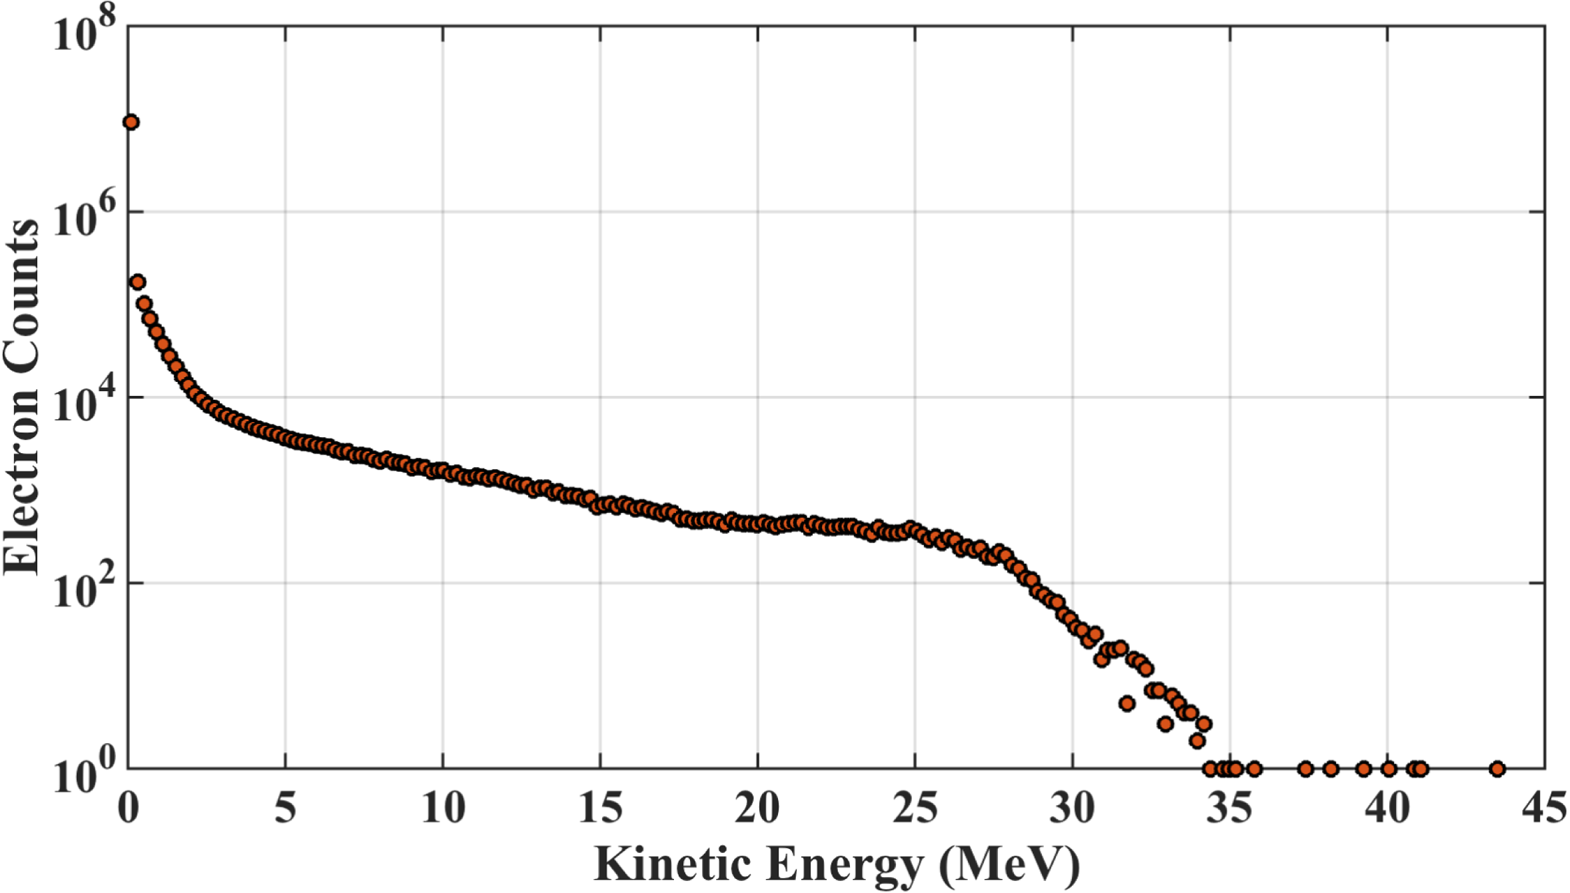
The spectrum of electron energy for this simulation has been depicted in figure 3 showing the energy count of electrons after the coherent structure has been formed. It can be observed that there is significant electron count having energy in the MeV range, indicating that the electrons have acquired relativistic energies. A detailed discussion of their transport properties is discussed in § 3.3.
Electron energy spectrum at t = 450 for case (A), as can be observed electron energy goes up to 30–40 MeV establishing the relativistic nature of dipole and particles in it.

3.2. Inhomogeneous plasma
We have also carried out simulations for an inhomogeneous plasma density profile where two different plasma density gradients have been chosen. For case (B) a sharp density gradient with  $\textrm {d} n/{\textrm {d} x} = 0.05 (n_0\omega _{pe}/c)$ has been chosen for which
 $n_1 = 5.0n_c$ and
 ${n_2 = 10n_c}$. For case (C) we have chosen a shallow density gradient of
 $\textrm {d} n/{\textrm {d} x} = 0.005(n_0\omega _{pe}/c)$ corresponding to
 $n_1 = 5n_c$ and
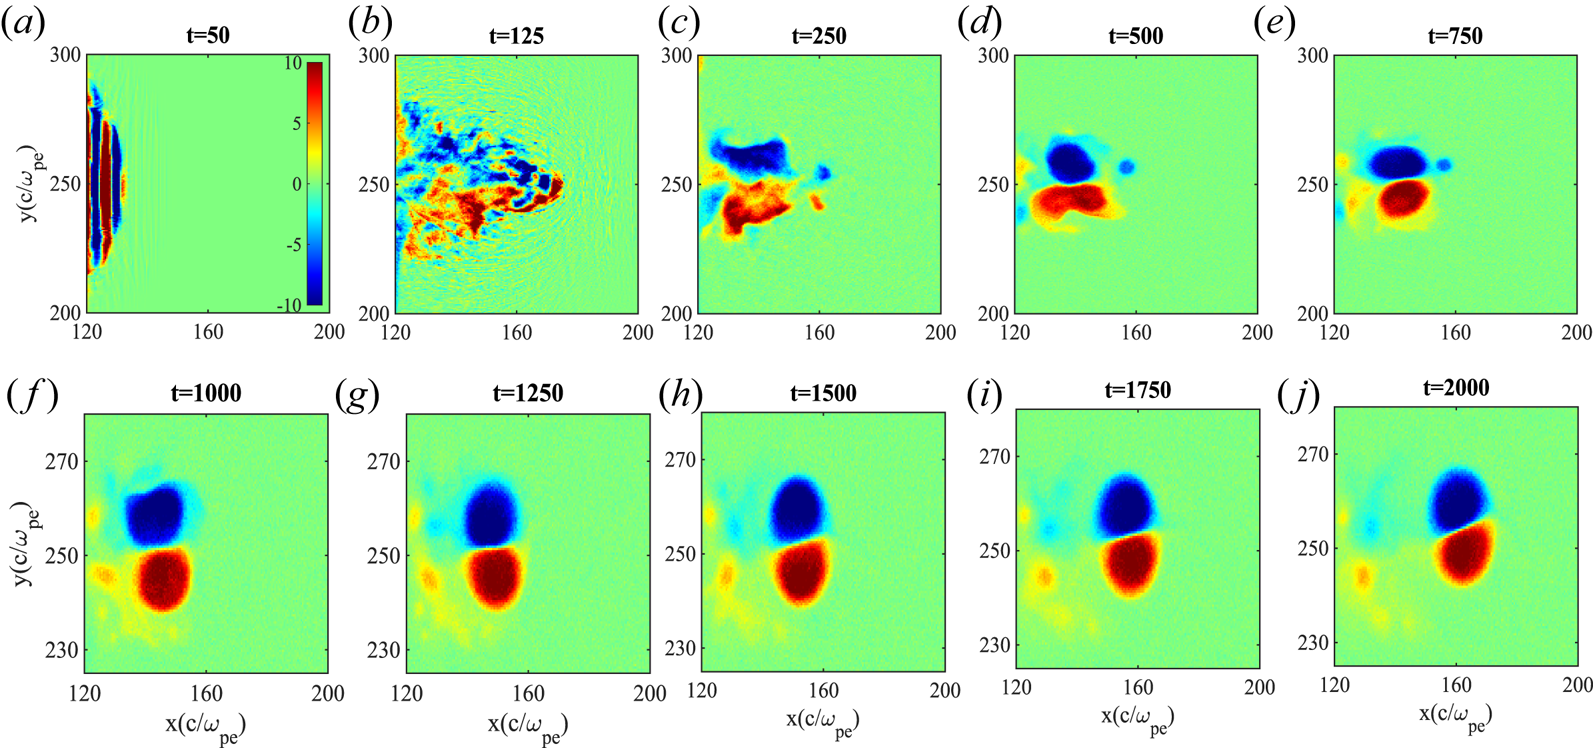
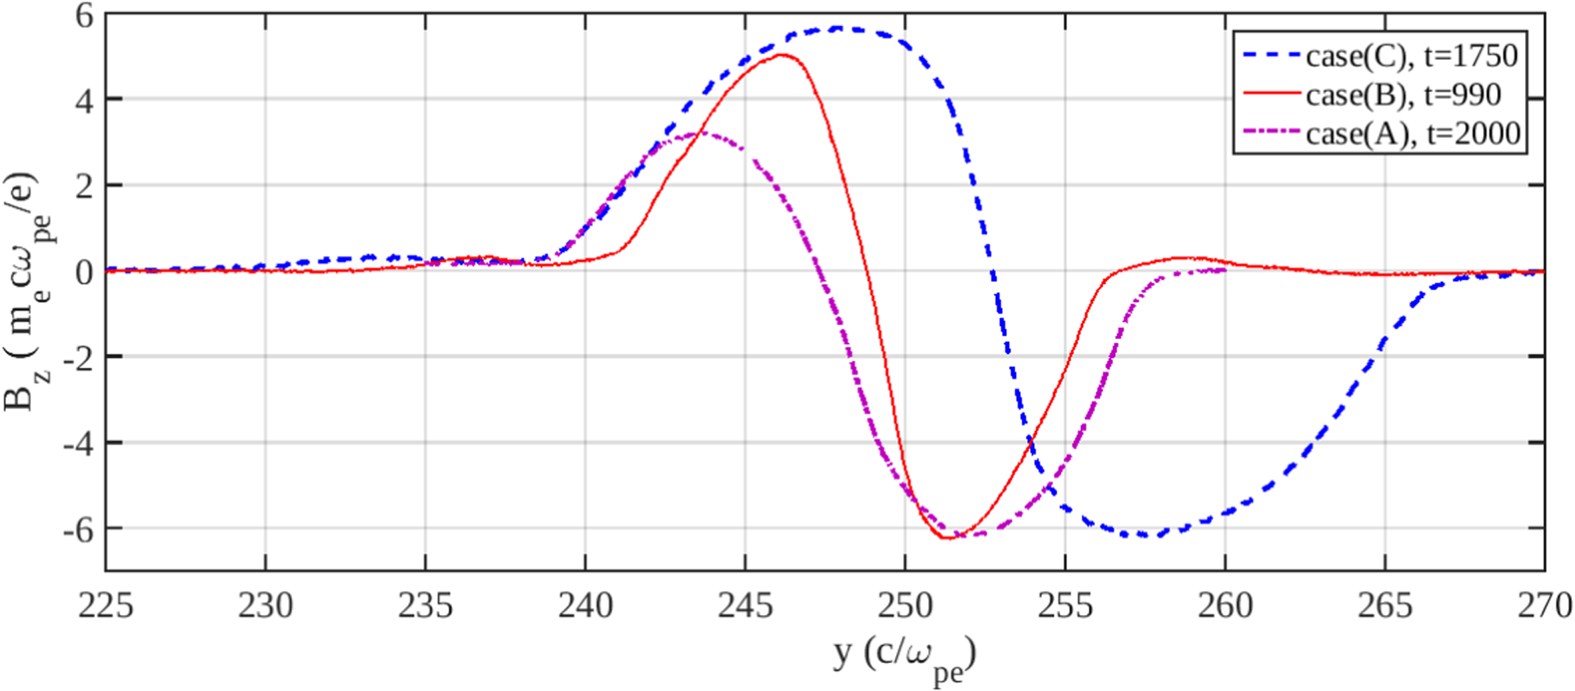
 $n_2 = 5.5n_c$. We observe formation of coherent structures for these two cases as well, shown in figures 4 and 5, respectively, for case (B) and case (C). A comparison of the sizes of these structures for the three cases has been shown in figure 6. For case (A) and case (B) the structures are smaller and sharper as compared with case (C). The size of the coherent structure appears to depend on the value of plasma density. It is typically small when the plasma density is high.
Evolution of  $B_z(m_ec\omega _{pe}/e)$ for case (A) where the plasma slab has inhomogenous density profile, i.e.
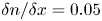 $\delta n/\delta x= 0.05$ in region II along
 $\hat {x}$ (case (B)).

Evolution of  $B_z(m_ec\omega _{pe}/e)$ for case (B) where the plasma slab has inhomogenous density profile, i.e.
 $\delta n/\delta x= 0.005$ in region II along
 $\hat {x}$ (case (C)).

Comparing the  $B_z(m_ec\omega _{pe}/e)$ profile of all three cases (case (A), (B) and (C)) as a function of
 $y$. The
 $x$-axis for case (A) has been shifted up by
 $80 c/\omega _{pe}$ to compare with case (B) and case (C) dipoles. We observe that the dipole in case (C) is larger than the ones in case (A) and (B).

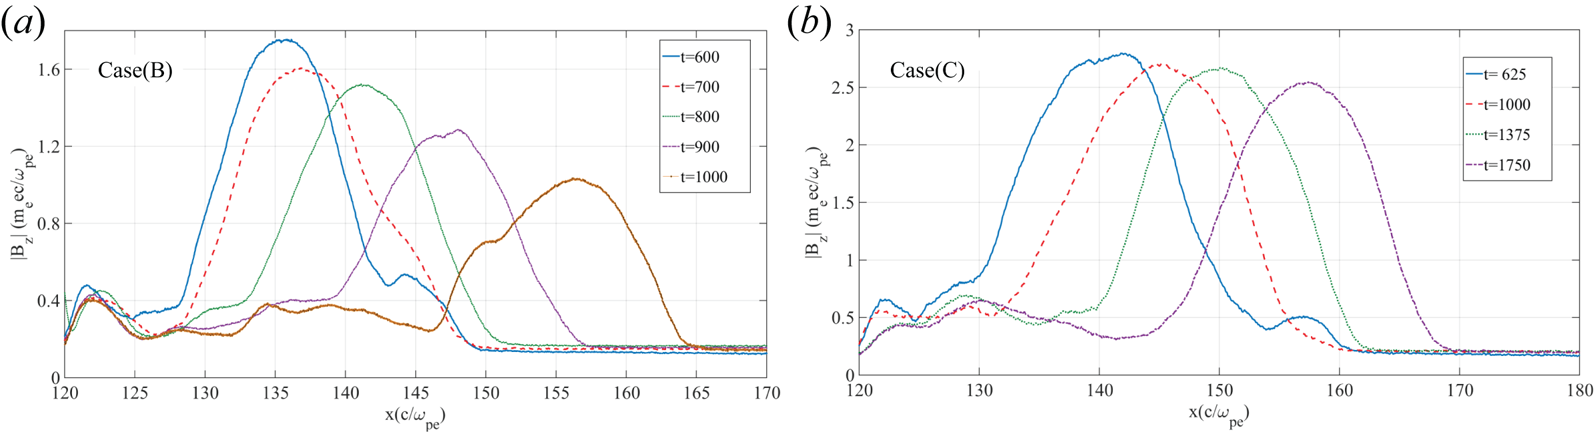
We establish the robustness of the dipole in case (C) and a higher translational velocity in case (B), we plot  $\langle |B_z|\rangle$ as a function of
 $x$ at different times (see figure 7). In case (B) (figure 7a), the amplitude of
 $\langle |B_z|\rangle$ decreases with time and the dipole reaches
 $x=155$ in 400 plasma periods. While in case (C), the amplitude of
 $\langle |B_z|\rangle$ does not change and the dipole travels the same distance in 1000 plasma periods, approximately. Thus the dipole structure is found to be more robust and propagates faster in a shallower density gradient.
Spatial variation of  $\langle |B_z|\rangle$ for case (B) and case (C) depicting the strength and translation velocity of dipolar structure for the two cases has been shown. For case (B), the dipole is relatively less robust as compared with case (C). However, the translation velocity of the dipole is higher for case (B).

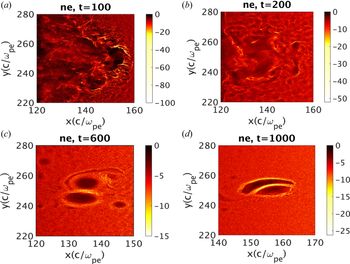
Next we show the electron density profile for these magnetic structures. Figure 8 shows snapshots of electron charge density for case (B). We observe evacuation of the electron density from the spatial regions where these magnetic structures are formed and the piling up of electron density at the periphery.
Snapshots of charge density of dipolar structure where it can be observed that the electrons get evacuated from the centre and accumulated at the periphery of the dipolar lobe.

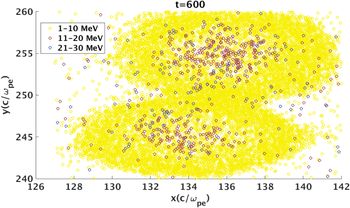
The spatial profile of the kinetic energy of electrons around a typical magnetic dipolar structure has been shown in figure 9. As can be observed, electron density is higher at the periphery with energy ranging from 1–10 MeV; on the other hand, electron density is relatively lower inside the structure with higher kinetic energy (10–35 MeV).
Distribution of particles according to their kinetic energy range in the dipole plane. As can be observed the periphery electrons have lower energy than the ones in inner region of dipole.

Furthermore, the fractional energy content of dipolar structure formed in case (B) has been analysed and it was found that it contains approximately  $14.7\,\%$ of the total energy of system. In that fraction, approximately
 $78\,\%$ of total electromagnetic field energies and
 $8.8\,\%$ of the total kinetic energy of the system is possessed by this magnetic structure. This shows that dipolar structure traps a considerable amount of EM energy.
3.3. Dynamical traits and characteristic features of coherent structures
The discussions in the previous subsection show that these coherent magnetic dipolar structures are somewhat distinct than are the well known solutions of the EMHD equations. For example, the observed structures involve relativistic electrons. Furthermore, these structures have significant depletion of electron density in the core region of the lobes. The evacuated electrons pile up at the periphery of these structures. It is thus natural to see whether the dynamical traits of these structures is similar to the well known solutions.
From the magnetic field colour plots shown in figures 2, 4 and 5 for the three cases, it can be observed that there are essentially two kinds of structures. The first kind is an isolated circular lobe of a particular polarity of magnetic field termed as monopoles (clearly observable in lower section of figure 4 at  $t=1500$). The other kind is when two opposite polarity magnetic fields come within a distance of electron skin depth and behave as single entity. These structures are termed as dipoles (shown in figures 4 and 5).
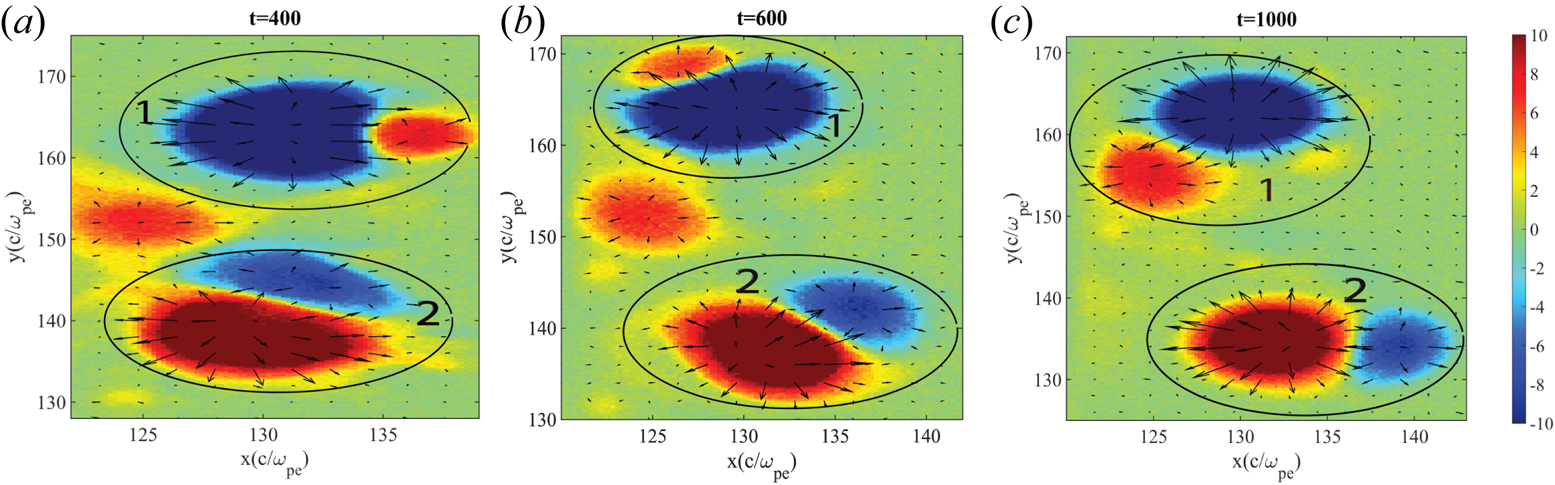
The magnetic field  $\boldsymbol {B}$ is perpendicular to the plane sustained by the rotating electrons in the cavity. In homogeneous plasma, we observe that the monopole remains stationary and dipolar lobes rotate around each other due to their unbalanced nature (figure 2). To clearly illustrate this feature we plot the quiver of electric field superposed on the surface plot of magnetic field (figure 10). It can be seen that the electric field is pointing radially outward (along
 $\hat {r}$) and the magnetic field being along
 $\hat {z}$ gives a rotatory motion to the dipole along
 $\hat {\theta }$ which is along
 $\boldsymbol {E}\times \boldsymbol {B}$ direction. The net magnetic field of the dipolar structure decides whether it will have clockwise or anti-clockwise rotation. Therefore, the larger lobe gets to decide the direction of rotation of the dipole.
Quiver plot of  $\boldsymbol {E} (m_ec\omega _{pe}/e)$ is being plotted over the colourplot of
 $B_z (m_ec\omega _{pe}/e)$ to show the effect of
 $\boldsymbol {E} \times \boldsymbol {B}$ in the homogeneous density (case (A)). We trace the trajectory of two dipolar lobes marked as 1 and 2. For dipole 1, the blue lobe dominates over the red, therefore, the rotation is along
 $\hat{E}_r \times -\hat{B}_z$ (governed by the blue lobe). This makes dipole 1 rotate clockwise. On the other hand, for dipole 2, the red lobe dominates which makes its rotation along anti-clockwise direction.

In an inhomogeneous plasma, the dipole translates (figure 4 at  $t=600\text {--}900$) and then curves around (figure 4 at
 $t=1500\text {--}2000$). An additional drift acts on the dipole due to inhomogeneity in plasma density. This drift is governed by
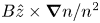 ${B\hat {z}\times \boldsymbol {\nabla }n}/{n^2}$ (Yadav Reference Yadav2011). At
 $t=600$ (figure 4) the drift due to inhomogeneity is in the
 $+\hat {y}$ direction for the positive lobe of the dipole and
 $-\hat {y}$ for the negative lobe, as a result of which they come closer (figure 4,
 $t=900$). Due to unbalanced lobes, the dipole curves around and starts moving in an upward direction. After a while (figure 4,
 $t = 2000$), this drift acts on the two lobes in such a way that it separates them from each other (acts towards
 $-\hat {y}$ for blue and
 $\hat {y}$ for red) resulting in two monopoles (figure 4,
 $t = 3000$).
It is well known that the non-relativistic magnetized electron fluid equations governed by EMHD (Isichenko & Marnachev Reference Isichenko and Marnachev1987; Das Reference Das1999) fluid model permits exact solutions having monopole and dipole configurations. Our observations here have shown the spontaneous formation of structures having similar magnetic configurations for electron fluid but with relativistic energies. The structures not only form spontaneously but also remain stable and robust. The dynamical trait of these relativistic structures (viz. stationarity of monopoles and axial propagation of dipoles in homogeneous plasma density, propagation along the curved path when the lobes of the dipole are not of equal strength) compare well with those exhibited by non-relativistic solutions. In the presence of inhomogeneous plasma density also, the propagation characteristics match with the non-relativistic counterpart. The additional drift along  $\boldsymbol {B} \times \boldsymbol {\nabla } n$ predicted and observed in various studies (Yadav Reference Yadav2011; Yadav et al. Reference Yadav, Das and Kaw2008) is also observed in our simulations. For instance, a comparison of case (B) and case (C) shows that the propagation is faster for the dipole when the density gradient is sharper (figure 7). Also when the dipolar structure is moving towards the high density side, its lobes get compressed and come closer (see figure 4). On the other hand when the dipole is propagating along decreasing density gradient the two lobes separate out and become monopoles.
4. Particle and kinetic level features
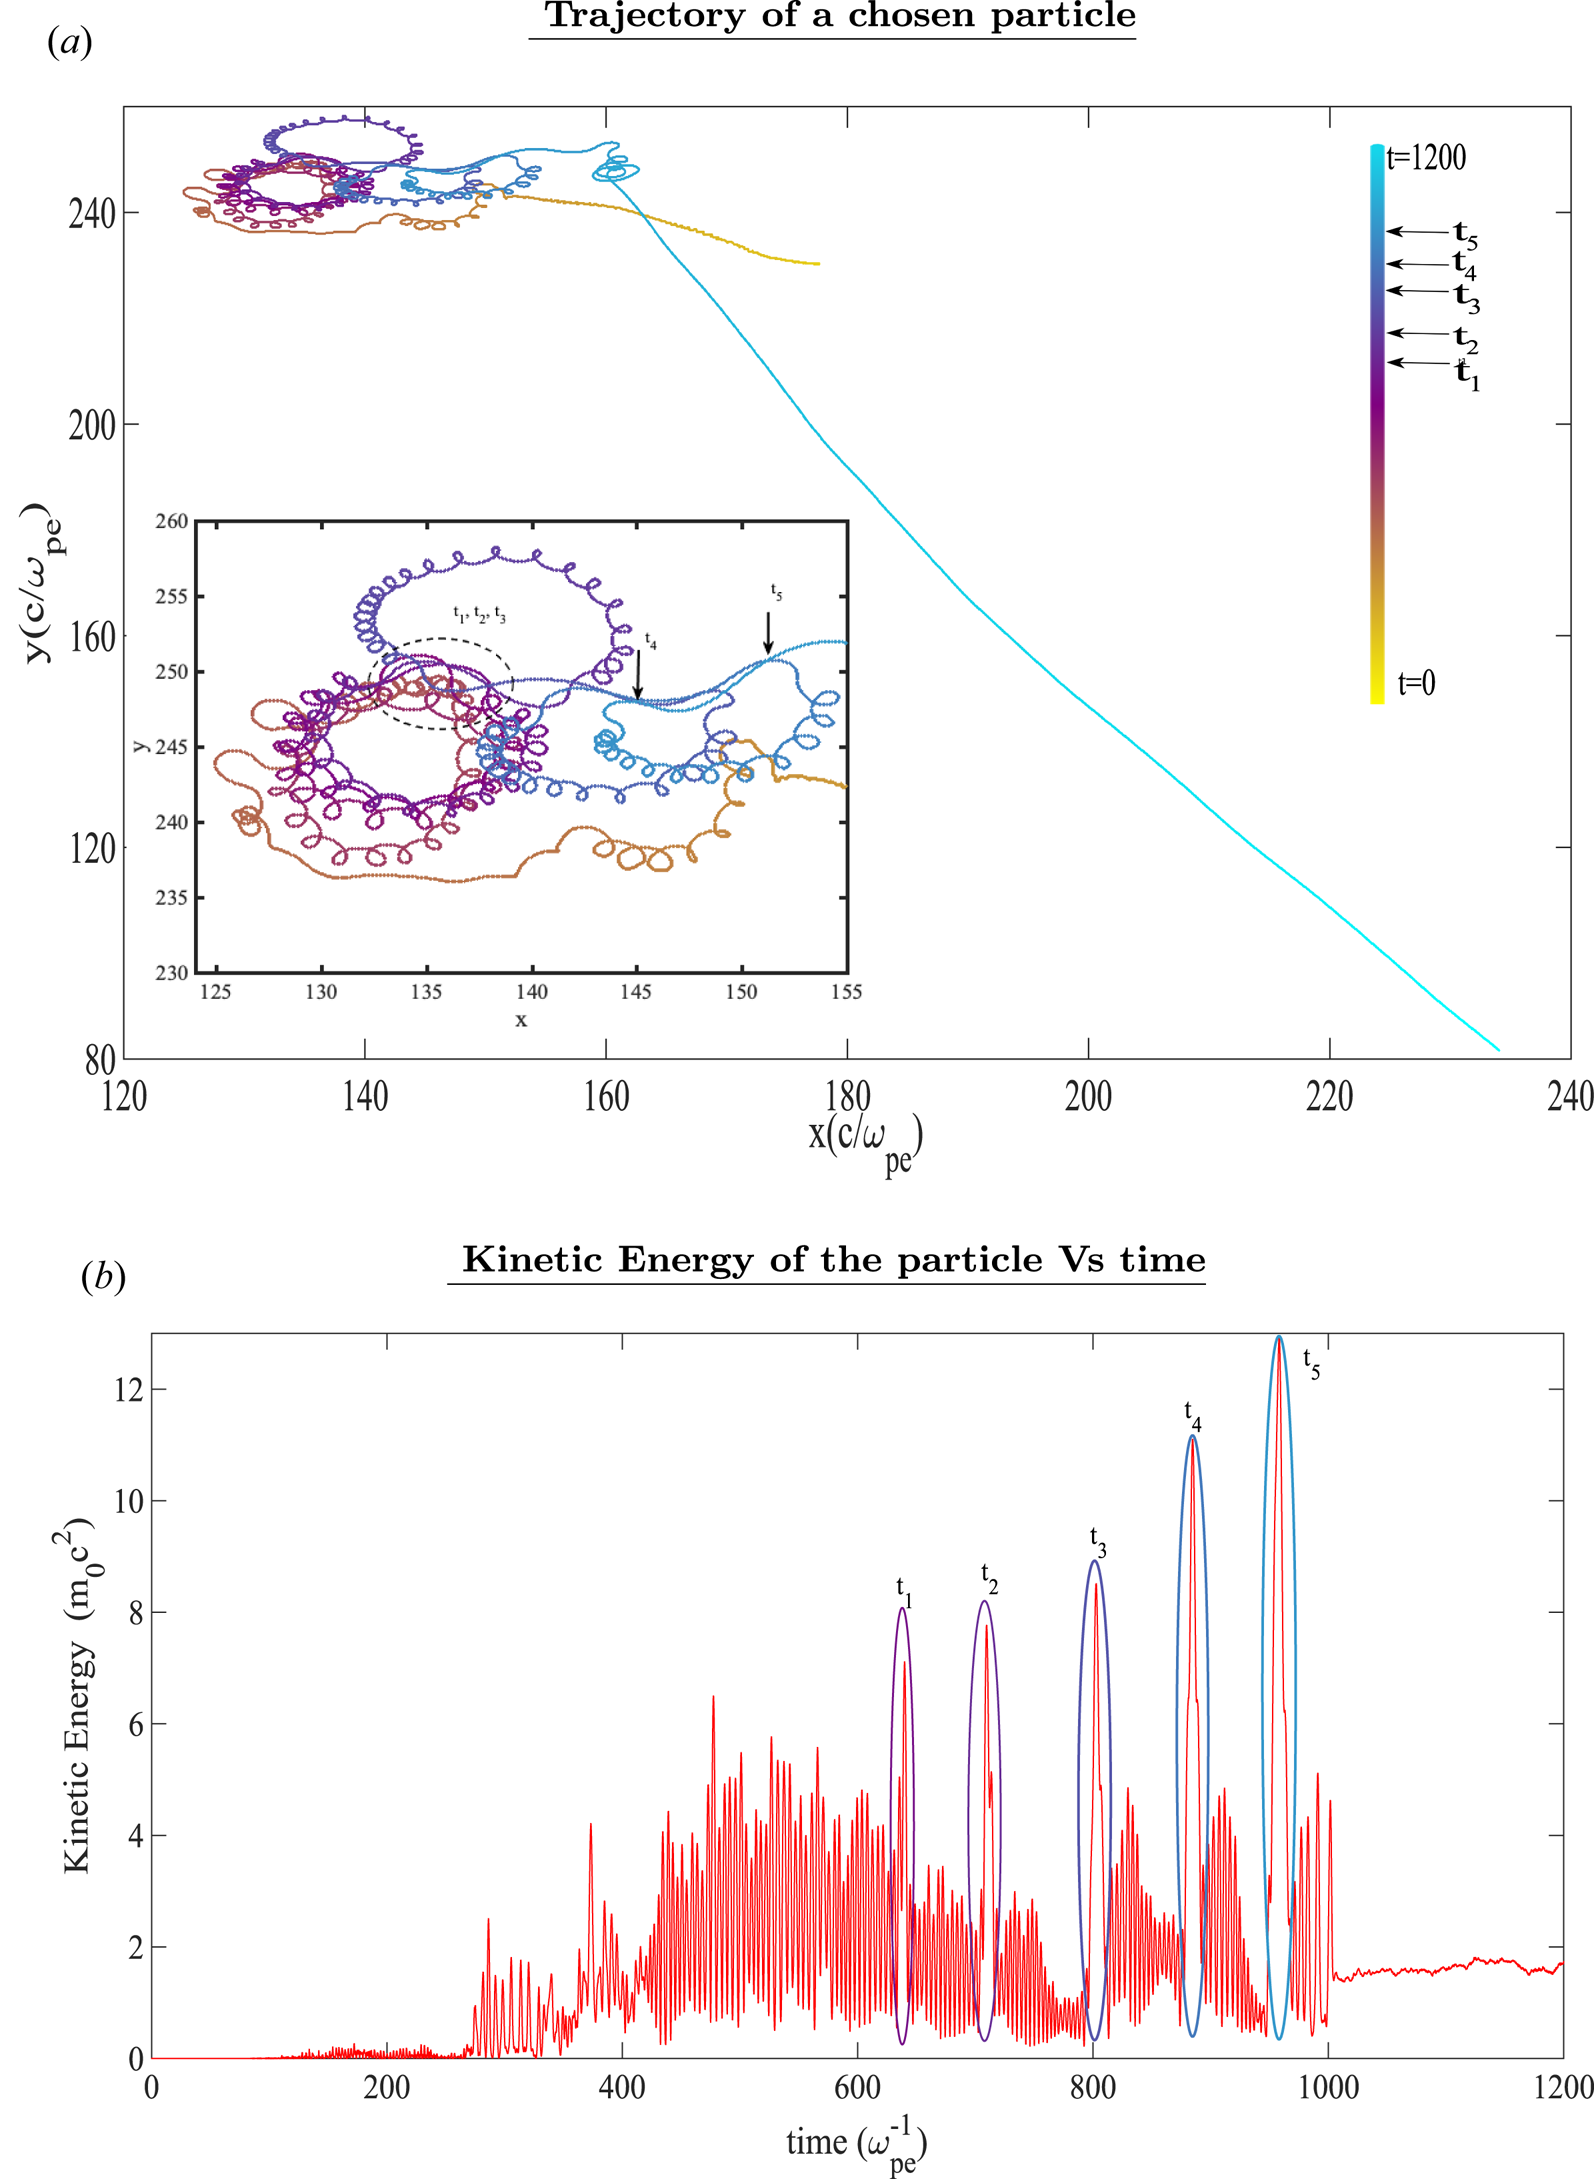
We would in this section like to understand and highlight some interesting particle level kinetic features associated with these structures. As the dipole propagates in the plasma medium, it continuously interacts with the background electrons which cross its path. While the topological identity of the dipole and monopole structure is seen to remain intact for a long time, we observe the trajectory of the electrons which cross the path of these structures in this section. We choose a set of electrons placed ahead of the dipolar structure and track their trajectories for case (B). The trajectory of one such particle and the evolution of its kinetic energy has been shown in figure 11. The particle gets entrained inside one of the lobes and moves under the influence of EM fields at that spatial location. The kinetic energy of the particle shows considerable oscillations. However, a steady increase in the kinetic energy of the tracked electron can clearly be discerned.
(a) Trajectory of a chosen particle; we choose one particle and trace its trajectory. At initial time, the particle is entrailed by dipole fields, but is ejected out from the dipole later. (b) Kinetic energy of the particle versus time; we show evolution of kinetic energy of the chosen particle. Here,  $t_1$,
 $t_2$,
 $t_3$,
 $t_4$ and
 $t_5$ are the instances of time when crossover of electron from one lobe of dipole to other lobe takes place. This exchange of electron position from one lobe to another results in the kinetic energy peak of the electron.

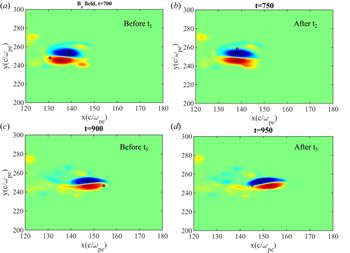
Occasionally, the particle is observed to cross over to the other lobe of the dipole. At each such crossing event, a sudden increase in the kinetic energy of the particle can be seen (indicated in figure 11b by timings  $t_1, t_2, t_3, t_4, t_5$, etc.). In figure 12, we have shown the location of the particle before and after these events and it can be seen that the particle has jumped from one location to another when such events occur. This can be understood by realising that as the particle crosses over from one lobe of the dipole to the other, it passes through a magnetic null. This is similar to the magnetic reconnection geometry where electron acceleration occurs (Parker Reference Parker1957; Zweibel & Yamada Reference Zweibel and Yamada2016).
Crossover of particle (shown in magenta colour) from one lobe to another is depicted here. We show particle position before and after the kinetic energy jumps shown in figure 11(b).

It has also been observed that the electrons after getting trapped in the structure ultimately get ejected from it with higher kinetic energy. Thereafter, the particle moves uninterrupted in the plasma. Ignoring the internal dynamics of the particles, the interaction of the dipole with the background electron appears to be like a collisional event in which the electron scatters off from a big effective particle moving towards it, thereby gaining energy in the process. This can be problematic for applications (e.g. fast ignition Tabak et al. Reference Tabak, Hammer, Glinsky, Kruer, Wilks, Woodworth, Campbell, Perry and Mason1994, Reference Tabak, Clark, Hatchett, Key, Lasinski, Snavely, Wilks, Town, Stephens and Campbell2005) where one wishes to transport a certain amount of energy with the help of these coherent dipolar structures for the purpose of sudden heating of a localized plasma region. These scattered energetic electrons may precede the arrival of the main structure in the deeper region of the plasma target (where one is aiming to dump the energy from the dipole) thereby disturbing it .
It is interesting to point out here that the magnetic dipole structures have also been considered for ion acceleration studies by some authors (Bulanov et al. Reference Bulanov, Dylov, Esirkepov, Kamenets and Sokolov2005; Park et al. Reference Park, Bulanov, Bin, Ji, Steinke, Vay, Geddes, Schroeder, Leemans and Schenkel2019). We have shown here the acceleration of electrons by interacting with these structures. However, given the random nature of these interaction these cannot be viewed as an efficient mechanism of electron acceleration.
5. Conclusions
We have simulated the interaction of an intense laser pulse with an overdense plasma medium. It is demonstrated that the relativistically intense laser energy gets absorbed and generates energetic electrons. Our simulation shows that when an appropriate choice of a laser pulse with finite transverse profile is made, the energetic electrons organize to spontaneously form vortex structures with currents leading to the formation of coherent magnetic structures. Unlike the exact solutions of the well known EMHD fluid model depicting the fast electron time scale phenomena in plasmas, these structures involve electrons rotating with relativistic speed inside a density cavity created self-consistently. The evacuated electrons are observed to accumulate at the periphery of these structures. The structures are found to be fairly robust. Despite their structural difference with EMHD solutions, it is shown that their dynamical traits are similar to the EMHD solutions.
The particle level kinetics is observed to be quite interesting for these structures. The background low energy electrons are observed to get trapped and some of them spend a considerable amount of time in them. The kinetic energy of the particles shows rapid oscillations as the particles rotate in the magnetic lobes. It is observed that as the particles jump from one lobe to another their kinetic energy suffers a sudden jump. It is also observed that the electrons ejected out of the structures have in general higher kinetic energy than the background electron particles.
Acknowledgements
The authors would like to acknowledge the OSIRIS Consortium, consisting of UCLA and IST (Lisbon, Portugal) for providing access to the OSIRIS4.0 framework which is the work supported by NSF ACI-1339893. A.D. would like to acknowledge her J.C. Bose fellowship grant JCB/2017/000055 and the CRG/2018/000624 grant of DST for the work. The simulations for the work described in this paper were performed on Uday, an IPR Linux cluster. D.M. and A.V. would like to thank Mr O. Samant and Dr S. Maity for fruitful discussions.
Editor Luís O. Silva thanks the referees for their advice in evaluating this article.
Declaration of interests
The authors report no conflict of interest.