INTRODUCTION
North Xinjiang is located in northwest China, in the eastern part of central Asia, far from oceanic moisture sources. The region is flanked by the Altai Mountains to the north and by the Tianshan Mountains to the south, and it has a pronounced continental climate. Moisture conditions in North Xinjiang currently depend strongly on glacier meltwater supply and are influenced by the westerlies, which transport moisture from the Atlantic Ocean, the eastern Mediterranean, the Black Sea, and the Caspian Sea (Aizen et al., Reference Aizen, Aizen, Melack, Nakamura and Ohta2001; Dai et al., Reference Dai, Li and Ma2006; Chen et al., Reference Chen, Chen, Huang, Chen, Huang, Jin and Jia2019; Guan et al., Reference Guan, Yang, Zhang and Li2019). The evolution of Holocene moisture conditions in North Xinjiang and the adjacent regions has been intensively reconstructed using various geological archives, such as sand dunes (Long et al., Reference Long, Shen, Tsukamoto, Chen, Yang and Frechen2014, Reference Long, Shen, Chen, Tsukamoto, Yang, Cheng and Frechen2017), loess (Li et al., Reference Li, Zhao, Dodson and Zhou2011; Chen et al., Reference Chen, Jia, Chen, Li, Zhang, Xie and Xia2016), stalagmites (Cheng et al., Reference Cheng, Zhang, Spotl, Edwards, Cai, Zhang and Sang2012; Cai et al., Reference Cai, Chiang, Breitenbach, Tan, Cheng, Edwards and An2017), peats (Hong et al., Reference Hong, Gasse, Uchida, Hong, Leng, Shibata and An2014), and lake sediments (Chen et al., Reference Chen, Yu, Yang, Ito, Wang, Madsen and Huang2008; Rudaya et al., Reference Rudaya, Tarasov, Dorofeyuk, Solovieva, Kalugin, Andreev and Daryin2009; An et al., Reference An, Lu, Zhao, Tao, Dong, Li and Jin2011a; Mathis et al., Reference Mathis, Sorrel, Klotz, Huang and Oberhänsli2014; Huang et al., Reference Huang, Peng, Rudaya, Grimm, Chen, Cao and Zhang2018). Several records, such as stalagmite-based δ18O data from Kesang cave in northwest China (Cheng et al., Reference Cheng, Zhang, Spotl, Edwards, Cai, Zhang and Sang2012; Cai et al., Reference Cai, Chiang, Breitenbach, Tan, Cheng, Edwards and An2017) and pollen-based moisture changes in high-altitude Lake Hoton-Nur (2080 m asl in the Altai Mountains) (Rudaya et al., Reference Rudaya, Tarasov, Dorofeyuk, Solovieva, Kalugin, Andreev and Daryin2009), indicate a decreasing trend of precipitation/moisture from the early to late Holocene, which has been attributed to the decreased penetration of the Asian monsoon into the region. Most well-dated lacustrine records from the region show a similar trend of increasing moisture status during the Holocene (Chen et al., Reference Chen, Chen, Huang, Chen, Huang, Jin and Jia2019), although the mechanism responsible is debated. For example, Herzschuh et al. (Reference Herzschuh, Cao, Laepple, Dallmeyer, Telford, Ni and Chen2019) emphasize that the position and orientation of the westerly jet was the main cause of Holocene rainfall patterns in North Xinjiang. Chen et al. (Reference Chen, Jia, Chen, Li, Zhang, Xie and Xia2016, Reference Chen, Chen, Huang, Chen, Huang, Jin and Jia2019) propose that the moisture-bearing westerlies dominated arid central Asia, including North Xinjiang, and thus the region was influenced by changes in the westerlies’ strength, which was determined by the insolation gradient between high and low latitudes. Rao et al. (Reference Rao, Huang, Xie, Shi, Zhao, Cao and Gou2019a, Reference Rao, Wu, Shi, Guo, Cao and Chen2019b) attribute the trend of increasing Holocene moisture recorded in low-altitude arid central Asia to increasing warm-season temperatures, which caused an increase in glacier meltwater supply to the adjacent low-altitude areas. However, few researchers have considered the potential importance of winter half-year precipitation, which contributes 45% of the annual precipitation in North Xinjiang but is subject to minimal evaporative losses (Wang, Reference Wang1994; Wang et al., Reference Wang, Cheng, Liu and Jiang2000).
Changes in the level of terminal lakes in semi-arid regions can reflect changes in the local moisture budget (Guiot et al., Reference Guiot, Harrison and Prentice1993; Qin and Yu, Reference Qin and Yu1998). The sediments of Wulungu Lake, a closed terminal lake fed mainly by the Wulungu River and supplied by the meltwater from snow and ice during the winter half-year, provide an opportunity to investigate changes in winter half-year precipitation and its controlling factors. In this study, we use grain-size and geochemical analyses of a well-dated sediment core (WLG10B) recovered from Wulungu Lake to reconstruct changes in winter half-year moisture conditions during the last 8000 years. Analysis of surface samples and Bayesian end-member modeling analysis (BEMMA) (Yu et al., Reference Yu, Colman and Li2016a) of the grain-size data are used to interpret the processes of sediment transport and thus characterize lake-level changes. Our overall aims are to provide more detailed information about moisture conditions and investigate the influence of precipitation seasonality in arid central Asia during the Holocene.
REGIONAL SETTING
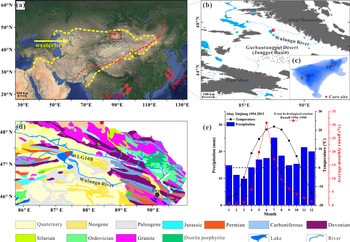
Wulungu Lake (46°59′–47°25′N, 87°00′–87°35′E; 479 m asl) is located between the Altai Mountains and the Gurbantunggut Desert/Junggar Basin in the Xinjiang Autonomous Region of China. It is a closed terminal lake fed mainly by the Wulungu River (Fig. 1a and b). In 2011, the lake had a maximum water depth of 18 m, with an average water depth of 8 m. The surface area at that time was 859 km2, and the catchment area was ~35,440 km2 (Fig. 1b and c) (Wu et al., Reference Wu, Ma and Zeng2013).
Regional setting of Wulungu Lake. (a) Dominant atmospheric circulation systems in Asia: the East Asian summer monsoon (EASM), South Asian summer monsoon (SASM), and the westerlies; the area enclosed by the yellow dash line is the westerlies-dominated climatic regime (Huang et al., Reference Huang, Chen, Zhang, Feng and Chen2015); the red dashed line indicates the modern Asian summer monsoon limit (Chen et al., Reference Chen, Holmes, Wuennemann and Yu2009); the red dot indicates Wulungu Lake. (b) Elevation diagram of the study area. (c) Bathymetry of Wulungu Lake (contours at 2-m intervals); the red dot indicates the location of core WLG10B (Wu et al., Reference Wu, Ma and Zeng2013). (d) Geologic map of the Wulungu Lake catchment from the Bureau of Geology and Mineral Resources of Xinjiang Uygur Autonomous Region (1993); the red dot indicates the location of core WLG10B; the black dot indicates the Ertai hydrological station. (e) Mean monthly temperature and precipitation for the nearby Altay meteorological station and the average monthly runoff for the Ertai hydrological station (Wang et al., Reference Wang, Cheng, Liu and Jiang2000; Nuerlan et al., Reference Nuerlan, Shen and Mahat2014); the black dashed line indicates 0 °C in air temperature. (For interpretation of the references to color in this figure legend, the reader is referred to the web version of this article.)

The Wulungu River rises in the eastern part of the Altai Mountains and flows 821 km in a generally westerly direction to Wulungu Lake (Fig. 1b and d). The river basin can be divided into a mountain area and an inner basin area, including piedmont plains by the Ertai hydrological station (Fig. 1d). The mountain area in the upstream direction of the Ertai station is the runoff formation zone, with surface runoff representing the total quantity of each river. The inner basin area is the runoff dissipation zone. The surface runoffs experience surface groundwater repeated conversion and are absorbed by the soil and vegetation through evaporation and transpiration after they enter the dissipation zone (Chen, Reference Chen2014). The Wulungu River has a maximum runoff from May to July, is fed mainly by melting winter snow and ice, and accounts for 73.6% of annual total runoff volume (Fig. 1e; data from the Ertai hydrological station, 1956–1998) (Wang et al., Reference Wang, Cheng, Liu and Jiang2000). As indicated by the comparison of lake-level changes and regional precipitation records from 1962–2006 (Fig. S1), the changes in the lake level followed the winter half-year precipitation (correlation coefficient r = 0.35) rather than the summer half-year (r = -0.03) or annual (r = 0.15) precipitation. The river is frozen from late October to April. The catchment in the runoff formation zone is underlain by granite, diorite porphyries, and Ordovician-Silurian-Devonian-Carboniferous volcanoclastic rocks, flysch, and limestone (Xu et al., Reference Xu, Ji, Zhao, Gong, Zhou, He and Zhong2013). The runoff dissipation zone is composed of Paleogene sandstone, Neogene mudstone, and Quaternary alluvium (Fig. 1d).
The modern climate of the region is dominated by the westerlies and is strongly continental, with a high amplitude of both diurnal and annual variation. The mean annual temperature is 4.3°C, ranging from -16.2°C in January to 21.9°C in July (Fig. 1e) (data from the Altay meteorological station, 36 km northeast of Wulungu Lake). Precipitation is relatively evenly distributed throughout the year, with a mean annual total of 192 mm, with 55% of it occurring as rainfall in the summer half-year (April–September) and 45% as snowfall in the winter half-year (October–March). The mean annual evaporation capacity (1724 mm) is much greater than the mean annual precipitation in the study area, resulting in strongly arid conditions and a modern lake salinity of 2.34 g/L (Wu et al., Reference Wu, Ma and Zeng2013). Owing to the warmer temperatures, evaporation during the summer half-year is greater than that in the winter half-year, accounting for 85% and 15% of the annual evaporation capacity, respectively (Wang, Reference Wang1994; Wang et al., Reference Wang, Cheng, Liu and Jiang2000). The main wind direction is from the northwest, and the maximum wind speed can reach 18.0–22.0 m/s (Liu et al., Reference Liu, Herzschuh, Shen, Jiang and Xiao2008).
MATERIALS AND METHODS
Sediment coring
In September 2010, two parallel sediment cores were recovered from the northeast part of Wulungu Lake (47°21′50.50″N, 87°27′7.20″E), in a water depth of 15.47 m, using a custom-built piston corer on a UWITEC platform (Fig. 1c). The corer is manufactured based on the principles of the Bolivia-type piston corer. Core WLG10B (used in this study) was 412 cm in sediment depth, and core WLG10C, which was 271 cm in sediment depth, was used for magnetic and carbonate analyses (Liu et al., Reference Liu, Xia, Zhou, Zhang, Zhao and Zhang2012). Two sections were collected using two different pistons from the studied core WLG10B. The first section was 280 cm in sediment depth and was collected using a self-made piston that was assembled with two rubber plugs (each measuring 60 mm in diameter), four steel plates (each measuring 58 mm in diameter), and a steel pin. The piston was locked to the bottom of a polycarbonate tube liner (3 m length x 60 mm diameter) with the steel pin and was attached to the platform with a steel cable. An approximate 1-cm-long space was reserved at the bottom of the tube before drilling to ensure the superior retention of upper watery sediments. The second section was 132 cm in sediment depth and was collected using a UWITEC 60-mm piston. Both sections of core WLG10B were split into two halves: one half was used for X-ray fluorescence (XRF) scanning, and the other half was subsampled at 1-cm intervals and freeze-dried for further investigation.
Geochemistry
The intact half-core was carefully flattened and then imaged with a line scan camera on an Avaatech XRF core scanner with a resolution of 140 ppcm (350 dpi); it was then covered with Ultralene plastic film (4 μm) and analyzed again using the same core scanner. Measurements were taken at 1-cm intervals, and separate scans at two voltages were made. One scan was performed at 1 mA, 10 s, no filter, and tube voltages of 10 kV (for Al, Si, K, Ca, Ti, Mn, Fe); a repeat scan was performed at 2 mA, 20 s, Pd-thick filter, 30 kV (for Rb, Sr, Zr). The X-ray illumination area was set at 1 cm in the downcore direction and 6 mm in the cross-core direction, and the scans were run down the center of the split core half. Element intensities from XRF core scanning are influenced by downcore changes in physical properties, the sample geometry, and enhancement and absorption effects (Tjallingii et al., Reference Tjallingii, Röhl, Kölling and Bickert2007; Weltje and Tjallingii, Reference Weltje and Tjallingii2008). Nonlinear functions exist between element intensities of XRF core scanning and element concentrations, whereas log-ratios of element intensities are linearly related to log-ratios of concentrations (Weltje and Tjallingii, Reference Weltje and Tjallingii2008). Hence, all the XRF core scanning element intensities in this research were transformed with a centered log-ratio (clr) using the R package “robCompositions” (Templ et al., Reference Templ, Hron and Filzmoser2011) to prevent misinterpretations. The clr-transformed Ca and Ti had very high estimated communality values (0.90 and 0.91, respectively) in a principal components analysis and thus were used to provide a geochemical characterization of core WLG10B.
The total organic matter (TOM) content was determined using weight loss-on-ignition measurements at 1-cm intervals. After drying at 105°C, 1–2 g of powdered samples were placed in a porcelain crucible and heated in a furnace at 550°C for two hours and then reweighed to calculate the weight loss (Heiri et al., Reference Heiri, Lotter and Lemcke2001).
Three samples from different lithological facies and samples from the lakeshore and the Wulungu River were used for X-ray diffraction (XRD) analysis using a PANalytical X'Pert Pro MPD (operating conditions: copper anode tube, kα [λ = 1.5406 Å], 40 mA, 40 kV) to aid the interpretation of sediment provenances. The diffraction pattern was collected from 5 to 75° (2 θ), with a scanning speed of 5° (2 θ)/min. The resulting diffractograms were then interpreted using the X'pert HighScore Plus software. With this program, the minerals were determined by comparing the position of the peaks with the theoretical d-value/2 θ degree of minerals commonly found in lake sediments.
Grain-size analysis
For grain-size analysis, the sediments were subsampled at 1-cm intervals and pretreated with 10% H2O2 to remove organic matter and then with 10% HCl to remove carbonates. Finally, the samples were rinsed with deionized water and dispersed with 10 ml of 0.05 mol/L (NaPO3)6 on an ultrasonic vibrator for 10 mins. Grain-size distributions (GSDs) between 0.02 μm and 2000 μm were measured using a Malvern Mastersizer 2000 laser grain-size analyzer and assigned to 100 size classes.
The GSDs of sediments can provide information on sediment source, depositional processes, and the sedimentary environment (Visher, Reference Visher1969; Qiang et al., Reference Qiang, Chen, Zhou, Xiao, Zhang and Zhang2007; He et al., Reference He, Zhao, Song, Liu, Chen, Zhang and Liu2015). The widely used traditional GSD parameters such as mean, median, standard deviation, kurtosis, and skewness are generally based on the analysis of a few percentile diameters of, rather than the entire, GSDs. In order to take full advantage of the entire GSDs, the primary GSDs of core WLG10B were transformed to unmixed end members (EMs) using BEMMA (Yu et al., Reference Yu, Colman and Li2016a). Within the framework of BEMMA, the number of EMs as well as the EM spectra and fractions can be inferred sequentially using a reversible-jump Markov Chain Monte Carlo algorithm in conjunction with Gibbs samplers. These EMs are believed to represent the sediment transport processes and thus are characteristic of typical depositional environments (Yu et al., Reference Yu, Colman and Li2016a; Zhang et al., Reference Zhang, Zhou, Zhang, Hao, Zhao and An2016).
RESULTS
Lithology and chronology
Core WLG10B is mainly composed of silty clay with occasional intercalated thin layers of silt or sand. The detailed lithology is as follows: gray sand (412–245 cm, 209–206 cm, and 174–165 cm); grayish silt (245–209 cm, 165–126 cm, and 18–0 cm); and dark gray silty clay (206–174 cm and 126–18 cm) (Fig. 2).
Photo scan, sediment lithology, Bayesian age-depth model, and mean grain-size profile of core WLG10B. The red dashed curve indicates the age-depth curve based on the weighted mean age for each depth. Calibrated radiocarbon dates with 2 sigma error bars are also presented. (For interpretation of the references to color in this figure legend, the reader is referred to the web version of this article.)

Fifteen bulk organic samples and one charcoal sample were collected for 14C dating by accelerator mass spectrometry (AMS) at Beta Analytic, Inc. The dating of bulk organic matter (BOM) may be influenced by the reservoir effect and result in old radiocarbon ages of samples (Yu et al., Reference Yu, Cheng and Hou2014). Comparison of the 14C age of charcoal from the depth of 206 cm (4390 ± 40 14C yr BP) with that of BOM at the depth of 207 cm (5220 ± 40 14C yr BP) suggests that the radiocarbon age of BOM exceeds the true age by 820 yr (Fig. 2). We thus used a reservoir effect in the northeast of Wulungu Lake of 800 yr to correct the radiocarbon ages on BOM. This reservoir age is consistent with that estimated in a previous study based on 210Pb/137Cs profiles, which indicated that the reservoir effect in the center of Wulungu Lake is 760 yr (Liu et al., Reference Liu, Herzschuh, Shen, Jiang and Xiao2008). The five 14C ages for the lower part of the core (~412–245 cm) are similar (~5000 14C yr BP) (Table 1). Notably, the grain size of this interval is very coarse (>100 μm), and the sediments are poorly sorted (Fig. 2). These samples likely represent fast deposition, which may imply a fluvial delta developed near the drilling site. Therefore, the present study focuses on the depth interval of 0–245 cm, which mainly consists of lacustrine deposits (Fig. 2).
AMS 14C dates and calibrated ages from Wulungu Lake (core WLG10B), Xinjiang, China.

* Rejected.
a Reservoir effect of 800 yr has been subtracted.
The estimated reservoir age of 800 yr was subtracted from the upper nine AMS 14C ages, except for the charcoal sample (206 cm, Beta-292376) (Table 1). The age at the bottom of the studied interval (245 cm, Beta-292379) was also exempt from the reservoir effect because the lake level was very shallow, and its organic matter was from emergent plant and terrestrial plant input (Jiang et al., Reference Jiang, Shen, Liu, Zhang and Xiao2007; Liu et al., Reference Liu, Herzschuh, Shen, Jiang and Xiao2008). The low δ13C value (-28‰) of the bottom sample also supports the terrestrial-origin organic matter (O'Leary, Reference O'Leary1988). The reservoir-corrected 14C ages at depths of 109 cm and 179 cm are older than the age of the charcoal sample (206 cm) (Fig. 2, Table 1). Therefore, the ages of the two samples (from depths of 109 cm and 179 cm) were excluded from the age model. All dates were calibrated using the IntCal13 calibration curve (Reimer et al., Reference Reimer, Bard, Bayliss, Beck, Blackwell, Ramsey and Buck2013). The age-depth model was determined using Bacon version 2.2, a Bayesian modeling of accumulation rates (Blaauw and Christen, Reference Blaauw and Christen2011), and implemented using R software. Based on this model, calibrated dates and their 95% confidence interval were calculated for the boundaries of the stratigraphic sections (Fig. 2). The sediment accumulation rate is relatively low in the lower part of core WLG10B (average sediment accumulation rate of 0.29 mm/yr from ~245 to 226 cm and 0.09 mm/yr from ~226 to 208 cm), with 0.38 mm/yr from ~206 to 80 cm, an increase to 0.54 mm/yr from 80 to 29 cm, and 0.31 mm/yr from ~29 cm to the top of the core.
GSDs of the sediments from core WLG10B and surface samples
The samples from core WLG10B have relatively similar GSDs, with most samples having a modal grain size of ~11 μm (fine silt), while a few samples have additional peaks at ~40 μm (coarse silt) or between 300 and 800 μm (sand) (Fig. 3a). Three types of GSDs are distinct (Fig. 3c–e): type 1 is bimodal, with a dominant peak at 410 μm (sand) and a minor peak at ~8 μm (silty clay); type 2 is also bimodal but with a major peak at ~9 μm (silty clay) and a small peak at ~40 μm (coarse silt); and type 3 has an asymmetrical distribution, with a mode of ~11 μm (fine silt). Type 1 (sand) accounts for only 2% of the upper 2.45 m of core WLG10B, while type 2 (coarse silt) and type 3 (silty clay) represent ~20% and ~78% of all samples, respectively.
Grain-size distributions (GSDs) of samples from core WLG10B and surface sediments from the Wulungu Lake area, and the Bayesian end-member modeling analysis (BEMMA) spectra. (a) GSDs for the upper 245 cm of core WLG10B from Wulungu Lake (light gray curves), including the maximum, minimum, and median for each grain-size class. (b) GSD curves for surface sediments from the Wulungu River (black dashed curve), lakeshore sample (black curve), aeolian dust trapped near the ground surface in the Wulungu Lake area (red curve) (Liu et al., Reference Liu, Herzschuh, Shen, Jiang and Xiao2008), and center of Wulungu Lake (blue curve). (c–e) The three types of GSD in core WLG10B (gray curves), including representative examples (colored curves). (f) BEMMA spectra. (For interpretation of the references to color in this figure legend, the reader is referred to the web version of this article.)

The surface sediments from the center of Wulungu Lake have a unimodal distribution, with a peak at ~11 μm. Dust trapped in the Wulungu Lake area has a slightly bimodal GSD, with a dominant peak at ~58 μm and a minor peak at ~6 μm (Liu et al., Reference Liu, Herzschuh, Shen, Jiang and Xiao2008). Sand from the Wulungu River and the lakeshore has a similar symmetrical unimodal distribution, with a peak at ~450 μm; however, the GSD of the lakeshore sediments is much narrower and has a higher kurtosis (Fig. 3b).
Grain-size EMs of core WLG10B
Changes in GSDs are often used to infer the provenance, transport, and deposition mechanisms of sediments (McLaren and Bowles, Reference McLaren and Bowles1985; Weltje and Prins, Reference Weltje and Prins2003; Sun et al., Reference Sun, Bloemendal, Rea, An, Vandenberghe, Lu and Su2004). The grain size of lake sediments is related to the transport capacity of regional winds and inflows entering the lake (Liu et al., Reference Liu, Herzschuh, Shen, Jiang and Xiao2008; An et al., Reference An, Lu, Zhao, Tao, Dong, Li and Jin2011a, Reference An, Zhao, Tao, Lv, Dong, Li and Jin2011b). For core WLG10B, unmixing of the GSDs yielded an optimal model with three EMs (Fig. 3f). EM 1 has a bimodal peak, with a larger peak at 462 μm and a smaller peak at ~25 μm. The larger peak of EM 1 is in accordance with distribution type 1. EM 2 is also bimodal and resembles type 2, with a dominant peak at ~6 μm (silty clay) and a minor peak at ~40 μm (coarse silt). EM 3 has a similar structure to type 3, with a dominant mode at ~11 μm.
Sedimentary mineralogy
The diffractograms of representative samples from core WLG10B show that they are composed primarily of quartz and calcite, with minor amounts of microcline and clay minerals (illite and clinochlore) (Fig. 4). Of the three major lithologies, the gray sand sample (GSD type 1) is characterized by a high concentration of quartz and microcline, with a maximum peak intensity of 18,934 and 6081, respectively. The grayish silt sample (GSD type 2) has the highest calcite content of the three samples, with a maximum peak intensity of 8450. The diffractogram of the dark gray silty clay sample (GSD type 3) shows a similar pattern to that of type 2 but with few microcline and lower calcite. The Wulungu River and lakeshore sediments have essentially the same mineralogy, being composed mainly of quartz.
(color online) X-ray diffraction patterns showing the intensity of diffracted X-rays in planes as a function of 2 θ for three representative samples from core WLG10B, Wulungu River sediments, and shoreline sediments of Wulungu Lake C = calcite, Ch = clinochlore, I = illite, M = microcline, Q = quartz. The Miller indices (hkl) of identified minerals are also shown above the peaks.

Stratigraphic variation of EM proportions, TOM content, Ca, and Ti
Depth series of the EM proportions are plotted in Figure 5. EM 1 is recorded only in the few layers consisting of gray sand: 208–206 cm and 177–165 cm; the average downcore abundance is 46%. EM 2 dominates the grayish silt lithology, and the average downcore abundance is 42%. High values of EM 3 occur in the dark gray silty clay intervals, and the average downcore abundance is 48%.
(color online) Sedimentary units with the photo scan and lithology, end-member (EM) values (original data are plotted in light gray, with a 5-point running mean plotted as the thicker blue curve), total organic matter (TOM) content, centered log-ratio (clr)–transformed Ca and Ti for core WLG10B, and carbonates from core WLG10C.

TOM content is used as a proxy for bioproductivity, as organic matter has been shown to originate primarily from lacustrine algae in Wulungu Lake (Liu et al., Reference Liu, Herzschuh, Shen, Jiang and Xiao2008). TOM varies from 1.25 to 8.65%, with a mean of ~4.57%. The depth variations are similar to those of EM 3, with low values in the lower part of the core and higher values in the upper part (Fig. 5). High values of TOM content occur in the dark gray silty clay layers (~4.77%), while the grayish silt has a slightly lower TOM content (~4.09%).
Ca can be used to quantify the carbonate content (Santisteban et al., Reference Santisteban, Mediavilla, López-Pamo, Dabrio, Zapata and García2004). As revealed by microscopic analysis of carbonate particles for Liu et al. (Reference Liu, Herzschuh, Shen, Jiang and Xiao2008), carbonate particles in core WLG-2004 (a 223-cm-long sediment core from the central part of the lake) were small (10–15 μm long) and well-preserved idiomorphic crystals, which indicates an authigenic carbonate origin. As was demonstrated in the previous study (Liu et al., Reference Liu, Herzschuh, Shen, Jiang and Xiao2008), carbonate precipitation in Wulungu Lake is related to increasing temperature; from this, we can infer that the Ca record reflects authigenic carbonate precipitation, which may be thus influenced by changes in the water balance and temperature. The variations in clr-transformed Ca show low values in the lower part and top part of the core (intervals of 245–209 cm and 70–0 cm, respectively) and a high value in the middle part (209–70 cm).
Ti is a conservative element that is mainly sourced from land-derived materials (Zhang et al., Reference Zhang, Zhao, Xue, Liu, Yu, Chen and Shen2017). The downcore variations in Ti are closely related to changes in lithology, with higher values in the grayish silt layers and lower values in the dark gray silty clay layers.
On the basis of variations in the grain-size EM proportion (EM 1, EM 2, and EM 3), TOM content, and clr-transformed Ca and Ti, the core can be divided into four statistically distinct intervals using CONISS analysis, which was implemented in Tilia 1.7.16 (Fig. 5). The characteristics of these units are as follows:
Unit I (245–209 cm; 8000–5350 cal yr BP) is dominated by gray sand, which is characterized by relatively high values of EM 2 (33%–82%, with an average of 69%) and Ti and a low proportion of EM 3 (mean of 26%) and TOM content (3.30–5.29%, average of 4.25%).
Unit II (209–126 cm; 5350–3200 cal yr BP) is dominated by dark gray silty clay and grayish silt, occasionally intercalated with thin layers of gray sand. This unit has very variable proportions of EM 2 (4%–81%, average of 46%), EM 3 (2%–76%, average of 40%), and TOM content (1.25–8.65%, average of 4.73%). The unit can be divided into two subunits: Subunit IIa (209–165 cm; 5350–4080 cal yr BP) is characterized by the highest counts of Ca and a relatively high TOM content (3.92–8.65%, mean of 6.14%); an abrupt event is present in the upper part (177–165 cm; 4370–4080 cal yr BP), where the EM 1 values increase sharply and the lithology changes from dark gray silty clay to gray sand. Subunit IIb (165–126 cm; 4080–3200 cal yr BP) is dominated by gray sand with high values of EM 2 (mean of 52%) and Ti values. However, the TOM content and Ca decrease significantly compared to subunit IIa.
Unit III (126–18 cm; 3200–500 cal yr BP) is dominated by dark gray silty clay with high values of EM 3 (average of 61%). EM 3 and TOM content increase gradually from the bottom to the top. Ca first increases to the highest level within the unit and then steadily decreases to the lowest level within the core. Two subunits can be defined: Subunit IIIa (126–70 cm; 3200–1650 cal yr BP) is characterized by high Ca and low Ti. Subunit IIIb (70–18 cm; 1650–500 cal yr BP) has the highest proportion of EM 3 within the core (up to 78%), although there is an abrupt event between 970 and 670 cal yr BP (34–22 cm) where TOM content and Ca decrease abruptly.
Unit IV (18–0 cm; 500–50 cal yr BP) is dominated by gray sand. There is a decreasing trend in TOM content, while the proportion of EM 3 first decreases steadily and then continues to increase to the top of the core.
DISCUSSION
Interpretation of the grain-size EMs
Comparing the GSDs of representative samples from core WLG10B and regional surface sediments shows that type 1 has a similar distribution to the GSD of sand from the Wulungu River and lakeshore sediments (Fig. 3). As indicated by the mineral content, type 1 has a high content of quartz and microcline, which is also similar to the river and lakeshore sediments (Fig. 4). According to the results of a previous study (Zhang et al., Reference Zhang, Zhou, Zhang, Hao, Zhao and An2016), quartz, clays, and feldspars are mostly detrital inputs supplied to Wulungu Lake from the drainage basin by seasonal runoff and the Wulungu River. The site of core WLG10B has a deep water depth and is far from the Wulungu River estuary; coarse sediments are difficult to deposit in the area unless the lake is shallow. Therefore, the gray sand samples (type 1) may indicate the intensity of surface runoff in a dry environment with a low lake level.
Type 2 has a minor peak of ~40 μm, which coincides with that of aeolian dust trapped in the Wulungu Lake area (Fig. 3). In addition, the GSDs of surface sediments from the dry lakebeds of Lake Manas (152 km southwest of Wulungu Lake), which were a mix of lacustrine sediment and dust deposits, also showed a slightly bimodal GSD, with a dominant peak at ~6 μm and a minor peak at ~30 μm (Yang et al., Reference Yang, Yue and Li2008) (a similar distribution with type 2 and our EM 2 result) (Fig. S3). Notably, the abundance of EM 2 (with a similar spectrum distribution of type 2; Fig. 3d and f), detrended clr-transformed Ti (used as a proxy of aeolian inputs; Yancheva et al., Reference Yancheva, Nowaczyk, Mingram, Dulski, Schettler, Negendank and Liu2007; Yu et al., Reference Yu, Zhang, Zhang, Wang, Ji, Peng and Gao2016b), and the sand dune dust records from the Balikun Basin (Ji et al., Reference Ji, Wang, Yang, Li, Xu and Liu2019) exhibit consistent variations during the last 8000 years (Fig. S4). Therefore, we infer that type 2 reflects the intensity of aeolian transport.
The GSD of type 3 is similar to that of surface sediments from the center of Wulungu Lake where the water is deep. This kind of distribution represents the long-term suspension fine component in lake sediments (Xiao et al., Reference Xiao, Fan, Zhou, Zhai, Wen and Qin2013) and reflects gravitational settling from the lake water column in deep water (Sheng and Lick, Reference Sheng and Lick1979; Chikita et al., Reference Chikita, Jha and Yamada2001). Therefore, we infer that type 3 reflects gravitational settling from the lake water column, which is controlled by lake-level fluctuations. This interpretation is supported by other proxies in the same core and by independent sedimentary records from the center of Wulungu Lake (Liu et al., Reference Liu, Herzschuh, Shen, Jiang and Xiao2008; Qian et al., Reference Qian, Jiang and Ren2014). For example, the depth variation of clr-transformed Ca, which reflects the water balance and temperature, is inversely related to that of EM 3 (with the same spectrum distribution of type 3) (Fig. S5a and b). The illite record from the center of Wulungu Lake, which indicates a dry environment in the Wulungu River catchment (Qian et al., Reference Qian, Jiang and Ren2014) (Fig. S5d), is also inversely related to the changes in EM 3. As reported by Liu et al. (Reference Liu, Herzschuh, Shen, Jiang and Xiao2008), the reconstructed wetland biome could indicate lake-level fluctuation (Fig. S6a) because “wetland” taxa (e.g., Sparganium, Poaceae, Tamarix, and Juglans) are indicative of low lake levels when the core site was situated close to the lakeshore. The downcore variations of EM 3 are similar to the variations of a low-resolution, lake-level record based on the changes of pollen biomes from the same lake (Liu et al., Reference Liu, Herzschuh, Shen, Jiang and Xiao2008) (Figs. 6b and S6b). In summary, based on the GSDs of the EMs, representative samples and regional surface sediments (Figs. 3 and S3), and the downcore variations of the proxies (Figs. 5 and S4–S6), we infer that EM 1 represents runoff intensity in shallow lake water, EM 2 indicates the intensity of aeolian transport, and EM 3 indicates changes in the lake level.
Evolution of moisture conditions in the Wulungu Lake area in the last 8000 years
Lake-level changes in runoff-dominated closed-basin lakes in semi-arid regions essentially reflect changes in the local moisture budget if nonclimatically related factors (e.g., natural infilling, tectonic activity, and anthropological impacts) can be excluded (Guiot et al., Reference Guiot, Harrison and Prentice1993; Qin and Yu, Reference Qin and Yu1998). Wulungu Lake is a deep, closed terminal lake fed mainly by the Wulungu River. It is situated in the Wulungu depression, next to the Irtysh fault zone in the north (Mao, Reference Mao1981; Li et al., Reference Li, He and Tang2016). Tectogenesis during the Quaternary in the Wulungu depression has led to Wulungu Lake basin subsidence of the Altay mountain range (Mao, Reference Mao1981). Approximately 3–5 m of subsidence, as indicated by the lower terrace in the Wulungu and Irtysh Rivers, occurred in the basin area during the Holocene (Yan and Xia, Reference Yan and Xia1962; Mao, Reference Mao1981). In consideration of our coring sediment (the 2.45-m depth during the last 7200 years), natural infilling and tectonic activity have had minimal impact on the water depth of Wulungu Lake during the timescale of interest in this study. Anthropogenic influences on the lake level were also minimal prior to 500 cal yr BP, when during the late Ming and early Qing dynasties (~AD 1600–1760), military reclamation began to play an important role in the local economy (Qian, Reference Qian1997; Liu et al., Reference Liu, Herzschuh, Shen, Jiang and Xiao2008). Therefore, we conclude that our multiproxy dataset provides a reliable high-resolution record of hydroclimatic changes in the region over the past 8000 years, with higher proportions of the EM 3 grain-size component reflecting a higher lake level and thus increased effective humidity.
Over the last 8000 years, the record from Wulungu Lake (EM 3) shows a persistent trend toward increasing moisture. Four major stages in the lake level/moisture can be discerned: (1) a low lake level with a dry environment from 8000 to 5350 cal yr BP; (2) an increasing lake level/moisture with high fluctuations between 5350 and 3200 cal yr BP; (3) the wettest stage, with a high lake level appearing at 3200–500 cal yr BP; and (4) the lake level starts dropping at 500 cal yr BP and may be the result of human activities (Qian, Reference Qian1997; Liu et al., Reference Liu, Herzschuh, Shen, Jiang and Xiao2008). The overall increasing moisture trend is supported by other paleoclimatic records from Xinjiang, such as the synthesized pollen-based moisture record from five lakes in Xinjiang Province (Wang et al., Reference Wang, Feng, Ran and Zhang2013) (Fig. 6c), the pollen-based annual precipitation record from Kanas Lake (1365 m asl) in the Altai Mountains (Huang et al., Reference Huang, Peng, Rudaya, Grimm, Chen, Cao and Zhang2018), a series of multiproxy moisture records from different loess-paleosol sequences in the Tianshan Mountains (Chen et al., Reference Chen, Jia, Chen, Li, Zhang, Xie and Xia2016; Jia et al., Reference Jia, Liu, Gao and Xia2018) (one of these loess-paleosol sequences, LJW10, is shown in Fig. 6d), multiproxy studies of dunes in the Bayanbulak Basin in the central Tianshan Mountains (Long et al., Reference Long, Shen, Tsukamoto, Chen, Yang and Frechen2014, Reference Long, Shen, Chen, Tsukamoto, Yang, Cheng and Frechen2017), and precipitation records based on the δ13C of plant cellulose from the Chaiwobu peatland in the syncline belt of the northern Tianshan Mountains (Hong et al., Reference Hong, Gasse, Uchida, Hong, Leng, Shibata and An2014).
Comparison of global and regional paleoclimatic records during the last 8000 years. From left to right: (a) EM 3 of core WLG10B, which indicates moisture changes (original data are plotted in light gray, with a 5-point Savitzky-Golay smooth plotted as the thicker blue curve). (b) Lake-level changes in Wulungu Lake (Liu et al., Reference Liu, Herzschuh, Shen, Jiang and Xiao2008). (c) Moisture index in North Xinjiang (Wang et al., Reference Wang, Feng, Ran and Zhang2013). (d) χARM/SIRM record in the LJW10 section of the Xinjiang loess (Chen et al., Reference Chen, Jia, Chen, Li, Zhang, Xie and Xia2016). Winter precipitation (e), Summer precipitation (f) (original data are plotted in light gray, with a 10-point running mean plotted as the thicker olive and red curve, respectively), and spring (March–May) surface temperature history for the core area of ACA (g) (Liu et al., Reference Liu, Otto-Bliesner, He, Brady, Tomas, Clark and Carlson2009). (h) Winter (November–February) insolation at 45°N (in W/m2) (Laskar et al., Reference Laskar, Fienga, Gastineau and Manche2011). (i) Winter insolation gradient between 35°N–55° (Chen et al., Reference Chen, Jia, Chen, Li, Zhang, Xie and Xia2016). (For interpretation of the references to color in this figure legend, the reader is referred to the web version of this article.)

However, other studies have reported a trend of decreasing Holocene moisture in the Xinjiang region and adjacent areas, such as a pollen-based precipitation reconstruction from Hoton-Nur Lake (2080 m asl) in the Mongolian Altai (Rudaya et al., Reference Rudaya, Tarasov, Dorofeyuk, Solovieva, Kalugin, Andreev and Daryin2009; Rudaya and Li, Reference Rudaya and Li2013) and a palynological investigation in the Yili Valley (Li et al., Reference Li, Zhao, Dodson and Zhou2011). These records are situated at high elevation, and as discussed by Rao et al. (Reference Rao, Huang, Xie, Shi, Zhao, Cao and Gou2019a), the decreasing trend of Holocene moisture recorded in the high-altitude area of central Asia could be a result of the shrinking of the adjacent high-altitude mountain glaciers, caused by increasing warm-season temperatures (Rao et al., Reference Rao, Huang, Xie, Shi, Zhao, Cao and Gou2019a; Shi et al., Reference Shi, Rao, Cao, Huang, Wu, Yang and Sun2019). In addition, glacier ablation during the Holocene could have resulted in greatly increased fluvial recharge to low-altitude areas and thus an increase in the status of moisture conditions in these areas (Huang et al., Reference Huang, Peng, Rudaya, Grimm, Chen, Cao and Zhang2018; Rao et al., Reference Rao, Huang, Xie, Shi, Zhao, Cao and Gou2019a). However, low-altitude lakes, such as Wulungu Lake (479 m asl), fed mainly by meltwater from the winter half-year snow rather than by glaciers, also show a trend of increasing moisture during the Holocene. Therefore, we propose that it is temperature that mainly influences the alpine areas fed largely by glacier meltwater. The increasing warm-season temperatures in the Holocene have resulted in a drying trend in high-altitude areas but a wetting trend in low-altitude areas (Rao et al., Reference Rao, Wu, Shi, Guo, Cao and Chen2019b). For the areas with no glacier-derived water sources, the moisture conditions may have been controlled by precipitation during the winter half-year.
Possible westerlies’ winter-precipitation control of moisture conditions in North Xinjiang during the last 8000 years
The moisture record (EM 3) from Wulungu Lake is strikingly consistent with a simulation of changes in regional winter precipitation and spring surface temperature based on the TraCE-21ka dataset (simulation of transient climate evolution over the last 21,000 years) (Fig. 6e and g; Liu et al., Reference Liu, Otto-Bliesner, He, Brady, Tomas, Clark and Carlson2009); however, our record is much less consistent with the simulated record of summer precipitation (Fig. 6f). In this model, winter precipitation tracks gradual changes in boreal winter insolation (Fig. 6h) and its gradient between middle and high latitudes (Fig. 6i). As discussed by Chen et al. (Reference Chen, Jia, Chen, Li, Zhang, Xie and Xia2016), moisture conditions in North Xinjiang are strongly influenced by the westerlies. The increasing trend of boreal winter insolation could have enhanced the evaporation rate in the region upwind of North Xinjiang, such as the North Atlantic, which supplies 76% of the winter precipitation in the Altai region (Aizen et al., Reference Aizen, Aizen, Joswiak, Fujita, Takeuchi and Nikitin2006). In addition, winter insolation at mid-latitudes increased faster than that at high latitudes, causing a generally increased insolation gradient in the last 8000 years (Fig. 6i). The positive anomaly of boreal winter insolation would increase the temperature gradient between low and high latitudes and strengthen the westerlies (Jin et al., Reference Jin, Chen, Morrill, Otto-Bliesner and Rosenbloom2012). The increase in the intensity of the westerlies’ circulation, which would have enhanced its capacity to supply water vapor, coupled with the increasing evaporation, would have resulted in the greatly increased supply of moisture from the North Atlantic and other sources in the region upwind of North Xinjiang to the study area. This hypothesis explains the increasing trend of winter moisture conditions during the last 8000 years. The increasing spring surface temperature (Fig. 6g) may accelerate the melting of accumulated winter snow and ice, enhance the runoffs, and thus increase the lake level.
Superimposed on the long-term trend, our records clearly show several centennial-scale dry events (Fig. 6a) that coincide with intervals of ice-rafted debris (IRD) events in the North Atlantic (Bond et al., Reference Bond, Kromer, Beer, Muscheler, Evans, Showers and Hoffmann2001) (Fig. S7a) and low total solar irradiation (Steinhilber et al., Reference Steinhilber, Abreu, Beer, Brunner, Christl, Fischer and Heikkilä2012) (Fig. S7b). These dry events potentially support our hypothesis on a centennial timescale. The minima in solar activity (Fig. S7b; Steinhilber et al., Reference Steinhilber, Abreu, Beer, Brunner, Christl, Fischer and Heikkilä2012) would have induced the cooling of the high northern latitude atmosphere (and thus increases in IRD) and North Atlantic sea surface temperature and also caused a slight southward shift of the westerlies (Bond et al., Reference Bond, Kromer, Beer, Muscheler, Evans, Showers and Hoffmann2001). The cooler air temperatures, which would have reduced the evaporation rate of water bodies upwind of North Xinjiang, coupled with the southward displaced westerlies, led to the dry events in the study area (Liu et al., Reference Liu, Rao, Shen, Liu, Chen, Chen and Wang2019).
CONCLUSIONS
We have obtained an 8000-year multiproxy record of lake level variations from a closed terminal lake in North Xinjiang, in which the water is mainly supplied by snow and ice meltwater of the winter half-year. The record reveals that during the last 8000 years in North Xinjiang, in areas with no glacier meltwater supply, moisture conditions were related to changes in winter precipitation. The increasing trend of moisture conditions in the study area was caused by increasing regional winter precipitation. This finding supports the hypothesis that boreal winter insolation and its gradient between middle and high latitudes had an important influence on the hydroclimate in North Xinjiang and even in arid central Asia.
ACKNOWLEDGMENTS
This study was supported by the National Key Research & Development Program of China (2018YFA0606401, 2017YFA0603402) and the State High-End Project (GDW20176200070).
SUPPLEMENTARY MATERIAL
The supplementary material for this article can be found at https://doi.org/10.1017/qua.2020.94