





1. Introduction
The rising prominence of Environmental, Social, and Governance (ESG) factors has heightened the scrutiny of corporate conduct across global markets. Incidents such as environmental disasters, labor rights violations, corruption scandals, or governance failures increasingly attract public attention and pose material risks to firms, investors, and regulators. Monitoring and predicting such ESG incidents have therefore become a crucial component of sustainable finance and corporate risk management. Unlike ESG ratings, which are issued periodically, ESG incident data capture real-time adverse events and their repercussions.
The bulk of academic literature has grown rapidly around ESG ratings, their explainability and divergence, and the link to the financial performance (Berg et al., Reference Berg, Kölbel and Rigobon2022; Friede et al., Reference Friede, Busch and Bassen2015). While numerous studies employed a battery of machine learning techniques to explain and predict ESG ratings (D'Amato et al., Reference D'Amato, D'Ecclesia and Levantesi2021), there are very few studies on the prediction of ESG controversies themselves (Zheng & Yan, Reference Zheng and Yan2022). Recent contributions show that country-level controversy indices, corporate governance responses, environmental regulation, and takeover pressure all shape ESG controversies (Beckmann & Rogmann, Reference Beckmann and Rogmann2024; Burke, Reference Burke2022; Muhammad & Aman, Reference Muhammad and Aman2026; Treepongkaruna et al., Reference Treepongkaruna, Kyaw and Jiraporn2024). Existing studies employ firm-level financial characteristics or aggregated ESG scores; however, they neglect the fact that the performance of a country's institutions, in particular with respect to the levels of wealth, rule of law, and freedom of the press, is very likely to affect the number of ESG incidents reported in a country. This gap limits our understanding of how country-level institutional characteristics and firm attributes jointly affect the occurrence of ESG incidents.
To address this, our study develops a comprehensive framework for predicting ESG incidents by combining country-level institutional indicators with firm-level characteristics in a unified empirical setup. We employ the global RepRisk database, which systematically records ESG-related controversies from diverse news and institutional sources, validated through a hybrid process of machine learning detection and human analyst verification. Our sample includes 300,000 incidents registered between 2008 and 2023, covering over 10,000 firms across hundreds of countries and all major industry sectors. Using hierarchical count models, including quasi-Poisson and Bayesian negative binomial specifications, we estimate the probability of ESG incidents as a function of both institutional conditions – such as rule of law, corruption levels, labor rights, and press freedom – and firm attributes such as sector and market capitalization. This dual perspective allows us to disentangle the influence of country contexts from company-specific risk factors, providing novel insights into the global geography of ESG controversies.
This study offers several stakeholder-specific contributions. For academia and regulators, it introduces a global incident-count framework that combines country-level institutional indicators and firm-level characteristics to explain ESG controversies. For companies, it shows how institutional context and firm size relate to controversy rates, enabling benchmarking of ESG incident risk. For investors and capital markets, it provides model-based expectations of ESG incidents that can be incorporated into risk management and portfolio construction. For society in general, the study maps where ESG controversies are most likely to surface and underscores the role of institutions in making corporate misconduct visible.
2. Literature review
2.1. Explainability and predictability of ESG ratings
Several studies examine the determinants, divergence, and prediction of ESG scores. Berg et al. (Reference Berg, Kölbel and Rigobon2022) examined the divergence in ESG ratings across six leading providers (KLD, Sustainalytics, Moody's ESG/Vigeo-Eiris, S&P, Refinitiv, and MSCI), showing that divergence mainly stems from how ESG is measured, with additional contributions from scope and weighting. It also identifies a ‘rater effect’, in which each agency's overall assessment of a firm influences its scoring of specific ESG categories, underscoring the need for greater transparency in ESG data and methodologies. Del Vitto et al. (Reference Del Vitto, Marazzina and Stocco2023) applied machine-learning techniques to replicate and interpret the ESG rating process of Refinitiv, focusing on firms from the United States, European countries, and China. They employed both fully explainable (white-box) models and more obscure (black-box) models; the authors demonstrated that the proprietary rating methodology could be approximated with high accuracy. The use of interpretability tools further identified the most influential variables driving ESG ratings, providing insights into the otherwise opaque assessment process.
A series of studies using machine learning techniques investigated the predictability of ESG ratings using fundamental data and past ESG track record. García et al. (Reference García, González-Bueno, Guijarro and Oliver2020) employed a novel modeling approach to forecast ESG ratings. They investigated the relationship between ESG scores, fundamental and market-based financial performance indicators, and industry sectors for publicly traded European firms over 2013–2018. By conducting 500 simulations across varying discretization parameters and grouping scenarios, their analysis evaluated the predictive capacity of financial and industry variables for ESG classification. The results demonstrated that these variables effectively differentiate firms when ESG scores are clustered into broad categories, but their predictive accuracy declines as the granularity of ESG groupings increases.
In a similar vein, D'Amato et al. (Reference D'Amato, D'Ecclesia and Levantesi2021) assessed the extent to which fundamental financial variables predicted Bloomberg ESG scores for firms in the Euro Stoxx 600 over the past decade. Utilizing a machine-learning framework based on the random-forest algorithm, the authors demonstrated that financial statement variables possessed substantial predictive power, indicating that traditional accounting data can serve as effective determinants of ESG ratings. This work on predicting ESG events using financial variables casts a causal shadow over the literature that holds that ESG is driving financial performance. Taskin et al. (Reference Taskin, Sariyer, Acar and Cagli2025) examined the prediction of future ESG performance using machine learning methods for firms in the BIST, the main Turkish stock exchange, sustainability index in Turkey. Applying decision tree, random forest, k-nearest neighbor, and logistic regression models, the authors demonstrated that past ESG scores and grades served as reliable predictors of future ESG ratings. The findings highlighted that simple score-based indicators can effectively forecast ESG performance, offering practical tools for sustainable finance in emerging markets and broader applications in international financial contexts.
2.2. Prediction of ESG incidents across and within sectors
The bulk of studies around ESG incidents is centered around the impacts on asset prices (Groen-Xu & Zeume, Reference Groen-Xu and Zeume2021; Kölbel et al., Reference Kölbel, Busch and Jancso2017; Krüger, Reference Krüger2015; Orpiszewski & Thompson, Reference Orpiszewski and Thompson2025), financial performance (DasGupta, Reference DasGupta2022; Jucá et al., Reference Jucá, Muren, Valentinčič and Ichev2024), or integration of ESG controversies into risk management and investment strategies (Iwata & Weibel, Reference Iwata and Weibel2024). We have identified several studies on the prediction of ESG controversies across sectors, and in this section we refer to the most relevant ones.
Zheng and Yan (Reference Zheng and Yan2022) proposed a logit-based incident prediction model to test whether ESG ratings can reduce headline risk. Using RepRisk data from 2007 to 2021, they showed that past incidents and firm fundamentals strongly predicted future ESG controversies, while policy- and disclosure-based ratings often failed, suggesting greenwashing concerns. Their model outperformed third-party benchmarks with considerably higher accuracy, offering investors a more reliable tool for ESG risk management. Svanberg et al. (Reference Svanberg, Ardeshiri, Samsten, Öhman, Neidermeyer, Rana, Svanberg, Öhman and Lowe2023) implemented a series of machine learning–based methods for predicting ESG controversies using fundamental, market, and ESG rating data as model inputs. The set of models predicted which companies were likely to face ESG controversies with 70–84% accuracy and identified the most influential risk indicators.
Shakil et al. (Reference Shakil, Pollestad and Kyaw2025) employ a machine-learning approach to show that ESG controversies significantly increase firms’ systematic risk, reinforcing the view that controversy incidence is a financially material risk factor. Seow (Reference Seow2025), in a systematic literature review of machine-learning applications in ESG analytics, similarly emphasizes that controversy prediction and incident-based risk measures are becoming central themes in ESG research.
Dipierro et al. (Reference Dipierro, Barrionuevo and Toma2025) investigated ESG-related controversies (ESGC) in the banking sector using a panel of 140 banks from 2011 to 2020. Applying machine learning feature selection methods to 28 variables, the authors showed that governance–employee dynamics were the strongest predictors of ESGC risk, surpassing operational, and financial factors. The findings highlighted the value of ML for ESG risk prediction and offered implications for regulatory technology and risk governance. Lheureux (Reference Lheureux2024) took a similar approach, exploring the use of Twitter-based sentiment and machine learning to predict ESG controversies.
Sun et al. (Reference Sun, Luo, Yiu, Yu and Ding2024) examined the relationship between ESG scores and ESG scandal probability. They employed low-frequency ESG Ratings from MSCI ESG, Refinitiv ESG, Sustainalytics, and S&P Global, as well as ESG Incidents collected by RepRisk. The authors attempted to predict the probability of occurrence of an ESG incident as a function of ESG Score, divergence of ESG Scores between agencies, and a set of company fundamental ratios. They also calculated the cumulative stock abnormal returns around event dates using the Capital Asset Pricing Model. Their empirical evidence shows that higher ESG scores are linked to lower probabilities of ESG scandals and weaker negative stock reactions when scandals occur, suggesting that ESG scores provide meaningful signals for future reputational and financial risk.
Further empirical work has examined ESG controversies through specific institutional and technological channels. Agnese et al. (Reference Agnese, Cerciello, Giacomini and Taddeo2023) analyze European banks and show that board structures and governance arrangements are systematically related to banks’ ESG controversy scores, highlighting the role of internal governance in shaping incident risk. Ayadi and Hunjra (Reference Ayadi and Hunjra2026) document that, in periods of economic uncertainty, greater digital integration reduces information asymmetry and is associated with fewer ESG controversies, suggesting that digital disclosure can mitigate controversy risk. Related strands of research link institutional and informational environments to environmental and governance outcomes, including work on economic freedom and green growth or carbon emissions (Hou et al., Reference Hou, Jin and Feng2025), and the role of financial reporting in governance following scandals (Iqbal, Reference Iqbal2025).
There are numerous domain-specific studies on severe incidents that are worth mentioning, though we do not intend to delve further into each theme. Beckmann and Rogmann (Reference Beckmann and Rogmann2024) analyzed ESG incidents in the energy sector across 150 countries. They found that the number of ESG controversies was associated with the level of wealth in a country and with policy-uncertainty metrics, economic growth, and fossil fuel use.
In a meta-study on the oil and gas sector, Al-Sabaeei et al. (Reference Al-Sabaeei, Alhussian, Abdulkadir and Jagadeesh2023) employed machine-learning techniques to assess oil and gas pipeline failures. In the mining sector, several studies compiled historical datasets and explored the mine tailings dam failures using local dam parameters (Concha Larrauri & Lall, Reference Concha Larrauri and Lall2018; Piciullo et al., Reference Piciullo, Storrøsten, Liu, Nadim and Lacasse2022). Finally, in a recent meta-study of over 125 empirical studies, Bel-Oms (Reference Bel-Oms2025) undertook a systematic literature review of ESG controversies. The analysis yielded a conceptual framework identifying the origins and consequences of ESG controversies. Their findings highlight that explainability and predictability of ESG incidents regarding country and cultural differences remain areas for future research.
Research gap: Interestingly, the majority of empirical studies employed global ESG controversy data and, logically, controlled for country fixed effects or clustered the countries, however, to date, none of the studies explored the role of the country of incident occurrence, or country of headquarters, in the prediction, considering both company and country characteristics in a uniform setup. This deficit is glaring when one considers that each country has its own institutional particularities, backed by a monopoly of violence on its own territory to enforce rules and regulations. For this reason, we try to respect this reality by incorporating both sets of institutional rules into the baseline hazard rate for ESG events. That said, the relationship between state institutions and ESG events is theoretically ambiguous: states with more rules may lead to more ESG events; states with poor enforcement or few rules may lead to fewer adverse events if there are fewer norms to violate.
3. Data and methodology
3.1. Data
3.1.1. ESG incident data collected by reprisk
For over twenty years, RepRisk has systematically collected information on companies’ adverse incidents from diverse sources such as local and international media outlets, government and Non-gonvernmental Organization (NGO) reports and websites, newsletters, blogs, and, to a limited extent, social media. Machine-learning algorithms identify these incidents, which are then reviewed and validated daily by human analysts. Each incident is linked to potentially impacted companies and categorized under the relevant ESG dimension, with some cases spanning multiple ESG areas. Incidents are further classified by their novelty, severity, and reach. All entries are timestamped according to the date provided by the source, which may differ from the actual date of occurrence.
In this study, we employed the global dataset between 2008 and 2023. The mining and materials companies covered are headquartered in 67 countries. Table 1 presents the number of companies per sector. There seem to be different reasons for the event counts. Financials seem to be involved in a disproportionate number of events, perhaps due to the number of loans and deals and general banking regulation, whereas real estate is large in terms of value in the economy, but the operations tend to be very low-salience and local. The industry-specific attributes probably drive more of the event reporting than how irresponsible any industry actually is.
Summary statistics of ESG incidents collected by RepRisk

Table 1 Long description
Sector-level counts pair the number of companies with the number of recorded ESG incidents. Missing or Other is the largest category, with 7,092 companies and 82,604 incidents. Financials has 838 companies and 63,651 incidents, the second-highest incident total despite far fewer companies than Missing or Other. Mid-range incident totals include Materials at 31,192, Industrials at 28,523, and Consumer staples at 28,161. Utilities and Energy follow with 15,458 and 14,169 incidents, while Healthcare and Information technology are around eleven thousand incidents each. Consumer discretionary and Communications are lower at 8,514 and 6,035 incidents, and Real estate is minimal with 14 companies and 52 incidents. Overall totals are 10,687 companies and 300,288 incidents; comparisons should be read with caution because the Missing or Other grouping is broad and sector mapping may be incomplete.
Note: We mapped the ISINs for US, European, and Japanese stocks that are included in the major indices. RepRisk's internal classification was mapped to sectors where available.
The meta-information registered for each ESG incident includes the location of the incident, the language, and the number of companies involved in the incident. In terms of location of incidents, Table 2 illustrates that the bulk of ESG incidents are reported in the US, followed by China, Britain, India, and the large European countries. Surprisingly, Switzerland has the same number of incidents as Japan, although Japanese Gross Domestic Product (GDP) in USD is substantially larger than the Swiss GDP. The number of events for a country or sector is idiosyncratic, depending on a myriad of factors such as the size of the country, press coverage, or the size of the capital market; for example, Russia has a relatively low number of incidents compared with Australia given its size. This means that event counts are a product of both the actual incidents and various forces like investors’ or national institutions’ interest in equity.
Top 10 countries with the largest count of ESG incidents

Table 2 Long description
Countries and their total count of ESG incidents are listed, along with each countrys share of all recorded incidents. The United States ranks first with 23,217 incidents, representing 7.73 percent of all incidents. China is second with 10,211 incidents and 3.40 percent, followed by the United Kingdom with 7,678 and 2.56 percent. India and Brazil are close, with 6,454 and 2.15 percent versus 6,332 and 2.11 percent. Canada, Indonesia, France, Germany, and Australia each contribute between 1.56 percent and 1.86 percent, with totals from 4,693 to 5,598. Additional entries shown include Russia at 4,323 and 1.44 percent, Japan at 3,648 and 1.21 percent, and Switzerland at 3,500 and 1.17 percent. Overall, the distribution is top heavy, with the United States contributing more than double Chinas incident count and a noticeably larger share than any other country. Counts and shares reflect recorded incidents in the underlying dataset and may be influenced by reporting coverage and monitoring intensity across countries.
Note: RepRisk incident data.
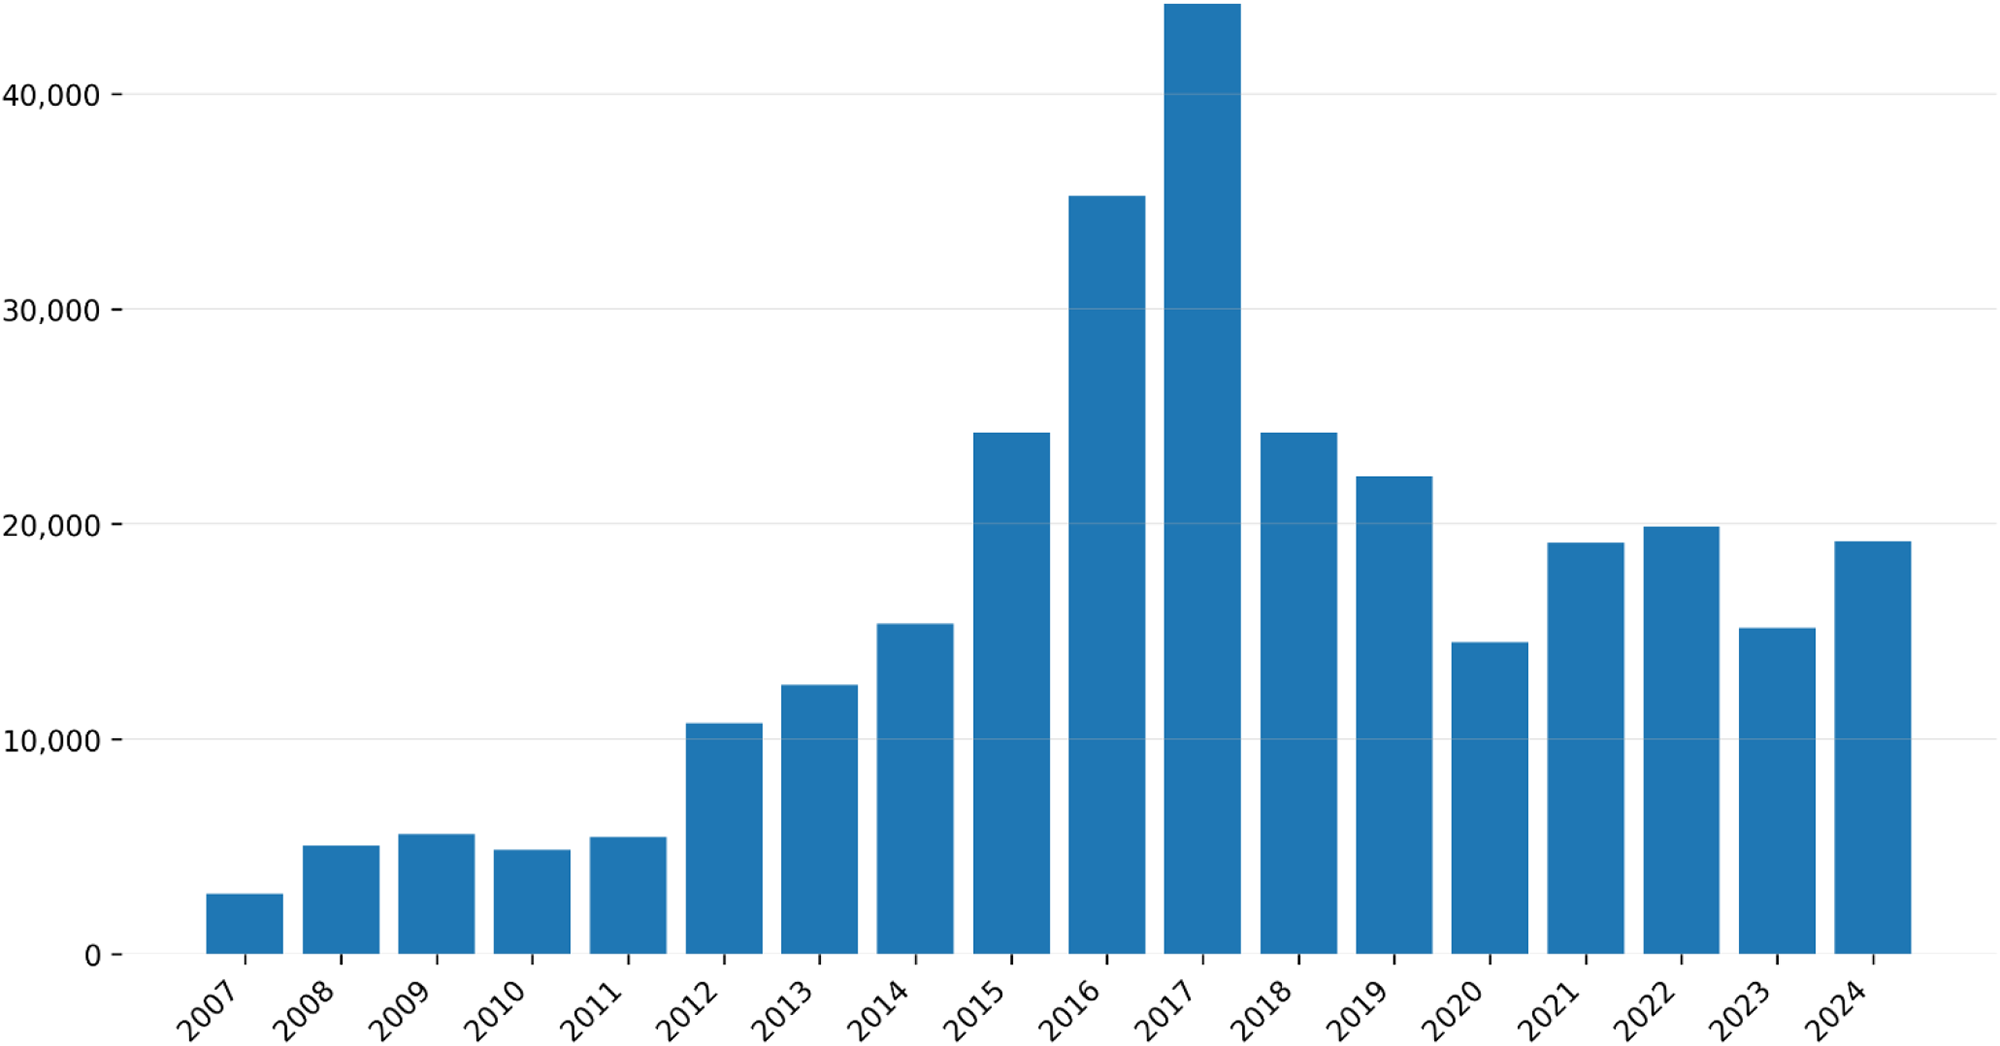
It is noteworthy that RepRisk registers the incidents in the database using the date of publication of the report and not the date when the actual incident occurred. As a result, at times there are several incidents registered per day. Also, one registered incident can involve more than one company; at times, several companies from the sector are involved. Several studies, such as (Orpiszewski et al., Reference Orpiszewski, Thompson and Schwendner2024), provided a detailed description of this phenomenon and the adjustments necessary to correctly calculate the cumulative abnormal returns around the ESG event dates. In this study, we are interested in the count and rate of occurrence of ESG incidents and hence do not intend to undertake any adjustments to the raw data. Figure 1 shows that the early years were about including more events, ramping up to a peak number of events in 2017, and since then it looks like RepRisk may be truncating coverage in some manner, with some variability around the ∼19,000 events.
Events by year.

2. Explanatory variables
Table 3 defines the variables used below. The country-level indicators are based on recognized global benchmark variables. The indicators were selected to align with the internal classification from RepRisk. Some of these are used by Axelrod and Leitner (Reference Axelrod and Leitner2016), who provided an empirical, peer-reviewed proof that sovereign-level social and governance datasets contain financially material signals for stock market performance. The twist here is that we are looking at the actual ESG news events for those equities, in part to ascertain whether the positive impact on equity performance is mediated by these news flows – i.e. whether ESG is the causal channel.
Country institution indicators

Table 3 Long description
Eleven country institution indicators are defined to assess human rights, labor conditions, governance, corruption risk, environmental health services, democracy, and press freedom. For each indicator, an expected sign is provided, indicating whether higher values are generally treated as better, worse, or context-dependent, plus a short description of the data source and what it measures. Most indicators are described as rescaled to a zero-to-one range, though the corruption measure notes that higher scores indicate less corruption before scaling. Expected signs vary: negative for child labor, rule of law, bribery and corruption, labor rights issues, and water stewardship; positive for forced labor prevalence, money-laundering risk, workplace safety injuries, and press freedom; and ambiguous for human rights and liberal democracy. Several measures are composite indices built from multiple inputs, such as corruption perceptions, money-laundering vulnerability, and labor rights scoring. Interpretation should be cautious because indicators differ in methodology, year, and whether they capture outcomes, risks, or perceptions rather than directly observed events.
Note: Human Rights Measurement Initiative https://humanrightsmeasurement.org/, The Global Slavery Index https://www.walkfree.org/global-slavery-index/, Children's Rights in the Workplace Index https://www.unicef.ch/en/what-we-do/national/publications-teaching-materials/childrens-rights-workplace-index, World Justice Project https://worldjusticeproject.org/rule-of-law-index/, Transparency International https://www.transparency.org/en, Basel Anti–money laundering, https://baselgovernance.org/resources/basel-aml-index/, Labor Rights Index https://wageindicator.org/work/labour-law/index/, V-Dem https://www.v-dem.net/, Reporters Sans Frontiers https://rsf.org.
The choice of these country-level determinants is consistent with institutional and information-based perspectives on ESG controversies. Institutional theory suggests that legal quality, labor protections, corruption control, democratic accountability, and media freedom shape both firms’ incentives to comply with social and environmental norms and the probability that violations are detected and publicly reported. This is particularly relevant for variables such as rule of law and press freedom: stricter rule of law should improve enforcement and deter misconduct, whereas greater press freedom should increase the visibility of adverse events and reduce selective underreporting.
However, in our context, there is no empirical prior on whether strong democracy leads to more rules to violate, or better behavior by the companies that operate. There are no strong empirical priors on the variables because they can imply two opposite effects: on the one hand, strong institutions encourage better corporate behavior like in Switzerland, but on the other hand, those institutions also induce more critique of companies where expectations of corporate propriety are set higher, so by definition more violations occur. In theory, one could bridge the work here to develop priors if one has very strong beliefs about returns and ESG. That is to say, if better ESG behavior causes higher returns, the return literature can be used conversely to establish a prior metric. Axelrod and Leitner (Reference Axelrod and Leitner2016) find a positive correlation between equity returns and the same Liberal Democracy Indicator we use; thus, we would expect fewer ESG events if and only if better ESG behavior leads (i.e. fewer adverse RepRisk events) to higher equity returns.
Because the dependent variable is the number of reported ESG incidents, the expected signs reflect both underlying misconduct and the likelihood that incidents are detected and reported. Stronger institutions may reduce misconduct, but they may also increase transparency and public scrutiny. We therefore expect rule of law, lower corruption, stronger labor protections, child-labor safeguards, and water stewardship to be negatively associated with reported incidents. By contrast, press freedom is expected to have a positive sign because it increases visibility and reporting. Liberal democracy and human-rights protection are treated as theoretically ambiguous because they may both improve corporate conduct and increase the public detection of violations.
Like the variables above, the variables in Table 4 below are country-based. We separated them conceptually because they are intended to be control variables, independent of any institutional assumptions. For example, population and GDP control for size, in that one would expect that bigger countries have more events.
Control variables

Table 4 Long description
Control variables used in an analysis are listed, giving each variables expected direction of association and its data source with a brief definition. Variables expected to have a positive association are population, GDP, and market capitalization; each is taken from World Bank or Refinitiv data and transformed using the natural logarithm. Event country and event year come from RepRisk and identify where and when an event occurred, with no expected direction stated. S and P sector and headquarter country come from Refinitiv and classify the firm by industry and legal headquarters location, also with no expected direction stated. The content is descriptive rather than reporting values, so it does not show magnitudes, statistical significance, or time trends. Expected signs are assumptions for modeling and may differ from estimated results depending on the outcome definition and sample.
We also expect some baseline industry differences but are largely agnostic about which industries and why they might have more adverse effects. We therefore expect control for industry to account for potential heterogeneity in the distribution of firms across countries. For example, a large share of real estate companies in our sample is located in Switzerland, a country with strong institutions. Without industry controls, the relatively low incidence of ESG events among real estate firms could be incorrectly attributed to Switzerland's institutional environment rather than to industry-specific characteristics.
In Figure 2, we show Pearson's correlation between the major country-level indicators that might help predict events in color, and their significance, in p-values, is likewise shown. The loadings, while related, do not seem to exhibit excessively high correlations (>0.9) that would indicate they are measuring the same latent country factor. Money laundering is a type of rule of law issue, and hence has a high correlation, but given that some events are violations of domestic legislation, it did not seem wise to proxy rule of law with money laundering. Furthermore, in the gold space, money laundering is a specific concern that warrants its own metric for communicating with stakeholders. All the correlations on the diagonal are significant by construction, and those with no absolute correlation tend also toward no significance.
Correlation matrix for explanatory variables.

3.2. Methodology
The RepRisk incident data were aggregated by event country (c), company (i), and year (t). This aggregation yields a count variable of events related to a particular company having occurred in a given country and year. The most common and appropriate distribution to model count data within a given period is the Poisson distribution, for example, Passas et al. (Reference Passas, Ragazou, Zafeiriou, Garefalakis and Zopounidis2022) analyze sociopolitical determinants of ESG controversies in EU firms using Poisson-based specifications.
Given that the mean event count is about 2 per year, but the sample variance is about 17, and a Poisson model is only appropriate when the first and second moments are equal, a quasi-Poisson distribution is more appropriate. Accounting for t is done by extending the model with a dispersion parameter. To identify the country-level and firm-level effects simultaneously, we use a hierarchical generalized Poisson model where each firm is active in a set of {c_i}. Each firm has a vector of events occurring in different countries, with both local-event etiology and firm-level effects.
In the generalized linear Poisson model, the expected number of events (Y) occurring in a country (c) for a firm (i) in year (t) is modeled using the firm attributes (F), and country indicators (I) using the following expression:
 \begin{equation}\ln \left( {Ex\left\{ {{Y_{i,c,t}}\,\left| {{F_{i,t,}}\,\left. {{I_{c,t}}} \right|} \right.} \right\}} \right)\, = \,\alpha + {\varphi ^T}{F_{i,t\,}}\, + \,{\iota ^T}{I_{c,t}}\end{equation}
Our generalized linear Poisson specification relies on standard generalized least squares assumptions for count data. First, conditional on the covariates, firm–country–year observations are assumed to be independent, implying no remaining serial or cross-sectional autocorrelation in the residuals once the model terms are included. Second, the log-link function is assumed to be correctly specified such that the conditional mean of the ESG incident count is an exponential function of the linear predictor. Third, a conventional Poisson model assumes equidispersion (equality of the conditional mean and variance); in our data, the conditional variance substantially exceeds the mean, so we explicitly account for overdispersion through a quasi-Poisson specification with an estimated dispersion parameter. Finally, we assess overall model fit and overdispersion by comparing residual deviance to the residual degrees of freedom and by inspecting Pearson residuals.
In the second model, we estimate a Bayesian hierarchical negative binomial count model, where the observed number of events generated in the equation above is censored by press freedom. After the underlying process generates an event, the press reports on this event, hence, there is a truncation of this reporting in countries where freedom of the press is limited.
 \begin{equation}ln(\mu )\, = \,\ln (\cdot )\,-\,\pi \,pres{s_{c,t}}\,\end{equation}
where µ = exp(∙ −π pressc,t) and y = negativeBinomial (µ, ϕ).
The Bayesian hierarchical negative binomial model extends this framework by allowing the mean–variance relationship to depart flexibly from equidispersion and by introducing random-effects terms that capture unobserved firm- and country-level heterogeneity. The key assumptions in this setting are that, conditional on the covariates and random effects, counts are independent draws from a negative binomial distribution (conditional independence), that the specified hierarchical structure appropriately captures residual clustering, and that the chosen prior distributions for regression coefficients and dispersion parameters are weakly informative but not overly restrictive. As in the quasi-Poisson case, we examine posterior predictive checks and residual diagnostics to verify that no major autocorrelation or systematic lack of fit remains. In the next section, we shall review the results from these two models.
4. Empirical results and discussion
The simplest baseline model is a quasi-Poisson model of the number of events reported by RepRisk for a given company that occur during a single year. Due to gaps in various country-company-year combinations, we chose to use a pooled approach. That said, the standard errors have been clustered by company (i.e. ISIN) and event country.
Table 5 demonstrates that the main drivers of events are a country being a liberal democracy and GDP. Doubling GDP is associated with roughly a 20% increase in the expected number of ESG controversies, and firms in liberal democracies experience about twice as many observed controversies as those in non-liberal regimes, consistent with greater economic activity and more open societies generating both more underlying events and more reporting. Moving from the bottom to the top of the Press-Freedom Index increases the number of controversies captured by roughly 40%, while moving from the lowest to the highest rule-of-law score reduces expected controversy counts by around half, highlighting the difference between observation bias and actual behavior – stronger media environments reveal more problems, whereas stronger legal institutions appear to dampen a country's propensity to generate adverse ESG events.
Baseline quasi-poisson model. Dependent variable: total annual number of ESG controversies per firm–country–year

Table 5 Long description
Regression results estimate how firm and country factors relate to the annual count of ESG controversies per firm, country, and year. The strongest positive associations are for national GDP (about 0.189, statistically significant) and liberal democracy (about 0.688, statistically significant). Firm size measured by logged market capitalization is also positive (about 0.038, statistically significant), and RSF press freedom is positive (about 0.335, statistically significant). Rule of law is negative (about minus 0.657, marginally significant), indicating fewer controversies where rule of law is stronger. Several topic indicators are small but statistically significant: water stewardship is slightly negative, labor safety is positive, labor conditions is slightly negative, labor child is slightly positive, and money laundering is positive. Year, logged population, transparency, human rights, and labor slavery show little or no clear association in this model. Coefficients reflect associations in a quasi-Poisson count model and should not be interpreted as causal effects.
Note: Standard errors are reported in parentheses and clustered by ISIN and country; Signif. codes:
* p < 0.10,
** p < 0.05,
*** p < 0.01; N = 300,386; I = 10,416; C = 236; T = 18.
These institutional patterns are consistent with recent evidence that country-level controversy indices and economic conditions shape ESG controversy intensity. Beckmann and Rogmann (Reference Beckmann and Rogmann2024) show that a country-level ESG controversy index is strongly associated with economic policy uncertainty and macroeconomic dynamics, highlighting that controversy frequencies are systematically related to institutional and economic environments rather than being purely idiosyncratic. Also Bel-Oms (Reference Bel-Oms2025) emphasizes the central role of institutional quality and transparency in explaining where controversies emerge and how they affect firms.
Table 6 shows the results of a generalized linear regression with a quasi-Poisson distribution. The inclusion of the event country and headquarter country fixed effects reduces the size of the major country indicator variable of liberal democracy, which goes from a major positive difference in the expected number of events to a negative significant effect about one-tenth the size. No matter which event type is measured, there is a general trend toward more adverse ESG, which is probably attributable to reporting bias rather than deteriorating CSR behavior. Worth calling out is the fact that labor health issues seem far more correlated with the market capitalization of a company than do the other event types.
Event hazard by RepRisk event type. Dependent variable: annual number of ESG controversies per firm–country–year

Table 6 Long description
Regression results relate firm and country characteristics to the annual count of ESG controversies, reported separately for all events and five event types. Log market capitalisation is positive and statistically significant in every model, with the largest association for labor health and smaller but still positive links for corruption, water, human rights abuse, and employment conditions. Log population is generally positive, especially for human rights abuse, labor health, and employment conditions, while the water model shows an imprecise estimate. Log GDP is positive for all events and corruption, near zero for water, and negative and statistically significant for human rights abuse, labor health, and employment conditions. Governance and issue-specific measures appear only in their corresponding models: liberal democracy is negative for all events; transparency is positive for corruption; safe water coverage is weakly positive for water; human rights is positive for human rights abuse; labor issues is positive for employment conditions; labor safety is near zero for labor health. Press freedom is positive and statistically significant across all models. The event-year term is positive for most outcomes but negative for water, suggesting different time patterns by event type. Country and headquarters-country controls are included but not displayed, and dispersion parameters vary across models, indicating differing levels of overdispersion by event type.
Note: Standard errors are reported in parentheses; theta = 2.25; Signif. codes:
* p < 0.10,
** p < 0.05,
*** p < 0.01; N = 300,402; I = 10,416; C = 236; T = 18.
Table 7 demonstrates that the qualitative role of institutional variables is broadly consistent across event types. Press freedom and GDP are positively associated with most categories of ESG controversies, suggesting that more affluent and media-open environments tend to surface a wider range of adverse events, from human-rights and labor issues to corruption. Market capitalization remains a strong positive predictor in nearly all columns, especially for labor-related and health-and-safety controversies, which is consistent with larger firms having more complex operations and being subject to greater scrutiny in socially sensitive areas.
Indicator validity by RepRisk event type. Dependent variable: annual number of ESG controversies per firm–country–year

Table 7 Long description
Regression results relate the annual count of ESG controversy events to time, firm size, country demographics and governance measures, estimated separately for nine RepRisk event types. Firm size (log market capitalization) is positive and statistically significant in every model, with the largest coefficients for child labor and water management and smaller effects for corruption and law violation. The year term is near zero for overall events but is positive for human rights, forced labor, law violation, labor issues and labor safety, while it is negative for child labor and water management. Population is strongly positive for human rights and child labor and positive for labor safety, but negative for labor issues; it is close to zero for overall events and law violation. GDP is positive for overall events and law violation but negative for human rights, forced labor and child labor, and shows little association for the remaining categories. Press freedom has small positive associations in several models, while the human rights and forced labor models show large uncertainty for this variable. Event-type-specific indicators show mixed results: liberal democracy is negative for overall events; the human-rights indicator is positive for human-rights events; rule of law is strongly negative for law-violation events; transparency is negative and money laundering is positive for corruption events; water stewardship is positive for water-management events. Country and headquarters-country fixed effects are included (some not displayed), so coefficients should be interpreted as within-country comparisons rather than cross-country level differences.
Note: Standard errors are reported in parentheses and clustered by ISIN and country; theta = 2.25; Signif. codes:
* p < 0.10,
** p < 0.05,
*** p < 0.01; N = 300,402; I = 10,416; C = 236; T = 18.
A limitation of the dataset is that sector information is unavailable for a substantial share of the observations reported in Table 1. This restricts the extent to which the descriptive distribution of events can be interpreted across sectors. In particular, the sectoral breakdown should be read as indicative rather than as a complete representation of the full sample. However, this limitation is less consequential for the econometric analysis, because the main models do not rely on sector classification as the central explanatory variable. Instead, the analysis controls for relevant company- and country-level characteristics. As a result, the missing sector information primarily affects the interpretation of descriptive sectoral patterns, rather than the estimation of the main relationships examined in the paper.
4.1. Test of metrics
Table 7 below shows the results of a negative binomial model estimating the event counts by category. Each generalized linear regression includes country-level indicators for the event category.
Table 8 shows the primary event regression broken down by S&P sector. (Real estate regression is not shown because it is barely covered in the RepRisk dataset.) While country-level fixed effects have been maintained, headquarters-country effects have been elided for concision. What we learn from Table 8 is that, at the country level, effects like liberal democracy or the RSF index show little difference in the industry's ESG response. Almost all the coefficients are near 0 for the RSF index. Though if we were to adjust the standard errors for multiplicity, repeated tests of an industry would indicate that most of the differences are spurious, albeit in the case of real estate both the GDP and RSF index would reject the two-sided Bonferroni-adjusted null of 0.005; one hypothesis might be that real estate companies are intrinsically tied to their local and thus more heavily influenced by the country-level variables, but small sample bias is a more likely theory why real estate is an outlier.
Event counts by sector. Dependent variable: annual number of ESG controversies per firm–country–year

Table 8 Long description
Sector-specific regressions relate the annual count of ESG controversies per firm to country to year to calendar year, firm size (log market cap), country population and GDP, liberal democracy, and the RSF Index. The year coefficient is positive and statistically significant for industrials, consumer discretionary, consumer staples, health care, communications, and information technology, indicating rising controversy counts over time in those sectors; it is not significant for materials, financials, or energy, and is only weakly positive for utilities. The largest positive time association appears in consumer discretionary and communications, while industrials and consumer staples also show clear increases. Firm size is associated with fewer controversies in industrials and health care, but with more controversies in materials, consumer discretionary, consumer staples, and utilities; it is not clearly related in financials, energy, communications, or information technology. Country population and GDP show mixed patterns, with notably positive and significant effects in consumer staples and some positive associations in communications and utilities, while information technology shows a negative GDP association. Liberal democracy is not consistently related to controversy counts across sectors, with no clear statistically significant pattern. The RSF Index is positively associated with controversy counts in consumer discretionary, consumer staples, and information technology, and is weakly positive in financials, but shows no clear relationship in several other sectors. Sample sizes vary widely by sector, from about six thousand observations in communications to over sixty-three thousand in financials, so precision and comparability differ across columns.
Note: Standard errors are reported in parentheses and clustered by ISIN and country; Signif. codes:
* p < 0.10,
** p < 0.05,
*** p < 0.01.
That larger firms face more recorded ESG incidents is consistent with recent global evidence that business complexity and scale are positively associated with ESG controversies, partly because more complex firms operate in a greater number of jurisdictions and face more intensive analyst and media scrutiny. Studies of bank ESG controversies similarly find that governance structures at large financial institutions are tightly linked to controversy risk.
In this last Bayesian hierarchical model presented in Table 9, we try to model the observed events as conditional on the amount of press freedom in the country, again as measured by the RSF Index. We use an uninformative normal prior for all the parameters, except for the negative binomial outcome where we used a gamma prior for the success probability hyperparameters, which were parametrized with an initial distribution to obtain the mean number of events as the unconditional null.
Conditional event count model (negative-binomial). Dependent variable: annual number of ESG controversies per firm–country–year

Table 9 Long description
Negative-binomial regression results relate firm and country factors to the annual count of ESG controversies per firm-country-year. The RSF Index has a negative coefficient of about minus 0.016 with strong statistical support, indicating fewer controversies as the index increases. Year has a small positive coefficient of about 0.01 with marginal statistical support, suggesting a slight upward time trend. Firm size, measured as log market capitalization, is negative at about minus 0.24 but not statistically clear. Country economic size, measured as log GDP, is positive at about 0.09 and not statistically clear. Liberal Democracy is positive at about 0.20 and not statistically clear. The intercept is about 0.33. Country and headquarters-country dummy effects are included but not displayed, so some cross-country differences are absorbed by those controls.
Note: N_eff = 8; (s.e. with implied p-value significance codes:
* p < 0.10, **p < 0.05,
*** p < 0.01).
This model shows the influence of censoring and press coverage as evidenced by the country, which enters as a multiplicative term. The effect is minimal, reducing the number of events by about 1.6%. In theory, more press freedom ought to lead to more reporting, but the model may just be picking up on some latent institutional aspects of the country not otherwise captured by GDP or democracy, which (non-)coincidentally is zero.
Last but not least, our use of quasi-Poisson and Bayesian hierarchical negative binomial models directly addresses the main robustness concerns for count data, namely overdispersion and unobserved firm- and country-level heterogeneity. We also estimate alternative specifications with different covariate sets and fixed-effects structures and obtain very similar coefficients for the core institutional and firm-level variables. In light of these built-in specification checks and the large sample size, additional ad-hoc robustness tests would primarily replicate the same results rather than provide new insight.
5. Conclusions and outlook
This study provides one of the most comprehensive empirical examinations to date of why ESG controversies arise and how both institutional context and firm-level characteristics shape their global distribution. By combining more than 300,000 RepRisk-documented incidents in hierarchical quasi-Poisson and Bayesian negative binomial models, it develops a global incident-count framework that jointly estimates the contributions of country-level institutions and firm-level traits to controversy frequencies. Unlike most existing studies, which either focus on ESG ratings, single regions, or firm-level governance mechanisms in isolation, this study integrates a broad set of institutional indicators (rule of law, corruption control, labor and human-rights measures, press freedom, liberal democracy) with firm-level characteristics across more than 10,000 firms worldwide, thereby providing a structural decomposition of ESG controversy risk across countries and sectors.
Our results reveal that country-level factors – especially GDP, press freedom, rule of law, and labor rights – significantly affect the likelihood that incidents occur and are reported. Higher press freedom and national wealth are associated with more observed events, reflecting both greater scrutiny and potentially more active civil society monitoring, while stronger rule of law corresponds to fewer incidents, suggesting a moderating role of institutional enforcement. Among firm-level variables, market capitalization consistently emerges as a strong predictor of event frequency. This effect likely reflects a combination of true underlying risk (larger firms operating across more countries) and observational bias (greater attention from media). Lastly, the findings should also be interpreted in light of some data limitations. In particular, sector information is missing for a substantial proportion of firms, which limits the interpretation of sector-level descriptive patterns.
At the same time, the findings show that broad institutional indicators alone cannot fully explain sparse, firm-specific ESG events. Their explanatory contribution is real but limited. However, excluding institutional variables leads to substantial omitted-variable bias, demonstrating that proper modeling of ESG incidents must account for the institutional environment in which firms operate. These insights are particularly important for cross-country sustainability reporting, and global investment processes that rely on controversy-based assessments.
For academia and regulators, these results offer an institutionally anchored, global incident-count framework that can be used to study ESG controversies alongside, rather than instead of, ESG ratings. For companies, the analysis identifies which institutional settings and firm attributes are associated with higher controversy rates, enabling firms to benchmark their exposure and understand how size and sector interact with local institutional quality. For investors and capital markets, the estimated incidence rates translate institutional and firm-level characteristics into an expected frequency of ESG controversies, providing a complementary risk metric that can be incorporated into screening, portfolio construction, and engagement strategies. Finally, for society at large, the study maps where ESG controversies are most likely to become visible and underscores that stronger institutions can deter harmful behavior and increase transparency about adverse corporate practices.
These contributions should be interpreted in light of several limitations. First, the analysis relies on controversies recorded by RepRisk, which depend on media and stakeholder reporting; the data therefore capture observed controversies rather than all underlying ESG failures, and the degree of under-reporting likely varies across countries and over time. Second, the count models focus on the frequency of controversies – not their severity or financial impact – so the results do not directly address how material each controversy is for firm value or stakeholders. Third, the institutional indicators are measured at the country level and cannot reflect within-country heterogeneity in enforcement or local governance, particularly in large or federal states, and the observational nature of the data means that endogeneity between institutional quality, corporate behavior, and controversy reporting cannot be fully ruled out.
Future work should focus on how events enter the news flow. This study shows that it is nearly impossible to disambiguate between a company being heavily scrutinized and one generating more adverse news. Take market capitalization as a common example: bigger companies have more activities in more countries, are likely to have more adverse events (more safety violations, more environmental accidents); these companies are also the ones most likely to be scrutinized by analysts and the ones more likely to be targeted by activists and reported on by the media. Both the size effect of actual events and news observation bias lead to a positive influence of market capitalization. Until a suitable instrument is found to identify ‘true events’ from ‘observed events’, there will be significant ambiguity in interpreting event quantities.
Beyond the news-flow channel, further research could extend the framework in several directions: by incorporating measures of controversy severity and persistence; by linking incident frequencies to financial outcomes and real activities (investment, employment, or emissions); by modeling dynamic feedbacks between controversies, regulatory responses, and subsequent firm behavior; and by combining incident-count models with machine-learning approaches and alternative data (such as social-media sentiment) to improve both prediction and structural interpretation.
Acknowledgements
We are grateful for the feedback received at the 2025 World Resources Forum in Geneva and at the 2025 AI+X Conference Sustainable Finance Track in Zürich, as well as the reviewers of this article. We also acknowledge the support of RepRisk, in particular Liz Teige, Tsuyoshi Iwata, and Elena Grigorenko from RepRisk AG. During the preparation of this work, the authors used Grammarly Software (https://app.grammarly.com/) to avoid English-language errors. The authors also used ChatGPT to edit and improve the manuscript quality and readability. After using this tool/service, the author(s) reviewed and edited the content as needed and took full responsibility for the publication's content.
Author contributions
T.O. – Conceptualization, Data curation, Investigation, Methodology, Project administration M.T. – Data curation, Investigation, Methodology.
Data Availability statement
The data are proprietary to RepRisk AG and need to be licensed. The code is available upon request.
Funding statement
Innosuisse Grant 57726.1 IP-SBM.
Competing interests
The authors have no competing interests.




 Open access

