

DISCUSSION POINTS
-
• Today’s manufacturing abilities vastly outgrow our ability to measure, design and model phase change heat transfer devices. Over the last 40 years, the basic performance of phase change heat transfer surfaces, i.e. their efficiency and power dissipation, has not improved significantly.
-
• The rational design of optimum surfaces for phase change heat transfer is currently almost impossible, because the physics is too complex and still poorly understood.
Introduction
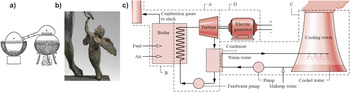
This review discusses the increasingly important contributions of advanced materials and novel fabrication techniques in enhancing phase change heat transfer and the related energy applications. Technologies based on phase change heat transfer have been serving mankind for more than two millennia, Reference Manglik and Jog1 with some examples shown in Fig. 1. Phase change is essential to energy applications, where it drastically enhances heat transfer because latent heat is typically much larger than sensible heat. Reference Incropera and DeWitt2 For instance, the latent heat needed to boil one gram of water (h = 2260 J/g) is more than 100 times larger than the heat required to increase the temperature of the same amount of water by 5 K (c p ΔT = 21 J g−1). In addition, phase change is frequently accompanied by fast and large changes in specific volume, which result in enhanced heat transfer due to convection.
Human beings have relied on phase change heat transfer from Antiquity to now, to satisfy needs such as (a) alcohol production by distillation Reference Manglik and Jog1 (ca. 600 BCE, India), (b) metal casting for military or artistic purposes (Eros with Aphrodite, bronze, ca. 100 BCE), and (c) boiling and condensation for mechanical power, since the industrial revolution of the 19th century. Reference Moran, Shapiro, Munson and DeWitt4 Figures (a, b, c) reprinted with respective permissions of ASME, by courtesy of the Getty's Open Content Program, and with the permission of the Taylor and Francis Group.

Three phase change processes with industrial relevance are considered in a synthetic manner: boiling, condensation, and ice/frost formation. After a presentation of how to characterize phase change, the properties of an optimum surface for each of these three modes of phase change is described; then some fabrication/manufacturing techniques available to modify surface texture and chemistry are described; next, the ways that these techniques have been used to date to enhance phase change heat transfer are reviewed. An emphasis is placed on the fast-developing area of wettability engineering, which relies on manipulating both surface texture and chemistry using special techniques and advanced materials. Then, an assessment is given on the prospective energetic, economic, and environmental benefits of advanced surface engineering for phase change heat transfer. Finally, several research needs and priorities are identified and outlined, toward the goal of engineering optimum surfaces for phase change heat transfer. The review also aims at bridging the gap between the materials and heat transfer communities toward the common goal of designing and deploying optimum material systems with enhanced heat transfer performance and increased thermodynamic efficiencies, thus achieving more sustainable energy transmission and production.
Characterization of phase change heat transfer
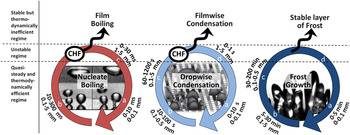
As mentioned in the introduction, the amount of heat exchanged during phase change heat transfer is very high. Therefore, phase change heat transfer is desired in many industrial applications, Reference Collier5 such as during thermal generation of electricity, desalination, metallurgy, electronics cooling, and food processing. Industrial applications with phase change typically use water-based fluids or refrigerants, depending on considerations of the amount of heat to be transferred, operating conditions, and interactions of the fluid with electronic components. Reference Bar-Cohen, Arik and Ohadi6 Figure 2 describes and compares the three phase change processes considered in this review, according to their physical mechanisms, time scales and length scales. Boiling, condensation, and frost formation are each multiphase and quasi-steady processes, as shown in Fig. 2 with circular color arrows. For instance, nucleate boiling involves the temporal sequence of nucleation, bubble growth and detachment, and a similar cycle is observed for condensation and freezing, as described in the caption of Fig. 2. As will be demonstrated later in this section, these quasi-steady processes exchange heat optimally when the solid surface is in contact with both the discrete and continuous fluid phases, e.g., the respective vapor and liquid in the case of nucleate boiling. However, phase change processes can experience instability toward a steady state of lower thermodynamic efficiency. After this transition, shown with an upward black arrow in Fig. 2, the solid surface is in contact with only one fluid phase, e.g., with vapor in the case of film boiling. In fact, the art of designing optimum surfaces for phase change heat transfer relies on keeping the solid surfaces in contact with both the continuous and discrete fluid phases, for the sake of optimum thermodynamic performance.
Synthetic representation and universal features of phase change heat transfer during boiling, Reference McHale and Garimella7–Reference Dhir, Abarajith and Li13 condensation, Reference Boreyko and Chen14–Reference Rykaczewski, Scott and Fedorov17 or frost formation. Reference Lee, Jhee and Yang18,Reference Hayashi, Aoki, Adachi and Hori19 The most efficient mode thermodynamically is the quasi-steady state represented by circular arrows. Time and length scales are listed for each stage of this mode. In boiling, it involves the succession of bubble nucleation (a), growth (b), and detachment (c). In condensation, it involves the succession of drop nucleation (a), growth (b), coalescence (c), and detachment (d). In desublimation or atmospheric frost growth, it involves crystal growth (a), layer growth (b), then dendrite or bulk growth (c), and removal by external forces, like scraping (d). When phase change occurs faster than the removal of the discrete phase, instability occurs and each process transitions towards a single-phase regime which is thermodynamically less efficient. Photograph of the boiling process is reprinted from Ref. Reference Golobic, Petkovsek and Kenning11, copyright 2012, with permission from Elsevier. Photograph of the condensation process is reprinted with permission from Ref. Reference Anand, Paxson, Dhiman, Smith and Varanasi16, copyright 2012 American Chemical Society. Photograph of the frost process is reprinted with permission from Ref. Reference Mishchenko, Hatton, Bahadur, Taylor, Krupenkin and Aizenberg20. Copyright 2010 American Chemical Society.

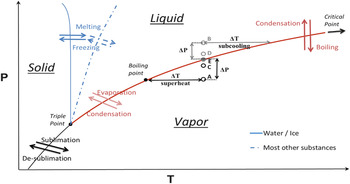
A traditional description of these phase change processes is given with the phase diagram in Fig. 3. The diagram also describes the terminologies used in this review: boiling (liquid to vapor phase change); condensation (vapor to liquid); sublimation (solid to vapor); desublimation (vapor to solid), also known as atmospheric deposition; melting (solid to liquid); solidification or freezing (liquid to solid); icing describes the transformation of water to ice. The term frosting is used for the vapor to solid phase change. However, frosting may also describe the transition from vapor to solid via the liquid phase.
The phase change processes considered in this review can all be described in a pressure (log scale) – temperature diagram. The points A, C, and E illustrate the thermodynamic discussion in boiling, section “Characteristics of optimum surfaces for boiling heat transfer”, whereas the points B, D, and E are relevant to condensation, section “Characteristics of optimum surfaces for condensation heat transfer.”

Thermodynamically, a first measure of phase change heat transfer performance is the maximum heat flux exchanged between a solid surface and the fluid. For a boiling fluid, the critical heat flux (CHF) is the highest heat flux that can be exchanged, before the individual vapor bubbles merge into a vapor layer that insulates the surface from the liquid. Optimizing CHF can be seen as optimizing the heat transport, in the sense implied by the first principle of thermodynamics.
A second measure of performance of phase change heat transfer is the heat transfer coefficient, HTC = q″/ΔΤ, the ratio of the heat flux q″ to the difference in temperature between the solid surface and the fluid. HTCs are a measure of thermodynamic efficiency of heat transport, in the meaning of the second law. HTCs associated with phase change are typically one to two orders of magnitude larger than HTCs in single phase, because the latent heat minimizes ΔΤ.
The characteristics of a solid surface that maximize HTC depend on the fluid and the ΔΤ. The largest HTCs are typically achieved in regimes where both the continuous and discrete phases are in contact with the solid surface, such as the nucleate boiling regime or the analogous regime of dropwise condensation (DwC). Reference Patankar21 In these regimes, the solid surface interacts with multiple liquid and vapor volumes, maximizing interfacial and convective transport. For that reason, wettability engineering could play a critical role to improve phase change heat transfer.
If q″ is increased beyond CHF, the HTC is drastically reduced because heat is no longer transferred convectively but radiatively. This causes a significant and often destructive surface temperature increase, Reference Ahn, Lee, Kim, Jo, Kang, Kim, Shin and Kim22–Reference Leung, Gallivan, Henry and Bankoff24 called dry-out and recently seen in Fukushima, Japan. Reference Kurokawa25 Similar considerations can be made for condensation, where the transition from DwC to film condensation (FC) drastically reduces HTC.
An optimum surface for phase change heat transfer is therefore a surface that optimizes heat transport according to the first and second principles of thermodynamics.
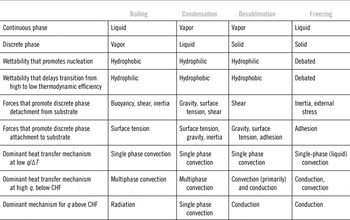
Phase change heat transfer is difficult to model or investigate experimentally, because it is a transient and multiscale phenomenon involving dynamic motion of multiple interfaces. The inherent complexity of phase change heat transfer appears in Table 1, which lists the forces and mechanisms governing the associated transport of heat and mass. Traditionally, the relative importance of pairs of forces or mechanisms is expressed with dimensionless numbers. Heat and mass transport is characterized with the Fourier, Biot, Nusselt, and Jakob numbers. Fluid flow is characterized with the Reynolds, Bond, Weber, Froude, capillary, and Galilei numbers, as well as the drag coefficient. The relative importance of fluid flow transport – as compared with heat and mass transport – is expressed in terms of the Prandtl, Schmidt, Grashof, and Eckert numbers. The influence of geometric/physical properties is expressed with numbers such as void fraction, wetting angle, density ratio, viscosity ratio, and surface roughness. This extraordinary large quantity of twenty dimensionless numbers suggests that phase change heat transfer cannot be described with general theories, and that full similarity is impossible to obtain in experimental studies. Reference Kim26
List of the fluid phases for typical phase change heat transfer processes, with the mechanisms and forces involved.

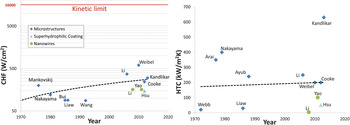
Finally, let us consider how the development of micro- and nanotechnologies has impacted phase change heat transfer over the last 40 years. Drastic improvements have been made in implementing phase change heat transfer solutions closer to the heat source, Reference Bar-Cohen, Arik and Ohadi6 as in electronics packaging. However, has the development of micro- and nanotechnologies improved the primary performance of surfaces for phase change heat transfer, such as the CHF and HTC? Figure 4 shows that, for the widely studied process of water boiling on a copper surface, HTCs have been stable over the last 40 years, while CHFs have increased by a factor 2-3. These improvements are significant; however, several other technologies, such as computing power or energy density in batteries, have improved their performance by orders of magnitude over the same 40 years. Also, the theoretical limits of these improvements are either largely unknown or much higher, as exemplified by the “kinetic limit” obtained using the kinetic theory for the maximum heat flux. This limit can be reached if all molecules are emitted at the speed of sound from the liquid–vapor interface. As established by Schrage, Reference Schrage27 for water at atmospheric pressure, the kinetic limit is defined as q CHF, K = 0.741cρv h fg ≈ 1.6 × 10⁴ W cm−2, where c is the speed of sound and ρv is the vapor density; this value is plotted in red in Fig. 4. In that context, it seems worthy to review the fundamental mechanisms that govern phase change heat transfer, and new ways of engineering surfaces to enhance these mechanisms, with the ultimate goal to raise the practically attained performance closer to theoretical limits.
In the representative process of water boiling on a heated copper surface, 40 years of micro- and nanoengineering of surfaces have not significantly improved HTCs (at ΔT = 5 K). CHF values remain well below the thermodynamic limit. Studies Reference Corman and McLaughlin28–Reference Nakayama, Daikoku, Kuwahara and Nakajima32, Reference Li and Peterson34–Reference Kandlikar38, Reference Webb118, Reference Liaw and Dhir168, Reference Hsu and Chen182, Reference Yao, Lu and Kandlikar234 are referenced with the name of the first author. Note that CHF is also a function of heater size (Ref. 52).

Characteristics of optimum surfaces for boiling heat transfer
Boiling is a multiphase and multiscale energy transfer process from a heated surface to a liquid resulting in its vigorous vaporization. The first boiling curves, relating the heat flux to the superheat temperature of a solid surface, were measured by Nukiyama. Reference Nukiyama39 Applications of boiling vary, but in general, surfaces can be engineered to facilitate nucleation or maximizing the CHF by preventing film boiling. Reference Schrage27,Reference Mikic and Rohsenow40–Reference Hummel51 Let us describe here the physical aspects of the nucleation process, nucleate boiling and CHF, with emphasis on the contributions of the solid–fluid interface.
As a starting point, we summarize the thermodynamic processes of vapor formation in boiling, based on the extensive descriptions in Refs. Reference Collier5 and Reference Carey52. In Fig. 3, the solid line corresponds to the coexistence or binodal curve, where both liquid and vapor can exist in a stable state. Metastable states can also exist in the vicinity of the binodal curve. For instance, point A is a metastable liquid state, and B a metastable vapor state.
Nucleation
Nucleation can occur at a solid surface, or within the bulk of the metastable liquid; the former process is called “heterogeneous nucleation,” while the latter is called “homogeneous nucleation.” Equilibrium thermodynamics can be used to predict the conditions for the incipience of boiling, i.e., the generation of a stable vapor nucleus.
For a closed system at thermodynamic equilibrium, constant pressure and temperature, boiling occurs under conditions of thermal, mechanical, and chemical equilibrium. Reference Carey52 The thermal equilibrium means that the temperatures of the vapor phase and the liquid phase are equal. The radius r* of a vapor nucleus in mechanical equilibrium with the surrounding liquid is given by the Young–Laplace equation
 $${p_{\rm{V}}} - {p_{\rm{L}}} = {{2\sigma } \over {{r^*}}}\quad .$$
In engineering systems, the requirement of chemical equilibrium corresponds to p V ≈ p sat, i.e., p C ≈ p E (in Fig. 3 for a pure liquid). Thus, boiling involves the phase change of a metastable liquid at a pressure lower than the saturated pressure (point A at T L and p L in Fig. 3) into a stable vapor phase (point C, usually approximated by E at T L and p sat > p L).
The superheat temperature ΔT = T L − T sat required for a nucleus to grow spontaneously is obtained from the pressure difference in Eq. (1), often using a linear approximation of the P–T saturation curve Reference Carey52 as
 $$\Delta T = {{{\rm{d}}T} \over {{\rm{d}}P}}{{2\sigma } \over {{r^*}}}\quad .$$
The incipience of boiling can be determined by considering the evolution of vapor nuclei. Nuclei occur naturally in the bulk liquid by density fluctuations, and may either collapse or grow depending on their Gibbs free energy Reference Collier5
 $$G_{{\rm{hom}}} = 4\pi r^2 \sigma \left( {1 - {{2r} \over {3r^* }}} \right)\quad .$$
The Gibbs free energy corresponds to the thermodynamic work required for the creation of a nucleus with radius r in the bulk fluid. By the second principle of thermodynamics, the nuclei that will grow spontaneously are the ones with
 ${{\partial G_{{\rm{hom}}} } \mathord{\left/ {\vphantom {{\partial G_{{\rm{hom}}} } {\partial r}}} \right. \kern-\nulldelimiterspace} {\partial r}} \le 0$
. From Eq. (3), G
hom is maximum at r*, and only the nuclei with r > r* will grow spontaneously.
Reference Frenkel53
In engineering systems, the incipience of boiling corresponds to the production of stable vapor nuclei at a rate J of 103–107 cm−3 s−1, with J depending exponentially on the ratio of the free energy of the equilibrium vapor nucleus, over the Boltzmann constant k
B times the system temperature
Reference Collier5
 $$J\~C\exp \left( {{{ - {G_{{\rm{hom}}}}({r^*})} \over {{k_{\rm{B}}}{T_{\rm{L}}}}}} \right)\quad ,$$
with C being a function of the liquid properties. For water at atmospheric pressure, a nucleation rate J = 107 cm−3 s−1 corresponds to a superheat temperature of 204 °C with pressure difference larger than 8 atm and vapor nuclei with sizes O(30 nm). These temperature and pressure values are much larger than experimental values on technical surfaces, where the onset of nucleate boiling typically occurs at a superheat of 6–10 °C. Reference Basu, Warrier and Dhir54,Reference Knapp55 Homogeneous nucleation appears therefore to play a weak role in boiling applications.
Indeed, it is commonly assumed that the solid–fluid interface facilitates the nucleation process. This ‘heterogeneous nucleation’ process is described, for atomically smooth surfaces, by a reduction of the free energy when nuclei are created on a surface Reference Bankoff56
 $${G_{{\rm{het}}}} = \phi \;{G_{{\rm{hom}}}},\;{\rm{with}}\;\phi = {{2 + 2\cos \theta + \cos \theta {{\sin }^2}\theta } \over 4}\;{\rm{and}}\;J\~{C^{2/3}}\exp \left( {{{ - {G_{{\rm{het}}}}({r^*})} \over {{k_{\rm{B}}}{T_{\rm{L}}}}}} \right)\quad .$$
Here, θ is the wetting angle, as defined in section “Wettability engineering”, and K depends on the physical properties of the liquid and the solid. Heterogeneous nucleation is observed for J = O(1010 m−2 s−1). Reference Carey52 For superhydrophobic surfaces, ϕ tends exponentially toward 0, so that nucleation occurs at negligible superheat; for metallic surfaces with θ ≈ 30°, ϕ tends toward 1, negating the thermodynamic advantage of nucleating on a surface rather than in the bulk. In fact, the superheat estimated using the above two equations (ΔT ≈ 188 °C for smooth Teflon with θ = 120° or 211 °C for smooth metal with θ = 30°) is again much higher than the 6–10 °C superheat observed with water on real surfaces.
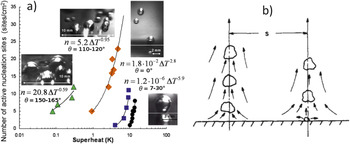
In fact, surfaces typically facilitate nucleation because of their natural pits and cavities. Gas or vapor entrapped in these geometries enhances the process of heterogeneous nucleation. Rigorous analysis of how a complex geometry enhances nucleation is possible and presented in section “Engineered surfaces for boiling heat transfer.” It is however a challenging task given the inherent randomness in surface texture and chemistry. As a result, experiments are typically conducted to measure the rate of nucleation or the spatial density of active nucleation sites n. Qi and Klausner
Reference Qi and Klausner57
describe the influence of the material and surface texture on the density of nucleation sites. Wang and Dhir
Reference Wang and Dhir42
used optical microscopy to measure distributions of cavity sizes on surfaces with different wettabilities (θ = 90°, 35°, and 18°). They obtained a distribution of cavities of the form
 ${n_{\rm{s}}} \propto {D^{ - m}}$
with 2 < m < 5.4, depending on the diameter of the cavity mouth D. They also found the number of active nucleation sites n to be proportional to (1 − cosθ)D
−6. Recently, Betz et al.
Reference Betz, Jenkins, Kim and Attinger58
measured n as a function of ΔT for a wide range of wetting angles [Fig. 5(a)]. They found that nucleation occurred on a superhydrophobic surface at superheats that were two orders of magnitude lower than those on a smooth hydrophilic surface.
Boiling occurs over a wide range of length scales. Plot (a) shows how nucleation is influenced by the surface microtexture and chemistry, that is the wettability, Reference Betz, Jenkins, Kim and Attinger58 with θ denoting the wetting angle, as defined in section “Wettability engineering”. In nucleate boiling (b), the length scales Reference Tien59 range from micrometer (the thermal boundary layer), to millimeter (the bubble diameter), to centimeter (the pitch s between bubble columns). Figure (a) is reprinted from Ref. Reference Betz, Jenkins, Kim and Attinger58, copyright 2013, and (b) is reprinted from Ref. Reference Tien59, copyright 1962, both with permission from Elsevier.

For real surfaces, a general trend similar to the one obtained on ideal surfaces is illustrated in Fig. 5(a): the lower the surface wettability, the lower superheat needed for nucleation.
Nucleate boiling
At higher superheat, sufficient to sustain the quasi-steady regime of nucleate boiling (see Fig. 2), the heat and mass transfer is complex and transient, involving (i) convective heat transport driven by buoyancy and moving bubbles, Reference Mikic and Rohsenow40,Reference Forster and Zuber60,Reference Haider and Webb61 (ii) evaporation at the surface and wetting line of the growing bubbles, Reference Utaka, Kashiwabara and Ozaki62,Reference Cooper and Lloyd63 and (iii) motion of the wetting line in the presence of fast evaporation. Reference Han and Griffith8,Reference Rohsenow64 Numerous models have been proposed to describe nucleate boiling. Reference Dhir65 For instance, Fig. 5(b) shows the inverted stagnation flow model of Tien, Reference Tien59 widely used to estimate the HTC in nucleate boiling. It assumes a similarity between the hydrodynamic flow of a bubble column rising from a heated surface and the stagnation flow against a wall, and illustrates the wide range of length scales present in boiling.
Most models of nucleate pool boiling describe the heat flux as a power law Reference Carey52 :
 $$q \propto \Delta T^A {\rm{ }}n^B $$
with 1 ≤ A ≤ 1.8 and 0.3 ≤ B ≤ 0.5. A numerical study of Abarajith and Dhir Reference Abarajith and Dhir66 investigated the influence of the wetting angle on the growth and departure of a single bubble. The simulation method was based on the finite-difference method with interface reconstruction by the level set method. The contact angle was varied from 1° to 90° by changing the Hamaker constant, and HTC was found to increase with increasing contact angles for moderate levels of superheat.
When the heat flux increases, transition from nucleate to film boiling occurs, and radiative heat transport becomes the dominant transport mechanism. The CHF is the maximum heat flux reached at this transition, and its mechanism has been considerably investigated because of its industrial relevance. Reference Kutateladze67 For hydrophilic systems, the model by Zuber Reference Zuber46 considers that at high heat flux, single bubbles coalesce to form vapor columns. A velocity shear between the bulk liquid and these columns is induced by buoyancy, and CHF occurs when the resulting Helmholtz instability merges columns into a vapor layer, insulating the heated surface from the liquid. Reference Carey52 Lienhard and Dhir Reference Lienhard and Dhir68 refined this model, assuming that the pitch between the columns equals the wavelength of Rayleigh–Taylor instabilities. They obtained the following equation for the heat flux at CHF:
 $${q_{{\rm{CHF}}}} = {C_{\rm{L}}}{\rho _{\rm{V}}}{h_{{\rm{LV}}}}{\left[ {{{\sigma g({\rho _{\rm{L}}} - {\rho _{\rm{V}}})} \mathord{\left/ {\vphantom {{\sigma g({\rho _{\rm{L}}} - {\rho _{\rm{V}}})} {{\rho _{\rm{V}}}^2}}} \right. \kern-\nulldelimiterspace} {{\rho _{\rm{V}}}^2}}} \right]^{1/4}}$$
where C L is a constant equal to 0.149 (Ref. Reference Lienhard and Dhir68) or 0.131. Reference Zuber46
A second model by Haramura and Katto Reference Haramura and Katto69 assumed that the Helmholtz instability along large vapor bubbles results in the formation of a stable liquid microlayer between the heated surface and the bubbles. Small Helmholtz-stable vapor jets pierce the liquid microlayer, connecting the nucleation sites with the bubbles. CHF occurs when the microlayer has totally evaporated. Experimental studies with water were found in very good agreement with this model. Reference Carey52
The two hydrodynamic models above assume a very wettable surface. The effect of wettability on CHF has been studied experimentally, Reference Berenson50,Reference Bui and Dhir70 establishing that hydrophobic surfaces have lower CHF than hydrophilic surfaces.
The effect of wettability on CHF was modeled analytically by Kandlikar, Reference Kandlikar71 who proposed that CHF occurs when the momentum flux caused by evaporation at the contact line overcomes gravity and surface tension forces, creating a vapor blanket. This can be modeled replacing the constant C L by a function of θ in Eq. (7). Dhir and Liaw Reference Dhir and Liaw72 developed a computational model valid from nucleate to transition boiling, assuming that the energy from the superheated wall is transferred by conduction through the microlayer. Their results estimated CHF for mostly nonwetting surface, with θ as a parameter. Finally, Theofanous Reference Theofanous, Dinh, Tu and Dinh48 suggests that “CHF is controlled by the microhydrodynamics and rupture of an extended liquid microlayer, sitting and vaporizing autonomously on the heater surface,” a process which is influenced by surface wettability.
From this body of experiments and theories, a dilemma appears given the above considerations on nucleation and CHF. On the one hand, HTCs at low heat flux are enhanced on surfaces with low wettability. On the other hand, HTCs at high heat fluxes are enhanced on surfaces with high wettability, and so is the CHF.
Characteristics of optimum surfaces for condensation heat transfer
Like boiling, condensation is a multiscale and multiphase phenomenon. In technical applications, condensation refers to the phase change of a metastable vapor (point B in Fig. 3) into a stable liquid (point D). Condensation has been studied on typical engineering geometries, along plates and channels, or inside channels, as reviewed in Ref. Reference Kandlikar and Garimella73. For the sake of simplicity, this review is focused on external condensation, which may occur either as a liquid film (FC) or in the form of individual drops (DwC), see Table 1. DwC is facilitated for fluids with high surface tension or on low-energy surfaces, Reference Rose74 and occurs via the quasi-steady process described in Fig. 2. For many engineering applications, the condensate is water which tends to wet metal surfaces, and the condensing droplets eventually end up forming a film on the surface, leading to FC. By its geometry and multiphase structure, DwC is a process analog to convective boiling. DwC typically occurs in dehumidification or ammonia-based processes, while FC is prevalent in most other technical applications.
When the affinity between the condensing liquid and the solid surface is high, droplets of condensate nucleate on myriads of nucleation sites (nanoscale surface defects) on the cooled substrate. The droplets grow by sustained condensation caused by continuous cooling; droplet growth also occurs by impact and coalescence during the sliding of drops caused by gravity or by coalescence induced by droplet growth. Reference Graham and Griffith75 Heat transfer takes place from the gas phase to the substrate through the condensing droplets (except on areas that are not covered with droplets, where the heat transfer is direct). In DwC, progressive coalescence exposes new domains on the substrate for fresh nucleation and growth. DwC has received much attention from the heat transfer community due to its potential to produce HTCs that are an order of magnitude larger than in the FC mode. Reference Bejan76 Despite the initial promise for high performance, and extensive research over several decades – barring a hiatus in the '90s – achievement of sustained DwC has remained elusive till this date. The DwC process, its performance and technical applications have been extensively reviewed in Ref. Reference Rose74, which also describes a theoretical prediction of the HTC. Several groups have made notable contributions to the theoretical and experimental characterization of DwC and the pertinent heat transfer correlations since its first report. Reference Schmidt, Schurig and Sellschopp77
The mechanism responsible for DwC is subject to debate, Reference Carey52 be it either drops nucleating and growing on a dry surface Reference Glassford78 or drops resulting from the breakup of an unstable thin film. Reference Chen, Chen and Lee79 The process of heterogeneous nucleation relies on reducing the Gibbs free energy associated with the creation of solid nuclei on the condensing surface. As in the case of boiling in section “Characteristics of optimum surfaces for boiling heat transfer”, the Gibbs free energy for heterogeneous nucleation of condensate also depends on the homogeneous free energy and the liquid contact angle (in its vapor), so that
 $$\Delta {G_{{\rm{het}}}} = \Delta {G_{{\rm{hom}}}}\phi ,\;{\rm{with}}\;\phi = {1 \mathord{\left/ {\vphantom {1 4}} \right. \kern-\nulldelimiterspace} 4}\left( {2 - 2\cos \theta - \cos \theta {{\sin }^2}\theta } \right)\quad .$$
The factor ϕ in Eq. (8) is the analog to that in Eq. (5), which implies the exact opposite trend as in boiling, that is, heterogeneous nucleation in condensation is easier on a hydrophilic surface rather than on a hydrophobic one.
Theoretical models
Reference Le Fevre and Rose80–Reference Rose82
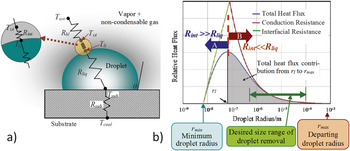
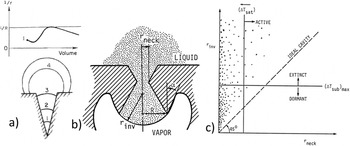
to predict DwC heat transfer rates typically consider the heat transfer across a single hemispherical condensing droplet as shown in Fig. 6(a). The temperature difference ΔT = (T
υ∞ − T
cool) that drives the heat flux is partly offset by the subcooling required to condense on a convex liquid droplet of radius r. The subcooling can be approximated as
 $\Delta T \cong {{2T_{{\rm{sat}}} \sigma } \mathord{\left/ {\vphantom {{2T_{{\rm{sat}}} \sigma } {\rho h_{{\rm{fg}}} r}}} \right. \kern-\nulldelimiterspace} {\rho h_{{\rm{fg}}} r}}$
, with h
fg
the latent heat, combining Eq. (2) and the Clausius–Clapeyron equation, and the same equation can be used to estimate the minimum viable droplet radius for a given subcooling ΔT, see Fig. 6(b).
Thermal aspects and length scales in dropwise condensation (DwC). (a) Schematic representation of thermal resistances associated with DwC [R bl: vapor boundary layer thermal resistance (present if the vapor phase has noncondensable gases), R int: vapor–liquid interface thermal resistance, R liq: liquid conductive thermal resistance, R sub: substrate thermal resistance. Temperature legends – T υ∞: far stream vapor; T υi: interface (vapor side); T li: interface (liquid side); T sub: substrate (droplet base); T cool: subcooled surface]. (b) Influence of the drop size on the relative heat flux contributions. Reprinted from Ref. Reference Bonner90, copyright 2013, with permission from Elsevier.

Resistances to DwC heat transfer are due to thermal conduction (R liq) through the liquid drop and mass transfer at the liquid–vapor interface (R int). Reference Carey52 The substrate thermal resistance (R sub) may also play a role due to droplet recalescence, i.e., the rejection of the latent heat of condensation. Reference Mikic83 On an actual condensing substrate, droplets of different sizes coexist: the ratio of the number of largest drops (∼1 mm) to the smallest drops (1 nm) being typically 106. For inclined surfaces, the largest size r max at which the droplet slides by gravity is found to increase with increasing liquid surface tension and contact angle hysteresis, and decreases with increasing equilibrium contact angle and tilt angle. Reference Quere, Azzopardi and Delattre84
The determination of the overall condensation HTC across the condenser surface requires integrating the heat flux at each droplet base, as obtained from the thermal resistance model described in Fig. 6(a) over the entire spectrum of droplet sizes (r min < r < r max) and estimating the driving degree of subcooling ΔT = (T υ∞ − T cool). A closed form solution of this model does not exist, and even numerical solutions are challenging due to the large range of droplet sizes involved, see Fig. 6(b). Measurements show that the drop-size distribution follows a statistically time-invariant pattern. For smaller droplets with r min < r < r E , where r E = (4n)−1/2 with the nucleation site density n on the order of 1013–1015 m−2 (Ref. Reference Kim and Kim85), the distribution of drop sizes can be obtained from a population balance. Reference Tanaka86 For larger droplets with r E < r < r max, the fractional surface area covered by a droplet with base radius greater than r follows the distribution in Refs. Reference Graham and Griffith75, Reference Tanaka86, and Reference Wu, Yang and Yuan87. Substantial effort has been expended in numerical simulations of droplet nucleation Reference Ulrich, Stoll and Pefferkorn88 and drop growth and coalescence. Reference Wu, Yang and Yuan87
Besides the thermophysical properties of the fluid and the solid substrate, the HTC in DwC also depends on other key parameters like degree of subcooling, heat flux, maximum droplet radius, presence of noncondensable gases, and gas phase pressure. The HTC increases with the degree of subcooling or the surface heat flux due to enhanced activation of nucleation sites. Reference Wenzel89 The droplet size also has an impact on HTC. Bonner Reference Bonner90 showed that for droplet radii less than a few hundred nanometers, the overall heat transfer is limited by R int, while for larger droplets, the influence of R liq dominates [see Fig. 6(b)]. Effective DwC technologies, therefore, should typically aim at removing the droplets from the surface before they grow too large, preferably at an order of magnitude lower than the capillary length of the liquid. Reference Boreyko and Chen14 Interestingly, the HTC is severely reduced in the presence of even minute amounts of a noncondensable gas Reference Rose74,Reference Ma, Zhou, Lan, Li and Zhang91 : HTCs are reduced by up to 30% for DwC Reference Grooten and van der Geld92 and 50% for FC Reference Minkowycz and Sparrow93 with a concentration of noncondensable gas of 0.5% by volume. This illustrates that noncondensable gases influence the nucleation process in condensation, as they also do in boiling. Besides, the presence of air adds a diffusion resistance (R bl) to steam–air boundary layers Reference Minkowycz and Sparrow93 [see Fig. 6(a)] and alters the relative contribution of latent and sensible heat transfer. Reference Grooten and van der Geld92 Most importantly, several industrial applications involve condensation of binary fluids, where Marangoni stresses promote similar structures to DwC. Reference Utaka and Nishikawa94,Reference Utaka and Kamiyama95 Vapor-side pressure influences the HTC primarily through the R int. Tanasawa Reference Tanasawa96 reported that for water vapor DwC, HTC varied from 0.383 MW m−2 K−1 at 0.01 atm to 15.7 MW m−2 K−1 at 1 atm.
Forces responsible for the removal of the condensate are different in nature and weaker in condensation than in boiling, see Table 1. This removal typically occurs by shear or gravity forces; rather than shear and buoyancy in boiling.
When the solid surface removes less condensate than that condensing on the surface, a thick film forms on the surface, and FC occurs. FC typically features one order of magnitude lower HTCs than DwC, Reference Carey52 because (i) much of the condensing surface that is covered with the liquid film cannot offer heterogeneous nucleation sites, and (ii) the liquid film offers a considerable thermal resistance.
The transition from drop- to film-wise condensation, schematically shown in Fig. 2, is a process similar to the boiling transition from nucleate to film boiling, and similarly, it is poorly understood. A typical value of the peak heat flux corresponding to that transition for steam is 10 MW m−2, as reported in Ref. Reference Rose74. At least two transition mechanisms have been proposed for the transition from DwC to FC Reference Rose74 : (i) under high heat flux, the droplet growth rate exceeds the condensate removal rate, leading to increased coverage of condenser surface area by the condensate and merging, or (ii) the density of active nucleation sites increases with increasing ΔT, leading to a situation where condensates from neighboring active nucleation sites merge into a wetted patch.
Nusselt provided a simple model for HTC in FC, assuming laminar flow, pure vapor and negligible convection Reference Nusselt97
 $${\rm{HTC}} = 0.943{\left[ {{{{\rho _{\rm{L}}}\left( {{\rho _{\rm{L}}} - {\rho _{\rm{V}}}} \right)g{h_{{\rm{fg}}}}{k_{\rm{L}}}^3} \over {{\mu _{\rm{L}}}L\left( {{T_{\upsilon \infty }} - {T_{{\rm{cool}}}}} \right)}}} \right]^{1/4}}$$
,
with L, μL, and k L standing, respectively, for the length of a vertical plate, viscosity of the liquid, and thermal conductivity of the liquid. Later, Rohsenow Reference Rohsenow98 included thermal advection effects with a latent heat term that depends on the Jakob number.
To summarize, the salient issues specific to condensation on solid substrates are (i) the design of substrates that promote heterogeneous nucleation, and (ii) the efficient drainage of the film or the evacuation (removal) of the drops from the condensing surface. The first factor bears a direct influence of the surface wettability, while the second depends both on the condensing surface and the acting physical forces.
Characteristics of optimum surfaces for freezing and desublimation
As per the definitions related to Fig. 3 and Table 1, there are at least eight terms describing phase change from or toward the solid phase. Solidification (freezing) commonly occurs in technological processes, such as free-form manufacturing, rapid prototyping, metals processing, microelectronic fabrication, etc. Despite the large number of technologically relevant fluids that can undergo solidification, for the sake of simplicity, this section concentrates only on aqueous systems.
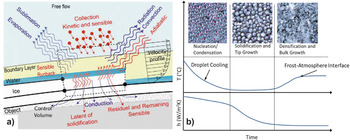
During the densification and bulk-growth phase, the frost thickness and density increase, resulting in significantly lower thermal conductivity and reduced heat transfer, see Fig. 7(a). Eventually, the frost thickness reaches a maximum, as shown in Fig. 2: the temperature of the frost surface is no longer cold enough to promote further frost growth, and an equilibrium heat flux is reached. Reference Thibaut Brian, Reid and Shah99 Measuring HTCs in freezing configurations poses formidable challenges, as roughness changes continuously on ice-covered surfaces. The roughness controls the boundary layer structure in the vicinity of the solid, in turn affecting the convective flow structure around the body, the resulting heat transfer and the droplet collection efficiency, which in turn, influence the ice shape. Reference Fortin, Laforte and Ilinca100 The high dependence of HTC on the specific conditions of each problem prevents generalizations and makes the development of HTC correlations difficult. HTCs up to 2 kW m−2 K−1 have been measured for ice accreted on airfoils in wet (vapor rich) and dry (vapor poor) regimes. Reference Fortin, Laforte and Ilinca100 For water frosts deposited on a cooled plate from a humid air stream, HTCs in the range 20–60 W m−2 K−1 were reported. Reference Thibaut Brian, Reid and Shah99 Various correlations for HTC under frosting conditions as related to refrigeration applications are given in the review by Iragorry et al. Reference Iragorry, Tao and Jia101
Thermal aspects and spatial features in icing and frosting. (a) Schematic depiction of processes involved in ice accretion on the top of a solid object exposed to a free flow in conditions conducive to freezing. Reprinted from Ref. Reference Fortin, Laforte and Ilinca100, copyright 2005, with permission from Elsevier. (b) Photographs (top) of the three stages of condensation frosting on a hydrophilic surface shown with the corresponding temporal evolution of temperature and HTC (bottom). Pictured areas are 1 mm × 1 mm, from coauthor A.R.B.

For most technical applications, ice and frost have negative consequences and surfaces that mitigate their buildup are desired. For example, in refrigeration systems, frost can form an insulating layer which impedes heat transfer Reference Iragorry, Tao and Jia101,Reference Piucco, Hermes, Melo and Barbosa102 or increase pressure drop in ducts. Ice formation on planes can prevent the movement of ailerons and decrease aircraft safety. Ice can also adversely impact the safety and operation of wind turbines, marine vessels, and offshore oil platforms. Reference Ryerson103 Moreover, frost and ice buildup can make systems brittle or heavy, leading to catastrophic failure. For applications where frost avoidance is desired, an ideal surface must prevent nucleation.
Freezing/Icing
The formation of ice from a metastable supercooled liquid occurs via ice nuclei, i.e., tiny transient crystalline clusters existing in various sizes within the water phase. Continuous size fluctuations of these clusters occur due to the simultaneous addition of molecules and detachment of the same. Based upon the various thermodynamic parameters, the nucleus size may grow large enough to become stable, i.e., for growth to become more probable than decay. This designates the critical size for stability, and hence further nucleation of the solid phase. Stability of ice nuclei mainly depends upon their surface-to-volume ratio. As the size of the ice phase increases, this ratio decreases, thus making the number of molecules returning to the liquid from the ice surface far less significant compared to the number of interior molecules, hence establishing stability of the nucleus and facilitating growth. Nucleation of this type is known as homogeneous nucleation. There exists another type of nucleation where the nucleus forms on some pre-existing solid structure, thus making the stability of the nucleus more probable. This type of nucleation is known as heterogeneous nucleation and is far more common than homogeneous nucleation due to its smaller free energy barrier, as described in section “Characteristics of optimum surfaces for boiling heat transfer”. Hence, heterogeneous nucleation is sought for technical applications; it is also similar to the nucleation process discussed in the condensation section. As seen from Eq. (8), which also applies here, increasing the contact angle delays condensation, and thus ice formation. Reference Fletcher104–Reference Cao, Jones, Sikka, Wu and Gao110 In fact, since high contact angles decrease the contact area between the water and the cold surface, if the pressure is high enough to condense first and then freeze water, the decreased contact area will slow heat transfer and delay freezing time. Reference Jung, Dorrestijn, Raps, Das, Megaridis and Poulikakos105 Additionally, low energy surfaces usually have low adhesion to water and ice Reference Jung, Dorrestijn, Raps, Das, Megaridis and Poulikakos105 ; coupled with engineered forced convection, these surfaces efficiently prevent ice buildup.
In addition to ice formation within the liquid water phase, ice can also form on a solid surface directly from the vapor state; this phenomenon is known as desublimation or atmospheric deposition. The term frosting is also used to describe this process (see section “Characterization of phase change heat transfer”).
Desublimation/Frosting
Frost is formed when humid air comes in contact with a solid surface at a temperature below the freezing temperature of water. Frost can form either by condensing then freezing or directly through solid deposition. Reference Fletcher104 In the former, frost formation has two distinct phases similar to the condensation process: nucleation and growth. Before frost forms, the heat transfer is dominated by single phase convection. At the onset of nucleation, heat transfer is dominated by multiphase convection. In frosting, nucleation depends on surface structure and the availability of nucleation sites.
Several studies have been conducted on the ice/frost repellency of superhydrophobic surfaces. Reference Mishchenko, Hatton, Bahadur, Taylor, Krupenkin and Aizenberg20,Reference Jung, Dorrestijn, Raps, Das, Megaridis and Poulikakos105,Reference Cao, Jones, Sikka, Wu and Gao110 Due to the increased surface area and roughness, some superhydrophobic surfaces have also shown increased frost nucleation compared to smooth hydrophobic surfaces. Reference Jung, Dorrestijn, Raps, Das, Megaridis and Poulikakos105,Reference Varanasi, Deng, Smith, Hsu and Bhate108 Other research has also shown that a low contact angle hysteresis prevents frost nucleation. Reference Kim, Wong, Alvarenga, Kreder, Adorno-Martinez and Aizenberg111 Kim et al. Reference Kim, Wong, Alvarenga, Kreder, Adorno-Martinez and Aizenberg111 studied liquid-infused porous surfaces, which provide a defect-free molecularly flat liquid interface, while maintaining a high contact angle. The lowest rates of frosting were observed on surfaces that had both a high contact angle and low contact angle hysteresis.
After nucleation and cooling, frost goes through two distinct growth phases, see Fig. 7(b). First, the frost goes through the solidification and tip growth stage, with conduction and multiphase convection dominating the heat transfer. Then, during the densification and bulk-growth stage, the temperature increases at the interface between the frost and the atmosphere and the frost layer eventually reaches an equilibrium thickness and temperature with the environment. During this period, the heat transfer is dominated by conduction. The final frost thickness depends on the surface temperature and relative humidity. The thermal conductivity of the surface has been shown to affect frost growth. Reference Jung, Tiwari and Poulikakos112 On low thermal conductivity surfaces, a supercooled millimeter-sized droplet freezes slowly, with evaporation triggered by the latent heat released upon recalescent freezing. Eventually, the gas volume around the droplet reaches saturation and vapor microdroplets coalesce to form droplets that deposit around the main droplet, eventually crystallizing and forming a frost halo. Experiments in Ref. Reference Jung, Tiwari and Poulikakos112 under controlled humidity conditions establish how a balance between heat diffusion and vapor transport determines the final expansion of the frozen condensate halo, which, in turn, controls frost formation and propagation.
The surface energy may also influence the frost growth and density. Reference Lee, Shin, Ha, Choi and Lee109 Once a thin layer of frost is deposited, the surface energy of the base surface should no longer affect the growth of subsequent frost. Reference Na and Webb107,Reference Na and Webb113 However, the surface energy influences the initial shape of the crystal, therefore modifying the kinetics and changing the dendritic frost growth patterns. Reference Lee, Shin, Ha, Choi and Lee109,Reference Liu, Zhang, Wang, Meng and Cheng114,Reference Le Gall, Grillot and Jallut115 Experimental evidence suggests that hydrophilic surfaces produce a higher density frost, Reference Liu, Zhang, Wang, Meng and Cheng114 while hydrophobic surfaces form more dendrites creating a looser frost structure. Reference Liu, Zhang, Wang, Meng and Cheng114
In summary, surfaces with low wettability prevent, delay, or slow down the formation of ice from a metastable, supercooled liquid. The role of roughness on frost formation is not clear at present. Also, the more wettable the surface, the denser the frost layer.
State of the art methods for micro- and nanofabrication of surfaces
Several approaches and numerous techniques are available to fabricate the surfaces of interest for phase change heat transfer. The phase change on a solid surface is affected by the energy and texture of the surface. The surface energy is of chemical nature but manifests itself physically as a contact angle. Aside from some practical issues, such as changes over time and temperature, the surface energy is a relatively simple parameter as it is inherent to each material. The surface texture, on the other hand, is geometric in nature and can have many variables, such as pitch (periodicity), spacing, depth, shape, and randomness. Another important variation for phase change heat transfer is the local control of the surface energy and texture, i.e., a surface can juxtapose regions with different chemistries and textures. These infinite possibilities of multiscale spatial arrangements leave ample room for heat transfer enhancement. Here we discuss the fabrication methods used to control the energy and texture of surfaces for phase change heat transfer.
Surface machining and roughening
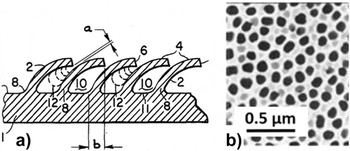
Compared with a smooth surface, a roughened surface enhances the phase change heat transfer by increasing the net contact area for heat transfer and the number of nucleation or precipitation sites. Reference Webb116 To roughen the surface, various mechanical methods have been used, such as sandpapering and abrasive blasting. Reference Berenson117 The surface structures obtained are relatively simple, i.e., consisting essentially of low peaks and valleys, and randomly distributed. Conventional machining has also been used to obtain more elaborate surface structures aimed specifically to enhance nucleate boiling, e.g., Fig. 8(a). These surface structures show a regular pattern due to the sequential nature of the sharp-tip machining processes. Chemical and electrochemical methods can produce more pronounced and complex structures, such as porous surfaces, e.g., Fig. 8(b). The surface structures are randomly distributed, but the roughness parameters (e.g., average pitch, porosity) can be controlled by the processing conditions, such as etchant chemistry, etching time, and current density. The roughening processes are suitable for large area and mass manufacturing, while the machining processes are less economical. Because of their high thermal conductivity, metallic surfaces are preferable for phase change heat transfer.
Examples of surface machining and roughening: (a) machined surface with bent fins to enhance nucleate boiling, from patent Reference Webb118 ; gap a is in the 25–125 μm range; (b) electrochemically processed porous alumina (AnodiscTM).

Surface coating
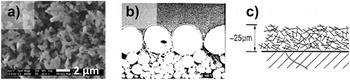
Surface textures can be added on the base surface by coating. Compared with the subtractive methods of the previous section, the coated textures can be more complex in geometry and more versatile in material selection. The texture can be as complex as a three-dimensional porous network, and the material can be a metal, ceramic, polymer, or a combination of them. The coating methods are numerous, including sintering, spray coating, dip coating, plasma coating, electroplating, and gluing, just to name a few. For metal oxides, Zhou et al. Reference Zhou, Izgorodin, Hocking, Spiccia and MacFarlane119 electrodeposited manganese oxide from an ionic liquid to grow a number of different morphologies, including nanoparticles and nanofibers, on glass substrates. Jiang et al. Reference Jiang, Tang, Tay, Zhang, Malyi, Wang, Deng, Lai, Zhou, Chen, Dong and Chen120 used a hydrothermal process to grow titania nanowire arrays and porous frameworks on titanium substrate. For metals, Dhal and Erb Reference Dahl and Erb121 flame-sprayed metal-oxide particles on a metal substrate to form porously interconnected open-cell nucleation sites. Jiang and Malshe Reference Jiang and Malshe122 electrosprayed cubic boron nitride (cBN) particulates with sizes smaller than 2 μm, as shown in Fig. 9(a), on a tungsten carbide cobalt (WC–Co) substrate. While most methods produced random structures over large areas, Kim and Bergles Reference Kim and Bergles123 formed a controlled porous surface by sintering a single layer of large copper particles on a layer of smaller copper particles, as shown in Fig. 9(b). The large pores formed between the large particles on top were intended to promote boiling nucleation, while the small doubly re-entrant cavities formed between the small particles below were to help preserve the trapped vapor during subcooling and assist the incipient nucleation when reheated. Not limited by the material, You and O'Connor Reference You and O'Connor124 developed a method to glue dispersed particles into highly porous structures, as depicted in Fig. 9(c). Because a polymeric material glues the particles together, a wide range of materials can be used as the constituent particles. The resulting porous surface was used to enhance boiling heat transfer for cooling electronics by immersion.
Examples of surface coatings: (a) SEM image of an electrospray boron nitride coating, reprinted from Ref. Reference Jiang and Malshe122, copyright 2011, with permission from Elsevier. (b) Cross-sectional SEM picture of a controlled porous surface fabricated by sintering copper particles of increasing diameters on a copper substrate to study incipient boiling, reprinted from Ref. Reference Kim and Bergles123, permission requested from Hemisphere Publishing. The large particles on top are ∼250 μm in diameter. (c) Schematic of a porous surface obtained by gluing particles for electronics cooling, from US patent. Reference You and O'Connor124

The surface structures made with coating techniques tend to be complex and randomly distributed in size and shape. The size of the structures and the thickness of the coating can vary from a few nanometers to hundreds of micrometers.
Lithographic fabrication
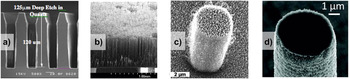
In contrast to the surface roughening and coating processes, which produce mostly a random distribution of certain surface structures and sizes, lithographic processes can produce surface textures of exact shapes and sizes. The lithographic patterns can be at the micrometer scale using standard photolithography or at the nanometer scale using electron-beam lithography. There are other related fabrication methods, such as interference lithography, but they usually have additional limitations. The patterns may be formed by a lithographic process of photoresist coated on the surface or by direct printing using the so-called soft lithography. Using the well-defined patterns as an etching mask, the substrate is carved out by various sophisticated etching processes to create surface textures with depths or heights up to hundreds of micrometer. The etching is usually not performed after soft lithography, which is most convenient when the surface texture is merely a pattern of a thin layer including a chemical coating. Requiring a clean room and expensive equipment, lithographic fabrication is not suitable for large-area applications. However, it provides a unique capability to study the phase change on textured surfaces with sizes and shapes that correspond exactly to the desired designs. Available are a variety of powerful micromachining techniques developed in the field of micro electro mechanical systems (MEMS) as well as conventional microfabrication techniques for integrated circuit (IC) manufacturing. The two main shortcomings of lithography are the cost of fabrication and the limited area (i.e., sample size). If acceptable, soft lithography Reference Xia and Whitesides125 can reduce the cost significantly and interference lithography Reference Lu and Lipson126 can cover a larger area (possibly several meter 127 ). While silicon is the material of choice for lithographic fabrication, other materials such as glass [Fig. 10(a)], polymers and metals [Fig. 10(b)] can also be processed with reduced capabilities (e.g., limited etching depth for glass) or with additional steps (e.g., molding step for metals).
Examples of photolithographic processes to create high aspect ratio geometries and multiscale features on solid surfaces. (a) Cross-sectional SEM picture of glass surface textures fabricated by photolithography and deep reactive ion etching on a glass (quartz) substrate. (b) SEM picture of a dense array of 600 µm-tall freestanding Ni posts (diameter = 5 μm; pitch = 14 μm; height-to-diameter aspect ratio = 120) fabricated by electroplating into deep pores formed by photoelectrochemical etching on silicon wafer. Copyright 2011, IEEE. Reprinted with permission from Ref. Reference Sun, Hur, Zhao and Kim128. (c, d) Microscale posts covered with nanoscale features. Figures are reprinted from Refs. Reference Chen, Cai, Tsai, Chen, Xiong, Yu and Ren15 and Reference Lee and Kim129 with the permissions of AIP Publishing LLC (Copyright 2007) and the American Chemical Society (copyright 2011), respectively.

Multiscale surface textures
Surface textures featuring multiple length scales are called multiscale or hierarchical Reference Weibel, Kim, Fisher and Garimella130 ; several such textures are reviewed by Lu and Kandlikar. Reference Lu and Kandlikar131 For example, a surface of interest may have millimeter scale features, whose surfaces are covered with microstructures, whose surfaces are covered with nanostructures, as shown in Figs. 10(c) and 10(d). After fabricating the post structure by silicon deep reactive ion etching, nanoscale roughness was formed by depositing carbon nanotubes to study DwC [Fig. 10(c)]. Reference Chen, Cai, Tsai, Chen, Xiong, Yu and Ren15 A similar result has been obtained by a galvanic displacement process Reference Lee and Kim129 but with an additional level of sophistication by nanostructuring either all surfaces or all except the top surface of the microstructures [Fig. 10(d)]. Reference Sun, Hur, Zhao and Kim128 If the nanoscale roughness was desired only on the side surfaces of the posts, a masking step was added to protect the top surfaces of the posts from the roughening step. Recently, biotemplates have been used to fabricate multiscale surfaces. Reference Gerasopoulos, McCarthy, Banerjee, Fan, Culver and Ghodssi132
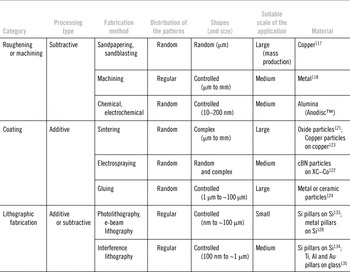
As a summary, Table 2 reviews all the processing methods by category and mentions the distribution, size, and shape of the patterns as well as the suitable material and scale of application.
Microfabrication techniques available for phase change heat transfer applications.

Wettability engineering
Wettability describes the spreading of a liquid on a surface. Wettability engineering is important in, e.g., the automotive industry for repelling water from windshields or paints, Reference Morimoto, Sanada and Tomonaga136 preventing fouling, Reference Carrino, Moroni and Polini137 and reducing friction in moving parts Reference Bobzin, Bagcivan, Goebbels, Yilmaz, Hoehn, Michaelis and Hochmann138 ; in the marine industry to prevent fouling Reference Genzer and Efimenko139 ; in the electric power industry to prevent fouling on solar cells Reference Wang, Zhi and Mullen140 ; in biology to prevent bacterial contamination, Reference Barthlott and Neinhuis141,Reference Feng, Li, Li, Li, Zhang, Zhai, Song, Liu, Jiang and Zhu142 and in the electronic Reference Feng, Feng, Jin, Zhai, Jiang and Zhu143 and chemical industries. Reference Sigal, Mrksich and Whitesides144
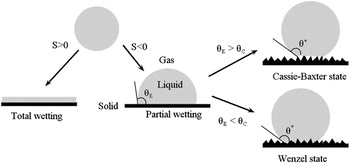
The wettability of a surface can be modified by engineering its texture and (or) its chemistry. A first characterization of wettability is the static wetting of liquid droplets on flat substrates. Reference de Gennes145–Reference Marmur147 Figure 11 shows the possible wetting regimes of sessile droplets on a substrate, where θE is Young's contact angle, and the spreading parameter S is defined as
 $$S = {\sigma _{{\rm{SV}}}} - \left( {{\sigma _{{\rm{SL}}}} - {\sigma _{{\rm{LV}}}}} \right)\quad ,$$
where σSV, σSL, and σLV are the surface tension at the solid/vapor, solid/liquid, and liquid/vapor interfaces, respectively. Reference de Gennes, Brochard-Wyart and Quéré146 When S > 0, a liquid droplet will completely (or perfectly) wet the substrate (i.e., θE = 0°) to form a liquid film with nanoscale thickness. This property is typically obtained on surfaces that have high values of σSV (≈500–5000 mN m−1), e.g., metals. Reference de Gennes, Brochard-Wyart and Quéré146 When S < 0, a liquid droplet will partially wet the substrate forming a nonzero contact angle (i.e., θE > 0°). When θE ≤ 90° a substrate is called wetting or – in the special case of water – hydrophilic. When θE > 90° a substrate is called nonwetting or – in the special case of water – hydrophobic. This hydrophobic regime is usually observed on substrates which have lower values of σSV (σSV ≈ 10–50 mN m−1), e.g., plastics. Reference de Gennes, Brochard-Wyart and Quéré146 By balancing the horizontal projections of capillary forces at the triple contact line, Young Reference Young148 and Dupré Reference Dupré and Dupré149 thereafter obtained
 $$\cos \theta _{\rm{E}} = {{\left[ {\sigma _{{\rm{SV}}} - \sigma _{{\rm{SL}}} } \right]} \mathord{\left/ {\vphantom {{\left[ {\sigma _{{\rm{SV}}} - \sigma _{{\rm{SL}}} } \right]} {\sigma _{{\rm{LV}}} }}} \right. \kern-\nulldelimiterspace} {\sigma _{{\rm{LV}}} }}\quad .$$
Possible wetting states of a sessile liquid droplet on a flat substrate: total wetting (S > 0) and partial wetting (S < 0) on a smooth hydrophobic surface. On the roughened hydrophobic states, two wetting states can be observed: Wenzel state, the droplet wet the substrate, whereas in the Cassie–Baxter state, small gas pockets are located under the droplet, which is thus suspended in the so-called ‘fakir’ state.

From Eq. (11), θE is a function of the liquid, solid, and vapor properties, so that a surface which is nonwetting to a liquid may be wetting to another.
Thereafter, Wenzel Reference Wenzel150 and Cassie and Baxter Reference Cassie and Baxter151 described how surface texture influences wettability, see Fig. 11. Wenzel assumed that the droplet completely wets the rough surface whereas Cassie and Baxter stated that air was trapped in the rough solid–liquid interface. Later, Reference Feng and Jiang152 it was shown that both states could be obtained, depending on the scale of the roughness. Wetting states intermediate between the Cassie–Baxter and Wenzel states have also been reported. Reference Feng, Zhang, Xi, Zhu, Wang, Xia and Jiang153–Reference Nosonovsky and Bhushan155 The apparent contact angle (θ*) of a liquid droplet in a Wenzel wetting state can be defined as
 $$\cos {\theta ^ * } = r\cos {\theta _{\rm{E}}}\quad ,$$
with r being the roughness, defined as the ratio of the true surface area to the projected surface area. For the hydrophobic case (θE > 90°), the Cassie–Baxter case is preferred to the Wenzel state if θE is larger than a critical angle θC, with
 $$\cos \theta _{\rm{C}} = {{\left( {\Phi _{\rm{S}} + 1} \right)} \mathord{\left/ {\vphantom {{\left( {\Phi _{\rm{S}} + 1} \right)} {\left( {r - \Phi _{\rm{S}} } \right)}}} \right. \kern-\nulldelimiterspace} {\left( {r - \Phi _{\rm{S}} } \right)}}$$
, where ΦS is the solid–liquid fractional surface area, and the value of the apparent Cassie–Baxter contact angle is
Reference de Gennes, Brochard-Wyart and Quéré146
 $$\cos {\theta ^ * } - 1 + {\Phi _{\rm{S}}}\left( {\cos {\theta _{\rm{E}}} + 1} \right)\quad .$$
For the hydrophilic case (θE < 90°), the Cassie–Baxter case is preferred to the Wenzel state if θE < θC, with
 $$\cos \theta _{\rm{C}} = {{\left( {1 - \Phi _{\rm{S}} } \right)} \mathord{\left/ {\vphantom {{\left( {1 - \Phi _{\rm{S}} } \right)} {\left( {r - \Phi _{\rm{S}} } \right)}}} \right. \kern-\nulldelimiterspace} {\left( {r - \Phi _{\rm{S}} } \right)}}$$
, and the value of the apparent Cassie–Baxter contact angle is
 $$\cos {\theta ^*} = 1 + {\Phi _{\rm{S}}}\left( {\cos {\theta _{\rm{E}}} - 1} \right)\quad .$$
For hydrophobic surfaces, the more enhanced the surface texture is the more probable the Cassie-Baxter state. When θ* > 150°, the solid surface is said to be superhydrophobic. In general, roughness tends to increase θ* on a hydrophobic surface and the likelihood of a superhydrophobic wetting state (θ* → 180°). Reciprocally, the superhydrophilic wetting state (θ* → 0°) is also observed by roughening an originally hydrophilic substrate. Reference de Gennes, Brochard-Wyart and Quéré146 Note that superhydrophilicity is sometimes also associated with a fast spreading. Reference Cebeci, Wu, Zhai, Cohen and Rubner156 As it relates to phase change heat transfer, the Cassie–Baxter wetting state plays an important role in enhancing DwC behavior Reference Dorrer and Ruehe157 and stabilizing Leidenfrost vapor layers. Reference Vakarelski, Patankar, Marston, Chan and Thoroddsen158
In addition to these considerations, it is important to add that roughness influences both the static contact angle and the so-called contact angle hysteresis (difference between the advancing and receding values). In the classic experiment of Johnson and Dettre, Reference Johnson and Dettre159 advancing and receding contact angles were measured as a function of the roughness of a wax sample with constant chemical properties. The main outcome of this experiment was that an increase in the roughness caused an increase of the advancing contact angle and a decrease of the receding angle (increase of the hysteresis) until a saturation value. At this point, the hysteresis drastically decreased and the receding angle became closer to the advancing contact angle. Texturing the surface appears consequently as an efficient strategy to change the wetting behavior. Reference de Gennes, Brochard-Wyart and Quéré146 It is interesting to note that droplets on superhydrophobic surfaces in the Cassie–Baxter state have a low contact angle hysteresis. In many cases, though not all (see rose petal effect), superhydrophobic surfaces characteristically have low contact angle hysteresis; this leads to drops having low sliding angles and ultimately self-cleaning behavior (sliding angle < 10°; lotus effect). A small hysteresis has been proposed to be a necessary condition to the superhydrophobicity of a surface. Reference Marmur147 Tilting the surface will result in a rolling motion of the droplet, as shown experimentally. Reference Oner and McCarthy160,Reference Richard and Quere161 The sliding or roll-off angle has significance in condensation processes as it plays a role in removing (also called shedding) droplets of condensate, Reference Dorrer and Rühe154 see section “Engineered surfaces for condensation heat transfer”.
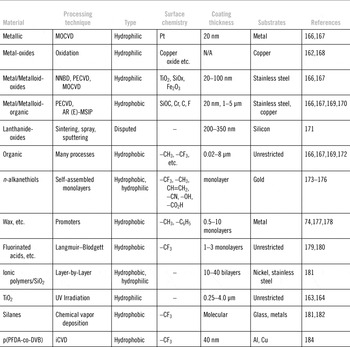
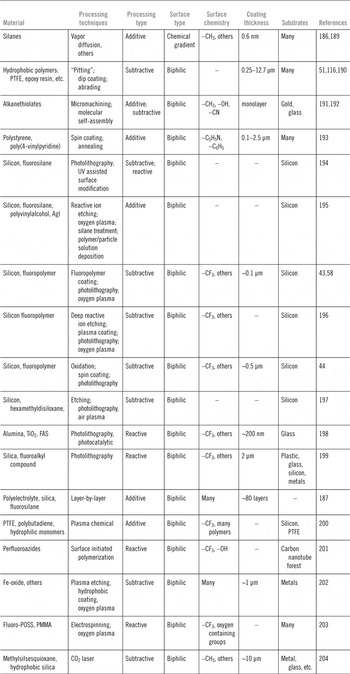
Table 3 and the related discussion describe the methods utilized to alter the intrinsic wettability (θE) of a surface in a spatially uniform manner (i.e., homogeneous wettability). Surface chemistry (or surface energy) can be modified, e.g., by forming oxides on the surface, if hydrophilicity is desired, or by depositing low-surface energy materials (e.g., fluoropolymers, fluorosilanes) if hydrophobicity is desired. Table 3 presents a representative series of coating techniques for modifying the chemistry of a surface. Footnote † For hydrophilic oxides (e.g., copper oxide), the chemistry and resulting wettability can be tuned by varying the degree of oxidation of the surface Reference Dhir162 or by UV irradiation. Reference Takata, Hidaka, Cao, Nakamura, Yamamoto, Masuda and Ito163,Reference Wang, Hashimoto, Fujishima, Chikuni, Kojima, Kitamura, Shimohigoshi and Watanabe164 For hydrophobic surfaces, the chemistry can be controlled by choosing low-surface energy solids. The chemical bonds in low-surface energy solid materials are in order of decreasing surface energy: –CH2 > –CH3 > –CF2 > –CF2H > –CF3 (i.e., CF3 is the least wettable). Reference Zisman165 As an example of an original synthesis method for forming a hydrophobic surface, Hummel spray deposited poly(tetrafluoroethylene) on a metallic surface. Reference Hummel51 Phan et al. Reference Phan, Caney, Marty, Colasson and Gavillet166,Reference Phan, Caney, Marty, Colasson and Gavillet167 describe specific methods capable of tuning static contact angle values from 22° to 112° as well as their performance under nucleate boiling conditions. An issue with hydrophobic coatings is their low thermal conductivity, typical of organic materials. Other approaches to producing hydrophobic surfaces are promoters (i.e., waxes), silanes, fluorinated acids, and self-assembled monolayers (SAMs).
Select coating techniques to modify the chemistry of a surface – in a spatially uniform manner – for heat transfer applications. List of acronyms: iCVD (initiated CVD); MOCVD (metal-organic chemical vapor deposition); NNBD (nanofluids nucleate boiling deposition); PECVD (plasma enhanced chemical vapor deposition); AR-MSIP (activated reactive-magnetron sputtering ion plating); Fluoro-POSS (fluorodecyl polyhedral oligomeric silsesquioxane); p(PFDA-co-DVB) poly-(1 H,1 H,2 H,2 H-perfluorodecyl acrylate)-co-divinyl benzene.

Self-assembled monolayers (SAMs) are an assembly of molecules which form spontaneously on surfaces through adsorption into ordered structures. They are a straightforward means to achieving homogeneous wettability modification (15°–115°) without requiring a relatively thick coating on thermally conductive metallic substrates, and have been characterized for boiling conditions. Reference Balss, Avedisian, Cavicchi and Tarlov174–Reference Thomas, Cavicchi and Tarlov176 Modification of θE can also be achieved by utilizing additives (i.e., surfactants Reference Wen and Wang185 or nanoparticles) in the boiling liquid; however, this approach makes it difficult to interpret the effect of θE on boiling as the surface tension is altered too, and the surface typically keeps modifying itself by deposition during boiling. Moreover, monolayers are generally not as durable as thicker coatings.
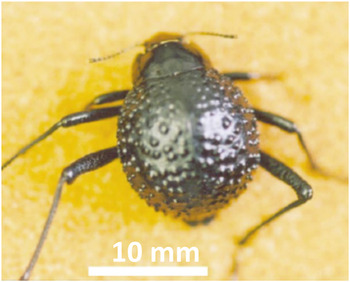
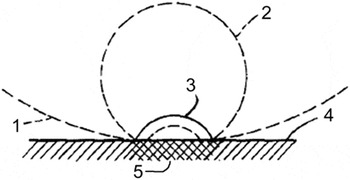
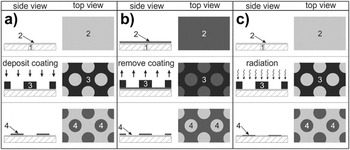
Besides surfaces with spatially homogeneous chemistry and wettability, there are surfaces with wettability contrasts, juxtaposing hydrophobic regions with hydrophilic regions. Reference Morgenthaler, Zink and Spencer186 Such surfaces have an affinity toward both the liquid and vapor phases, a quality that we name biphilic. In nature, the biphilic forewings (elytra) of the Namib desert beetle (Fig. 12) optimize its water intake Reference Zhai, Berg, Cebeci, Kim, Milwid, Rubner and Cohen187 ; while hydrophilic regions of the wing help collect water drops from fog-laden winds, the hydrophobic regions help the drops detach and roll down to the beetle's mouth. Reference Parker and Lawrence188 In 1965, the first biphilic surfaces were prepared by Hummel Reference Hummel51 (see Fig. 13), who sprayed hydrophobic polymer drops onto a steel surface and showed a HTC about 2–7 times higher than the bare steel surface. The various methods to fabricate surfaces with nonspatially homogeneous wettability, either biphilic or with wettability gradients, are described schematically in Fig. 14 and listed in detail in Table 4.
The Namib desert beetle features a network of hydrophobic and hydrophilic areas on its back, which have been hypothesized to facilitate collection and transport of water in scarce humidity conditions. Reproduced by permission from Macmillan Publishers Ltd, Reference Parker and Lawrence188 copyright 2001.

Schematic showing the growth of a vapor bubble from a nonwettable island (hydrophobic) onto a wettable background (hydrophilic). 1–3 represent liquid–vapor interfaces at the different growth stages; 4 indicates a hydrophilic region; 5 indicates a hydrophobic region. Reproduced with slight modifications from Ref. Reference Hummel51.

Schematics demonstrating three techniques for achieving biphilic surfaces. List of identification numbers: (1) substrate; (2) coating with homogeneous chemistry; (3) mask (e.g., lithography); (4) coating region with differential chemistry as compared with coating (2). In (a), biphilic surfaces are achieved by depositing (4) onto (2); additive. In (b), biphilic surfaces are achieved by removing (2) to reveal (4); subtractive. In (c), radiation or other reactive mechanisms are utilized to transform the surface chemistry of (2) into (4); reactive.

Engineering techniques for producing wettability gradients and biphilic coatings.

Essentially, most methods for biphilic surfaces can be classified into one (or a combination) of the following three categories (see Fig. 14): (1) hydrophobic or hydrophilic domains on a coating with initially homogeneous wettability are achieved by an additive process, such as depositing a polymer coating (additive); (2) hydrophobic or hydrophilic domains are revealed by a subtractive process on a coating with initially homogeneous wettability, e.g., a pristine PTFE coating on a metal substrate is removed at specified areas, by say mechanical or etching methods, to reveal the underlying hydrophilic metallic substrate (subtractive); (3) surface chemistry of an initially homogeneous coating is either chemically degraded (e.g., plasma) or reacts to transform its wettability (e.g., hydrophobic to hydrophilic) usually through exposure to radiation (reactive).
In the literature, spatially alternating patterns of superhydrophobic and superhydrophilic areas with well-defined repeatable features – while initially (ca. 2000) not well reported – have now been demonstrated by an ever increasing number of techniques. See the recent review article by Ueda and Levkin Reference Ueda and Levkin205 for a general description of the state-of-the-art for superhydrophobic/superhydrophilic surfaces.
Tadanaga et al. Reference Tadanaga, Morinaga, Matsuda and Minami198 were one of the first groups to report on the subject of superbiphilic surfaces, i.e., the juxtaposition of superhydrophobic and superhydrophilic regions in a patterned manner, by creating superhydrophobic alumina surfaces and then utilizing a photocatalytic reaction induced by UV-light to produce superhydrophilicity. Zhai et al. Reference Zhai, Berg, Cebeci, Kim, Milwid, Rubner and Cohen187 generated hydrophilic patterns on superhydrophobic surfaces by selective deposition of polyelectrolyte/water/2-propanol mixtures, mimicking the fog collection behavior of the Namib Desert beetle (see Fig. 12). Garrod et al. Reference Garrod, Harris, Schofield, McGettrick, Ward, Teare and Badyal200 utilized a two-step, plasma chemical approach to generate biphilic surfaces for applications in fog harvesting. While most coatings for heat transfer applications are metallic (due to their high thermal conductivity), polymeric, and ceramic materials Reference Sarwar, Jeong and Chang206,Reference Zhou and Bier207 can also be coated by numerous different methods. Polymeric coatings do not provide high conductivity, but allow complex textures of a wide choice of materials. The fabrication methods used are usually simple and economic, such as dip coating, spin coating, plasma spray, and electrospray. Thickett et al. Reference Thickett, Neto and Harris193 used sequential spin coating to prepare polymer bilayers of hydrophobic polystyrene (acting as underlayer) and hydrophilic poly(4-vinylpyridine) (a porous network of beads and strands) on clean, smooth silicon substrates. Both polymer layers were smooth, with RMS roughness values below 0.5 nm. These surfaces were cooled and exposed to humid air to study dynamic condensation rates and their dependence on pattern features during DwC of water. Her et al. Reference Her, Ko, Lee, Oh and Moon202 created wettability contrast on alloy steels by applying nanoflake or needle patterns of multiscale micro/nanostructured iron-oxides on steel surface and subsequently tuning the surface energy. These surfaces were exposed to water mist, which readily covered the entire hydrophilic patterns, and created droplets with spherical shape on the surrounding superhydrophobic domains. The main advantage of this approach was that it utilized an industrially relevant, thermally conductive substrate, with scalable processing techniques. Betz et al. Reference Betz, Jenkins, Kim and Attinger58 fabricated biphilic and superbiphilic surfaces by coating silicon wafers with nanometer-thick layers of Teflon, after an optional nanometer-scale roughening using the black silicon technique. Zimmermann et al. Reference Zimmermann, Rabe, Artus and Seeger208 deposited silicone nanofilament coatings that could be locally activated with plasma to yield well-defined superhydrophobic, superhydrophilic, superoleophobic, or superoleophilic domains on a single substrate. Kobaku et al. Reference Kobaku, Kota, Lee, Mabry and Tuteja203 fabricated liquid-repellent surfaces by electrospinning solutions of fluorodecyl POSS and poly(methyl methacrylate) (PMMA). The highly porous, re-entrant, morphology of the electrospun surfaces led to super-repellency (i.e., high advancing contact angle and low contact angle hysteresis for water and various low-surface tension liquids, such as heptane). When these surfaces were exposed to oxygen plasma, they turned superwettable (i.e., advancing and receding contact angles near zero for both water and heptane). These surfaces displayed preferential nucleation behavior under boiling and condensation conditions of low-surface tension liquids.
Review of engineered surfaces for multiphase flow applications
Engineered surfaces for boiling heat transfer
The concept of engineering surfaces to achieve higher performance in boiling dates as far back as 1931. Reference Jakob and Fritz209 Fundamental studies began to appear in the 1950s. Reference Berenson117,Reference Corty and Foust210,Reference Kurihara and Myers211 In the 1960s, fabrication techniques headways allowed a more precise manufacturing of these enhanced geometries, followed by an increasing number of patents. Reference Webb116 Webb reviews the historical evolution until 2004 of enhanced surfaces for boiling in great detail, Reference Webb49,Reference Webb116 and recent developments have been reviewed by Bergles and Manglik. Reference Bergles and Manglik212 This section describes the main engineering attempts to produce surfaces with high boiling performance, i.e., high HTC and CHF. Historically, engineers have first designed surfaces with enhanced nucleation rates and high HTC. A second direction was later taken to increase CHF. More recently, engineers have designed multifunctional surfaces which increase both HTC and CHF. The reliability and repeatability of boiling experiments, crucial for industrial applications, will also be discussed.
Controlling the surface texture to enhance thermodynamic efficiency: An early attempt with enhanced surfaces to improve the HTC was made by Jakob and Fritz Reference Jakob and Fritz209 who roughened copper plates with machined grooves of 16 μm depths and ½ mm pitch; they observed 3 times improvement in HTC in nucleate boiling. The improvement did not last longer than 3 days, because of a slow degassing of the cavities, a phenomenon explained analytically. Reference Bankoff213 Berenson Reference Berenson50 increased HTC by a factor of 6 by roughening metallic surfaces. Kurihara and Myers Reference Kurihara and Myers211 showed – on roughened surfaces – that HTC ∼ n 1/3, with n the spatial density of active nucleation sites. Boiling improvements due to surface roughening were seen as of little industrial relevance because of the fast aging of the surfaces. Thus, to better understand and control the influence of surface texture on the nucleation site density in boiling, researchers have focused their efforts on the nucleation process on surfaces with engineered or well-characterized cavities.
As shown in section “Characteristics of optimum surfaces for boiling heat transfer”, heterogeneous nucleation on real surfaces reduces the superheat needed to nucleate, by decreasing the free energy and by providing natural pits and cavities that entrap gas Footnote ‡ or vapor. Reference Collier5,Reference Bankoff214 To study the influence of pits and cavities, researchers have engineered surfaces with controlled geometries and cavities. Reference Webb49,Reference Webb116 Bankoff Reference Bankoff213 observed three different states of these nucleation sites: the active cavities are nucleating, the dormant cavities are not nucleating but contain vapor that may nucleate, and the extinct (or flooded) cavities do not contain vapor and will only nucleate once the superheat reaches the value estimated for heterogeneous nucleation in section “Characteristics of optimum surfaces for boiling heat transfer”.
As shown in Fig. 15, cavities are geometric means to manipulate the curvature of the liquid–vapor interface during the evolution of the volume of the vapor pockets, for the purpose of helping nucleation or preventing extinction or flooding. Geometrically, a cavity is formed when a portion of the horizontal surface enters into the substrate. For a typical cavity, its inner surface enters downward with a slope at an angle between 0° and 90° from the horizontal surface. A conical cavity is a common example. If the slope increases beyond 90°, the inner surface is considered to re-enter outwards from a vertical surface, and the cavity is called a re-entrant cavity. If the slope further increases beyond 180°, the inner surface is considered to re-re-enter upwards from a horizontal surface, and the cavity is called a doubly re-entrant cavity. Note that this definition assumes an axisymmetric or 2D cavity. Physically, a re-entrant cavity is a cavity for which the curvature of the liquid–vapor interface changes its sign once it penetrates the cavity mouth. During penetration in a doubly re-entrant cavity, the interface curvature reverses twice.
Cavities on solid surfaces control the curvature of the vapor–liquid interface to facilitate nucleation and prevent flooding during subcooling. (a) Schematic of a typical conical cavity with variation of the curvature 1/r during nucleation; R is the radius of the cavity mouth. Figures are reproduced from Ref. Reference Carey52 with minor modifications and the permission of Taylor and Francis Group. (b, c) the geometry of a doubly-reentrant cavity in a fully wetting situation and the superheat/subcooling determine the state (active, extinct, dormant) of the cavity. Reproduced with modifications from Ref. Reference Kim217 and permission of its author.

The state of cavities can be predicted from their geometry, the superheat, wettability, and surface energies. Section “Characteristics of optimum surfaces for boiling heat transfer” shows that the phase change in boiling occurs when a metastable liquid (point A, Fig. 3) becomes stable vapor (point E). According to Eq. (2), the superheat needed to nucleate from a cavity with mouth radius R is proportional to the maximum curvature 1/r min of the vapor pocket during its growth. Figure 15(a) shows that the maximum curvature is found at the mouth of the cavity Reference Lorenz, Mikic and Rohsenow215 for typical conical cavities with θ > 2γ, where γ is the cone angle. This explains why the curvature 1/R, with R the mouth radius, is used to estimate the superheat needed to activate nucleation in the cavity. Reference Lorenz, Mikic and Rohsenow215
Flooding of cavities can also be described from their geometry using Eq. (2). If the fluid–solid system is brought to a temperature inferior to the fluid saturation temperature, or if the solid surface becomes colder than the fluid, the pressure of the vapor phase in the cavity also decreases below the pressure of the liquid, as shown in Fig. 3. The condition of mechanical equilibrium, Eq. (1), implies a change in the sign of the curvature of the vapor–liquid interface. If the geometry or chemistry of the cavity does not allow this change in curvature, the cavity becomes flooded. Thus, conical cavities with θ < 90° cannot sustain subcooling, contrary to conical cavities with θ > 90°, i.e., hydrophobic cavities. Reference Forrest, Williamson, Buongiorno, Hu, Rubner and Cohen181,Reference Zhang, Kim and Yoon216
Hsu Reference Hsu41 improved earlier models for nucleation in conical cavities by adding an upper limit on the size of active cavities, considering the variation of temperature in a thermal boundary layer with height δ above the cavity. This model evaluated the size range of active cavities with the relation
 $$\left\{ {{r_{{\rm{max}}}},{r_{{\rm{min}}}}} \right\} = {\delta \over {2{C_1}}}\left[ {1 + {{{T_{{\rm{SAT}}}}} \over {{T_{\rm{W}}}}} \pm \sqrt {{{\left( {1 - {{{T_{{\rm{SAT}}}}} \over {{T_{\rm{W}}}}}} \right)}^2} - {{4A{C_3}} \over {\delta {T_{\rm{W}}}}}} } \right]\quad ,$$
where C 1 and C 3 are functions of the contact angle and the constant A is obtained from the Clausius–Clapeyron equation. This model has been widely used in boiling studies. Reference Basu, Warrier and Dhir54,Reference Clark, Strenge and Westwater218,Reference Yang and Kim219
With the improvement of micromachining techniques, other types of cavities have been studied to further improve the performance of engineered surfaces in boiling and increase the stability during subcooling in comparison to conical cavities. One of the first analytical and experimental studies on machine-designed cavities was by Griffith and Wallis. Reference Griffith and Wallis220 From their study, re-entrant cavities were shown to act as stable, easily activated, and long-lasting nucleation sites. Thereafter, many studies on re-entrant cavities have been carried to enhance the entrapment of vapor, as reviewed by Shoji. Reference Shoji221 For instance, Marto and Rohsenow Reference Marto and Rohsenow222 manufactured doubly re-entrant cavities (100–600 µm) by drilling and tapering. They found a seven-fold enhancement in HTC compared to mirror surfaces. One key issue is to find a practical and economical method to make these cavities at the suitable length scales. Later, Kim Reference Kim217 investigated analytically and experimentally the relation between geometry and state of re-entrant cavities. He showed that for fully wetting systems, such as the ones involving refrigerants, three parameters determine the cavity state: the superheat, the radius of the neck r neck and the inverted radius of the cavity r inv [see Fig. 15(b)]. For a doubly re-entrant cavity, r neck ≤ r inv, and an ideal doubly re-entrant cavity has r neck = r inv. Clusters of points in Fig. 15(c) show the distribution of cavities on a real surface. The ΔT corresponding to the respective activation and extinction of the cavity can be obtained using Eq. (2), with r* respectively equal to r neck or r inv. It appears from Fig. 15(c) that for fully wetting systems, small cavities are more resistant to flooding than large cavities in the case of subcooling, but also require larger superheat to nucleate.
To manufacture re-entrant cavities, two industrially relevant approaches have been developed. The first two types of cavities (Gewa-T, Thermoexcel-E) are fabricated by flattening or bending fin-like protrusions, while the latter (High Flux, Reference Milton223–Reference Milton225 ) are fabricated by sintering metallic particles. These complex surface geometries enhance not only nucleation, but also fluid transport. For instance, Chien and Webb studied the interactions of cavities interconnected via pores and channels. Reference Webb49,Reference Chien and Webb226 Their suction evaporation model predicts optimum pore diameter that balances CHF and HTC. Reference Webb49,Reference Chien and Webb227 More recently, Ujereh et al. Reference Ujereh, Fisher and Mudawar228 reduced the onset of nucleate boiling and enhanced HTC in pool boiling of refrigerant FC-72 (up to 400%) by coating silicon surfaces with carbon nanotubes. Finally, as shown on Figure 16, Li et al. (ref. 35) textured copper surfaces with a carpet of nanorods to improve the nucleation process and enhance HTC.
Control of surface chemistry to enhance thermodynamic efficiency: Surface texture (or topography) is not the only property that has been modified to enhance multiphase heat transport. Engineering the chemistry of surfaces has also been shown to enhance multiphase heat transfer. As shown in section “Characteristics of optimum surfaces for boiling heat transfer”, nucleation is facilitated on low wettability surfaces, while high wettability enhances performance at high heat flux. Gaertner Reference Gaertner229 was among the first to modify the wettability of a metallic surface with a thin fluorocarbon film coating and showed that the maximum heat flux decreased as the surface became nonwettable. Liaw and Dhir Reference Liaw and Dhir168 modified the wettability by controlling the degree of oxidation of a surface or with a thin coating of fluorosilicone sealant. They obtained a maximum heat flux lowered by 50% on the fluoro-based hydrophobic surface (θ = 107°) compared to the oxidized hydrophilic surface (θ = 38°). More recent studies also show that hydrophobic surfaces enhance HTC by increasing the number of nucleation sites, Reference Wang and Dhir42 by reducing the waiting time between bubbles, Reference Phan, Caney, Marty, Colasson and Gavillet167 and by reducing the superheat at the onset of nucleate boiling. Reference Bourdon, Rioboo, Marengo, Gosselin and De Coninck175 In Ref. Reference Bourdon, Di Marco, Rioboo, Marengo and De Coninck230, comparisons of several nanometrically smooth surfaces showed how HTC increases with the increasing surface hydrophobicity. The exhaustive study of boiling on smooth silicon samples by Jo et al. Reference Jo, Ahn, Kang and Kim44 showed that a hydrophobic coating (θ = 123°) enhances the HTC by a factor up to 3 compared to a hydrophilic coating (θ = 54°). Hydrophobic surfaces had an onset of nucleate boiling at superheats five times lower than hydrophilic ones; however, the CHF was reached at 250 kW m−2 on the hydrophobic coatings, whereas the CHF on hydrophilic coatings occurred at fluxes close to four times higher. Finally, the surface energy of nickel wires was modified with layer-by-layer coatings of silica nanoparticles to obtain hydrophobic, hydrophilic, or superhydrophobic surfaces. Reference Forrest, Williamson, Buongiorno, Hu, Rubner and Cohen181 The coating caused drastic changes in wettability but barely changed the roughness. The superhydrophobic coating was shown to increase the HTC and the CHF by a factor of 2 compared to the bare metallic wire. The higher HTC was attributed to a higher number of available active nucleation sites on the hydrophobic coating. The higher CHF was attributed to a low value of the receding angle (20°), similar to angles on hydrophilic coatings. In Takata et al., Reference Takata, Hidaka and Uraguchi231 superhydrophobic surfaces were found to induce stable film boiling at very small values of superheat, and no nucleate boiling region was observed.
Control of surface texture to enhance CHF: Several attempts have been made to use micro and nanostructures, to delay the occurrence of dry-out, or minimize its effects, as reviewed by Lu and Kandlikar. Reference Lu and Kandlikar131 The mechanism by which these nanostructures enhance heat flux is still a matter of debate, Reference Lu, Chen, Srinivasan, Carey and Majumdar232 be it enhanced capillary transport, Reference Chen, Lu, Srinivasan, Wang, Cho and Majumdar233 enhanced surface area, or superwettability. Reference Takata, Hidaka, Cao, Nakamura, Yamamoto, Masuda and Ito163 Li and Peterson Reference Li and Peterson34 used micro meshes to increase capillary transport, resulting in higher CHF. Other examples of materials used to enhance CHF are copper nanowires, Reference Li, Wang, Wang, Peles, Koratkar and Peterson35,Reference Chen, Lu, Srinivasan, Wang, Cho and Majumdar233–Reference Yao, Lu and Kandlikar235 silicon nanowires, Reference Lu, Chen, Srinivasan, Carey and Majumdar232,Reference Chen, Lu, Srinivasan, Wang, Cho and Majumdar233 carbon nanotubes, Reference Dai, Huang, Yang, Li, Sightler, Yang and Li236 zinc oxide nanoparticles, Reference Hendricks, Krishnan, Choi, Chang and Paul237 nanoporous copper, Reference Li, Furberg, Toprak, Palm and Muhammed238,Reference Furberg, Palm, Li, Toprak and Muhammed239 nanoporous zirconium, Reference Ahn, Jo, Kang and Kim240 nanoporous silicon, Reference Shen, Graber, Liburdy, Pence and Narayanan241 and nanoporous aluminum oxide. Reference Lee, Bhuiya and Kim242 Superhydrophilic silicon nanowires achieved a 100% increase in the CHF value for water, as compared with smooth silicon. Reference Chen, Lu, Srinivasan, Wang, Cho and Majumdar233 Also, Ahn et al. Reference Sathyamurthi, Ahn, Banerjee and Lau243 investigated the effect of carbon nanotube coatings on pool boiling. The surface was coated with a carpet of vertical multiwalled carbon nanotubes. Interestingly, the heat flux in the film boiling regime was increased by 175%, possibly by disruption of the microlayer or by increase of the contact line length. Wicking tracks along the surface have been obtained by deposition of nanoparticles after boiling nanofluids on metallic microwires. These coatings have been shown to enhance wettability and wicking, thereby increasing CHF. Reference Kim and Kim244 Diamond particles have been coated to obtain a microporous layer Reference Chang and You245 that resulted in a significant increase of CHF. Additionally, this microporous coating also decreased the required superheat temperature for nucleation from 30 to 5 K. A microporous coating obtained by fusing copper microparticles has improved the boiling performance of refrigerant by respectively 300 and 120% in terms of HTC and CHF, compared to a bare copper surface. Reference Moreno, Narumanchi and King246 Other coating materials, such as nanosilica particles, Reference Hsu and Chen182 have also been deposited and led to similar results and conclusions. Takata et al. Reference Takata, Hidaka, Cao, Nakamura, Yamamoto, Masuda and Ito163 showed that a TiO2 coating could greatly enhance the CHF in pool boiling and measured a 3-fold enhancement of the CHF values compared to a bare surface. In Ref. Reference Feng, Weaver and Peterson247, over 100% enhancement of CHF in pool boiling heat transfer has been demonstrated using atomic layer deposition of Al2O3.
Use of surface texturing for pool boiling enhancement: (a) SEM image of copper nanorods used to enhance pool boiling performance. (b) The surface defects act as artificial cavities and enhance the nucleation. Reprinted from Ref. Reference Li, Wang, Wang, Peles, Koratkar and Peterson35 with permission of John Wiley and Sons.

Chemistry and texture control to enhance CHF and HTC: Superwettable coatings have been used to enhance CHF, by maintaining a high degree of solid–liquid contact area, while at the same time, delaying dry-out by reducing the spreading of vapor bubbles. Reference Dhir65,Reference Kandlikar71,Reference Chen, Lu, Srinivasan, Wang, Cho and Majumdar233,Reference Ahn, Jo, Kang and Kim240 Indeed the study of the modification of the chemistry and texture to enhance the CHF did not receive much attention until recently with the pool boiling experiments of nanofluids. As shown by Kim and Kim, Reference Kim and Kim244 boiling nanofluids enhanced both the texture and chemistry by depositing a coating of nanoparticles contained in the fluid on the surface during boiling. Using nanoparticles of SiO2, TiO2, and Al2O3, they obtained hydrophilic surfaces with a range of wettabilities. They concluded that the CHF increases for improved wettability and by capillary pumping resulting from the presence of nanoparticles. Recently, Ahn et al. Reference Ahn, Jo, Kang and Kim240 controlled the degree of anodic oxidation of zirconium alloy plates to develop micro and nanostructures on the surface, reducing wetting angles from 50° down to ≈0°. They concluded that the combined modification of chemistry and texture enhances the CHF by improving the wettability and the liquid spreading (from 177 kW m−2 on a nanotextured surface to 560 kW m−2 on the micro/nanotextured surface).
Surfaces with multiscale textures or geometries offer the possibility to address the multiple length scales associated with boiling, from wetting and nucleation (O(nm)), to bubble dynamics (O(cm)). Surfaces that show distinct multiscale features, like those in Fig. 17 or the pyramids of microparticles, Reference Chen, Lu, Srinivasan, Wang, Cho and Majumdar233,Reference Launay, Fedorov, Joshi, Cao and Ajayan248–Reference Kim, Kim, Kim, Ahn, Jo, Kim and Kim251 have been shown to improve both thermodynamic efficiency and CHF in pool boiling. Liter and Kaviany Reference Liter and Kaviany250 designed a porous multiscale texture by stacking of copper microsphere (200 μm diameter) as in Fig. 17(b) to form an array of cones (≈1.5 mm height). They found that the CHF is reached when either of the following phenomena limits the flow of liquid toward the surface: (1) the vapor columns merge into a vapor layer on the surface that keeps the liquid away from the solid surface; or (2) the viscous drag in the wicking geometry exceeds the capillary suction. Figure 17 represents a multiscale texture created by the microreactor assisted nanomaterial deposition (MAND) process. This multiscale texture enhances both the CHF (4 times higher than a bare Al surface) and the HTC (10 times higher). Launay et al. Reference Launay, Fedorov, Joshi, Cao and Ajayan248 combined micro and nanoscale patterns for pool boiling applications: several surfaces including bare silicon, fully coated CNT silicon, 3D microstructures with micropillars and nanotubes were characterized with water and a dielectric fluid. Also, by controlling the synthesis of CNT on porous capillary wicking surfaces, Reference Weibel, Kim, Fisher and Garimella130 the temperature of superheat required for nucleation was reduced by 72% compared to baseline tests; importantly, the “temperature overshoot” observed on noncoated surfaces was eliminated. Recently, Kandlikar designed surfaces with low profile (0.5–1 mm) embossed fins (Fig. 17) featuring microscale cavities at their base; measured HTCs and CHFs were respectively, 8 and 2.5 times higher than on plain copper surfaces. Reference Kandlikar38 The microcavities were thought to enhance nucleation, while the fins induced lateral rather than vertical bubble trajectories. Kim et al. Reference Kim, Kim, Kim, Ahn, Jo, Kim and Kim251 designed hydrophilic surfaces with octagonal microposts combined with ZnO nanorods, with CHFs about twice as high as bare surfaces.
Multiscale surfaces increase HTC and CHF in pool boiling. (a) ZnO nanostructures deposited on Al substrates by the MAND process, and corresponding (b) boiling curve on two different substrates (silicon and aluminum) with different MAND process parameters. Reprinted from Ref. Reference Hendricks, Krishnan, Choi, Chang and Paul237, copyright 2010, with permission from Elsevier. (c) Embossed millimeter-scale fins with micrometer-scale cavities at their base drastically enhance HTC and CHF in pool boiling (d), by inducing lateral rather than vertical bubble trajectories and by increasing nucleation. Reprinted with permission from Ref. Reference Kandlikar38, copyright 2013, AIP Publishing LLC.

Spatial patterning of wettability to improve both HTC and CHF: The ability to spatially pattern wettability is important to the design of ideal boiling surfaces. As seen in the conclusions of section “Characteristics of optimum surfaces for boiling heat transfer”, an ideal boiling surface has complex requirements on its wettability: it requires hydrophobicity to promote nucleation and HTC at low heat flux, and hydrophilicity to maintain liquid transport to the hot surface for preventing early CHF. Reference Wang and Dhir42 Therefore, biphilic surfaces, which juxtapose regions of high and low wettability, offer an elegant solution to this dilemma. Measurements have shown that biphilic surfaces significantly enhance the heat transfer performances (HTC and CHF) in pool boiling. Reference Betz, Xu, Qiu and Attinger43,Reference Hummel51 The enhancement was explained by the efficient management of both the vapor and liquid transport, maximizing nucleation rates and delaying CHF. Reference Betz, Xu, Qiu and Attinger43
The first reports (given in the form of US Patents) of biphilic surfaces came in the late 1960s by Hummel Reference Hummel51 and by Gaertner, Reference Gaertner190 see Fig. 12. The emphasis is on stabilizing gas and vapor cavities to prevent cavity flooding, which resulted, as an example, in an increase of a factor 5 of the HTC for the biphilic surface compared to the clean surface. Reference Hummel51 Betz et al. have shown that biphilic and superbiphilic surfaces (see Fig. 18) also act to delay the formation of the vapor film that insulates the surface from the liquid and therefore increase the CHF by 65% as compared with a uniform nonwettable surface. Reference Betz, Xu, Qiu and Attinger43 Their superbiphilic surfaces also showed significant HTC enhancement for low superheat values, up to 10 times the HTC of a simple biphilic surface at 5 K of superheat. Reference Betz, Jenkins, Kim and Attinger58 Other biphilic and superbiphilic surfaces have been synthesized and have demonstrated site-selective nucleation Reference Schutzius, Bayer, Jursich, Das and Megaridis204,Reference Nam and Ju252 and enhanced boiling heat transfer Reference Jo, Ahn, Kang and Kim44,Reference Dai, Huang, Yang, Li, Sightler, Yang and Li236,Reference Nam and Ju252–Reference Wang, Song and Wang254 for water. For design considerations of these surfaces, it has also been shown that the size and pitch of the hydrophobic dots are the dominant parameters at low heat fluxes and that, at a high heat flux, a high number of hydrophobic dots could result in decreasing the value of the CHF. Reference Jo, Ahn, Kang and Kim44,Reference Dai, Huang, Yang, Li, Sightler, Yang and Li236,Reference Nam and Ju252–Reference Wang, Song and Wang254 Finally, biphilic surfaces have also been manufactured for lower surface tension liquids like methanol. Reference Kobaku, Kota, Lee, Mabry and Tuteja203
Biphilic and superbiphilic patterns (a) on silicon surfaces drastically enhance pool boiling heat transfer (b). Reprinted from Ref. Reference Betz, Jenkins, Kim and Attinger58, copyright 2013, with permission from Elsevier.

Engineered surfaces for condensation heat transfer
Theoretical insights of condensation phenomena have been used as an effective tool to engineer condenser surfaces. Early reviews of methods to enhance heat transfer in condensing equipment and technical ways to favor DwC have been provided by Bergles and Morton Reference Bergles and Morton255 and Williams et al. Reference Williams, Nandapurkar and Holland256 These involve (a) changes in geometry to either increase surface area and/or help remove the condensate, such as Reference Graham and Griffith75 surface roughening (mostly effective at high Reynolds numbers), fins, fluted or grooved tube, wavy surfaces, e.g., the “Gregorig surfaces” which create gradients of capillary pressure to destabilize the film of condensate, Reference Gregorig257,Reference Bansal, Khandekar and Muralidhar258 and wired tubes coiled around; (b) modifications of surface energy or chemistry, and (c) the use of force fields – which is outside the scope of this review. The use of micro- and nanostructures to enhance DwC on surfaces has recently been reviewed by Enright et al. Reference Enright, Miljkovic, Alvarado, Kim and Rose259
Engineering the wettability of surfaces to improve condensation heat transfer seeks three purposes: (i) maximizing the DwC HTC by ensuring adequate nucleation and early removal of droplets, (ii) ensuring adequate drainage of condensate (larger drops or puddles caused by the merging of droplets) to avoid the transition to FC, and (iii) sustaining DwC over long times by minimizing surface degradation. While the first purpose is particularly important at low heat flux, the other two are typically investigated for high heat flux conditions. The design requirements for surfaces addressing these three purposes are distinct. Enhancing DwC HTC requires that the surface should be hydrophobic enough to shed the condensate droplets at a small size (thus minimizing the thermal resistance across a liquid droplet), and at the same time allow better surface rejuvenation (to have a higher nucleation rate). Enhanced droplet mobility on a hydrophobic condenser surface also facilitates condensate drainage, thus delaying a transition from the DwC to the FC mode. Multiscale wettability patterning is investigated to enhance the removal of condensate and prevent formation of liquid film on the surface. The third purpose however, to sustain DwC over the operational life of the condensing surface, is more of a manufacturing challenge. The following subsections describes how these wettability engineering strategies have been implemented through homogeneous (monophilic) and heterogeneous (biphilic) chemical coatings, homogeneous and heterogeneous physical texturing, or a combination of chemical coating and physical texturing.
Patankar Reference Patankar21 performed a detailed theoretical analysis of superwettable surfaces to optimize nucleation in condensation (and boiling) applications. The analysis combined the Clausius–Clapeyron equation, chemical and mechanical equilibrium conditions, and assumed that the geometry consisted of arrays of cylindrical pillar or cavities. Geometries thermodynamically favorable to nucleation were identified in terms of height and radius. The study concluded that long slender pillars with hydrophobic sides and hydrophilic tops might optimally enhance nucleation associated with condensation, and facilitate roll-off. Other studies concluded that some penetration of the fluid into the porous layer would induce better thermal contact than a suspended Cassie state. Reference Miljkovic, Enright and Wang260,Reference Boreyko and Collier261 It is important to note that such theoretical analyses focus on some specific aspects of the condensation cycle presented in Fig. 2, for example the nucleation or the conductive heat transfer. Also, some continuum assumptions need to be revisited at the nanoscale: for instance can one still apply the Young–Laplace law with radii of curvature on the order of the thickness of the liquid–vapor interface?
Controlling the surface chemistry to induce hydrophobicity: Tuning the chemistry of the condensing surface has been attempted, since the importance of early droplet roll-off in DwC has been acknowledged. Reference Rose81 Organic polymers have been proposed since the early sixties Reference Tanner, Pope, Potter and West178 for promoting DwC of steam, and active research continued until the eighties. Reference Marto and Rohsenow222 Polymer films on metal surfaces have also been viewed as a potential solution for condensing organic vapors. Reference Ma, Rose, Xu, Lin and Wang169 Although these coatings achieved enhanced steam DwC HTC and prevented transition to FC even under high heat flux conditions (∼4000 kW m−2), Reference Haraguchi, Shimada, Kumagai and Takeyama262 their durability (∼100–1000 h) still needs to be improved to prevent observed peeling or cracks after the heat transfer tests. Polymer coatings with higher durability (∼20,000 h) have been evaluated, Reference Marto, Looney, Rose and Wanniarachchi263 but their much larger thickness implied larger thermal resistance of the substrate, for which the pertinent HTC values were not reported. Recently, new methods have been introduced to achieve durable hydrophobic coatings on condensing metal surfaces. Modification of substrate surface by applying self-assembled organic monolayers (SAMs) Reference Vemuri and Kim264–Reference Pang, Dale and Kwok266 or polytetrafluoroethylene (PTFE) Reference Ma, Rose, Xu, Lin and Wang169 has been attempted. For a similar wettability, SAM has been found advantageous over PTFE coatings, because of the low thickness (∼30 Å) and associated lower thermal resistance. Reference Yang and Gu267 Typically, low-energy coatings of fluoroalkylsilanes have been used as a popular coating for investigating the improvement in DwC heat transfer. Reference Yin, Wang, Ding, Wang and Chen268 Zhao et al. Reference Zhao, Zhang, Lin and Wang180 reported a 30 fold enhancement in DwC heat transfer of steam (maximum heat flux ∼1500 kW m−2) on Langmuir–Blodgett treated copper surfaces (compared to the FC on the bare metal). Paxson et al. Reference Paxson, Yagüe, Gleason and Varanasi184 have shown that the use of iCVD copolymer thin films grafted to a metal substrate shows more robust (no aging up to ∼50 h) hydrophobicity than fluorosilane SAMs and nearly seven times higher heat transfer (HTC ∼40 kW m−2 K−1) for steam condensation than FC. Superhydrophobic coatings typically enhance droplet mobility and induce faster droplet sliding due to the low contact angle hysteresis. This, in turn, augments convective heat transfer between the rolling droplet and the substrate. Reference Sikarwar, Battoo, Khandekar and Muralidhar269 However, condensate removal on all these monophilic coatings necessarily relies on an external force (e.g., gravity), and therefore has limited effectiveness for smaller droplets or horizontal static surfaces. Also, homogeneous hydrophobic surfaces have a higher thermodynamic barrier to nucleation [see Eq. (8)], compared to hydrophilic surfaces. More advanced features in terms of chemistry and texture of condensing surfaces have therefore been developed in the recent years to overcome these shortcomings.
Effect of surface texture on droplet mobility: Manufacturing surface textures for improving DwC heat transfer has been attempted with millimeter-size grooves, Reference Izumi, Kumagai, Shimada and Yamakawa270 but with limited efficacy, as the largest fraction of heat transfer improvement can only be realized by controlling the growth and removal of condensates only at a smaller length scale. This has led to a number of studies on DwC on surfaces engineered with nearly homogeneous microscale patterns of triangular spikes, Reference Narhe and Beysens271 pillars of square and circular Reference Dorrer and Ruehe157,Reference Jung and Bhushan272–Reference Rykaczewski, Osborn, Chinn, Walker, Scott, Jones, Hao, Yao and Wang274 or other Reference Wier and McCarthy275 cross-sections. For all these cases, surface roughness imposed through the texturing led to increased apparent contact angle. A liquid drop on a roughened surface can exist either in a Cassie or Wenzel state, depending upon whether the equilibrium contact angle (on the smooth surface) θE is, respectively, larger or smaller than a critical angle θC, which is a function of the surface geometry [see Eqs. (13) and (14)]. Reference Cassie and Baxter151,Reference Lafuma and Quere276 However, this theory only holds if the drop size is larger than the texturing length scales: water droplets ensuing from condensation on a rough superhydrophobic substrate have been found to behave differently from deposited or impinging droplets. Reference Narhe and Beysens271,Reference Wier and McCarthy275,Reference Narhe and Beysens277,Reference Narhe and Beysens278 If the minimum droplet size (r min) is smaller than the length scale of the surface roughness (as in the case of micropatterned surfaces), the initial phase of droplet nucleation and growth does not differ from that on a smooth surface. Reference Narhe and Beysens278 The nucleation and the early growth of the droplet occur with the same probability at the base and the tip of the structure. For microtextured surfaces having θE < θC < θ*, the coalescence of droplets through the formation of liquid bridges gives rise to a metastable Cassie-like state, which finally gives way to a more stable droplet in a Wenzel state that keeps growing in size Reference Narhe and Beysens278 (the temporal growth of droplet diameter follows D ∼ t 1/3 for the initial phase, until D is smaller than the microstructure length scale, and then a self-similar trend of D ∼ t). This apparent loss of hydrophobicity and affinity toward Wenzel wetting has been reported in other studies too. Reference Jung and Bhushan272,Reference Wier and McCarthy275,Reference Cheng, Rodak, Angelopoulos and Gacek279 Although the Wenzel mode of wetting on textured surfaces minimizes the droplet-to-substrate contact thermal resistance, it is detrimental to droplet mobility. Efforts have been devoted to achieve a transition from Wenzel to a Cassie state during droplet growth to enhance droplet mobility. Dorrer and Rühe Reference Dorrer and Ruehe157 reported such transitions during condensation on a silicon surface textured with silicon microposts and coated with a hydrophobic fluoropolymer (θE ∼118° on a smooth surface, which was greater than the θC for the textured surface). They reported that droplets nucleate and grow at the valleys and the tips of the structures and form liquid bridges in the microcavities within the posts during the initial phase. This was akin to the observation of Narhe and Beysens, Reference Narhe and Beysens278 except that the microdroplets for the case of Dorrer and Rühe Reference Dorrer and Ruehe157 grew tall enough to touch the overlying liquid bridges (originating from the coalesced droplets at the tips of the microposts) and were drawn up to a more stable Cassie state. It has been demonstrated that for textured condensing surfaces to retain superhydrophobic behavior, topological features of aspect ratio (the height to width ratio of the microstructures) must be greater than one, and the depth of the separation between the structures must be less than 500 nm. Reference Enright, Miljkovic, Al-Obeidi, Thompson and Wang274 With the advent of nanofabrication, a few recent works have studied condensation on homogeneously textured surfaces with feature size ranging from 100 nm (electrodeposited nanopillars) to 10 µm (microfabricated on Si), Reference Enright, Miljkovic, Al-Obeidi, Thompson and Wang273 or carpeting with carbon nanotubes, Reference Lau, Bico, Teo, Chhowalla, Amaratunga, Milne, McKinley and Gleason280,Reference Journet, Moulinet, Ybert, Purcell and Bocquet281 which offer promise of improved droplet mobility.
Effect of chemical coating and surface texture on HTC: While the combination of hydrophobic and nanostructured surfaces can induce spontaneous drop evacuation Reference Boreyko and Chen14 and is a topic of current research, Reference Ma, Wang, Lan, Peng, Ma and Cheng282 the process of coating surfaces with superhydrophobic materials may add additional thermal resistance which offsets the overall gain in heat transfer. Reference Lee, Cheng, Palmre, Bhuiya, Kim, Zhang and Yoon283 Prior studies Reference Mikic83,Reference Tsuruta, Tanaka and Togashi284,Reference Tsuruta and Tanaka285 indicated the influence of the substrate thermal resistance on the overall heat transfer. More recent investigations on substrates with hydrophobic coatings Reference Rykaczewski286 have considered the influence of the substrate thermal conductivity on overall heat transfer rate. Thermal resistance of vapor trapped between the droplet and the substrate is also significant while the droplets reside on nanopillars or a textured superhydrophobic surface in a Cassie Baxter mode. Reference Miljkovic, Enright, Maroo, Cho and Wang287 Thus, an effective DwC strategy needs to resolve the dilemma over the appropriate combination of surface wettability and liquid mobility to maximize heat transfer. Recent studies have shown that a partially wetting droplet behavior during condensation offers the optimum configuration for improved heat transfer. Miljkovic et al. Reference Miljkovic, Enright and Wang260 showed that a nanostructured Si surface had 56% heat flux enhancement for partially wetting droplet morphologies, as opposed to a 71% heat flux degradation for suspended morphologies in comparison to a flat hydrophobic surfaces. In another study, Reference Miljkovic, Enright, Nam, Lopez, Dou, Sack and Wang288 nearly 25% increase in overall heat flux was demonstrated using CuO nanostructured surfaces with roughness height ∼1000 nm, wetted fraction ∼0.023, and roughness ratio ∼10. Scalable metal oxide nanostructures have been identified as promising candidates for condensation heat transfer applications, as they produce partially wetting droplets, a compromise between good substrate-droplet thermal contact and droplet mobility. Reference Miljkovic, Enright, Nam, Lopez, Dou, Sack and Wang288 As far as research on promoting DwC evolves, a clear trend toward using nanoscale features or a combined approach of microscale features with spatially patterned surface chemistry is observed.
Effect of multiscale surface texture on condensate mobility and HTC: A more recent type of condensing surface has used multiscale roughness to achieve better control of nucleation and droplet growth and removal. For example, biomimetic surfaces having both micro- and nanoscale roughness features (often called two-tier structure) produced by carbon nanotubes deposited on Si micropillars, and coated with hexadecanethiol, exhibited superhydrophobic behavior during condensation. Reference Chen, Cai, Tsai, Chen, Xiong, Yu and Ren15 Chen et al. Reference Chen, Wu, Ma, Hua, Koratkar, Yao and Wang289 investigated DwC on a microscale pyramidal Si microstructure having nanotextured features and showed a 65% increase in drop number density and 450% increase in the droplet self-removal volume, as compared to a superhydrophobic surface with nanostructures alone. These multiscale structures essentially provide the substrate with both local nucleation sites as well as a global superhydrophobicity [see Fig. 19(a)]. Boreyko and Chen Reference Boreyko and Chen14 also supported the view that both nanoscale and microscale topological features are necessary to promote spontaneous drop motion. Cheng et al. Reference Cheng, Vandadi and Chen290 observed adaptive purging of condensing surfaces via self-propelled or coalescence-triggered condensate on surfaces having two-tier roughness where they attributed prompt removal as the dominant factor for sustaining continuous DwC. Liu et al. Reference Liu, Sun, Sun and Ai291,Reference Liu, Sun, Sun and Ai292 provided thermodynamic analyses explaining the effect of the multiscale architecture of a superhydrophobic surface during DwC. Rykaczewski et al. Reference Rykaczewski, Paxson, Anand, Chen, Wang and Varanasit293 proposed the existence of drops in nanoscale as well as microscale Wenzel and Cassie–Baxter wetting states on a micro- and nanotextured surface and identified the optimal feature spacing of the multiscale superhydrophobic structures. The theory behind the enhanced droplet performance on such structure is still under development. Although these surfaces look promising from the point of view of maximizing DwC heat transfer in low heat flux applications (e.g., for condensation under humid air conditions), further investigations are warranted under more intensely condensing (e.g., in a 100% vapor mass fraction) environments regarding how these multiscale surfaces perform in preventing FC or sustaining prolonged DwC.
Control and enhancement of condensation using surfaces with spatial variations of wettability. (a) DwC on multiscale pyramidal Si microstructure with nanotextured surface: (a1) schematic, (a2) SEM of the structures, (a3) ESEM image of DwC on such surface. The synergy between the micro and nanoscale roughness features results in a stable Cassie state and upwards surface tension force, which assist in drop departure. Reprinted from Ref. Reference Chen, Wu, Ma, Hua, Koratkar, Yao and Wang289, reproduced with the permission of John Wiley and Sons, copyright 2011. (b) ESEM images of condensation of water vapor on a surface with alternating hydrophobic and hydrophilic segments: (b1) dry surface, (b2–b8) Snapshot images of condensation. The width of each segment is about 25 µm. The intrinsic contact angles of the hydrophilic and hydrophobic regions are ∼25° and ∼110°, respectively. The sample was maintained at a temperature of 274 K by means of a cold stage accessory of the ESEM. To ensure a dry surface at the beginning of the experiment, the chamber pressure started at ∼400 Pa, well below the saturation pressure at that temperature. The vapor pressure in the chamber was then slowly increased until droplet nucleation was observed. Droplets were observed to preferentially nucleate and grow on the hydrophilic regions. Reprinted with permission from Ref. Reference Varanasi, Hsu, Bhate, Yang and Deng194, copyright 2009, AIP Publishing LLC.

Gradient and biphilic wettability patterning for enhanced condensate mobility: To address the issues of improved condensate transport for preventing the onset of film formation on a condensing surface, a significant body of work has been reported on patterning of surface wettability (i.e., inducing biphilicity). The technique uses a combination of chemically heterogeneous deposition and surface texture to facilitate selective nucleation, growth and condensate mobilization on the substrate. In fact, condensation patterns have been used to monitor the fabrication of biphilic surfaces Reference Kumar and Whitesides294 by measuring diffraction intensity as the temperature of the surface was lowered. An important contribution of biphilic surfaces to condensation is the ability of transporting the condensate with wettability gradients to prevent the transition from dropwise to filmwise condensation, e.g., by inducing self-ejection of the condensing droplets from the substrate. Reference Boreyko and Chen14 Daniel et al. Reference Daniel, Chaudhury and Chen295 utilized wettability gradients under DwC conditions to passively transport water droplets from hydrophobic to hydrophilic regions, enhancing condensate transport, and droplet rejuvenation. Derby et al. Reference Derby, Chatterjee, Peles and Jensen296 reported 3 to 13 times enhancement in heat transfer on hydrophobic and hydrophobic/hydrophilic patterned surfaces (HTC ∼280–425 kW m−2 K−1 under a highly advective flow) over a hydrophilic surface. Varanasi et al. Reference Varanasi, Hsu, Bhate, Yang and Deng194 performed water condensation experiments in the environmental scanning electron microscopy (ESEM) on hybrid surfaces that consisted of alternating hydrophobic and hydrophilic segments on a silicon wafer. The intrinsic contact angles for these surfaces were ∼110° and ∼25°, respectively. ESEM images taken over a span of 30 s [see Fig. 19(b)] clearly demonstrate a large difference in the intrinsic wettability of the hydrophilic and the hydrophobic segments. This wettability difference resulted in preferential nucleation on the hydrophilic segments of the hybrid surface and subsequent droplet growth. The condensation pattern progressed from a few nonuniform droplets on some of the hydrophilic regions to uniform droplets that covered all of the hydrophilic regions. These droplets ultimately merged over the hydrophobic terrain, thus covering the entire substrate with a liquid film.
In the case of DwC, one of the earliest studies utilizing biphilic surfaces was performed by López et al. Reference Lopez, Biebuyck, Frisbie and Whitesides191 The sample surfaces juxtaposed hydrophobic (water contact angle 120°) and hydrophilic (30°) domains, and were fabricated by patterning SAMs of different alkanethiolates on gold and of alkyl siloxanes on glass. Water vapor condensation on such cold surfaces was used to visualize their spatial heterogeneity. Biomimetic micropatterning has been attempted by several groups to achieve enhanced DwC on superbiphilic surfaces. These patterns primarily used discrete superhydrophilic spots that exhibit highly enhanced nucleation rate on a superhydrophobic background. Reference Her, Ko, Lee, Oh and Moon202,Reference Schutzius, Bayer, Jursich, Das and Megaridis204 Garrod et al. Reference Garrod, Harris, Schofield, McGettrick, Ward, Teare and Badyal200 investigated the effect of varying the size and pitch of the superhydrophilic spots on condensation rate. They found that water collection rate and microcondensation efficiency peaked for superhydrophilic spot width and pitch of 500 μm and 1000 μm, respectively. The biphilic structures of Thickett et al., Reference Thickett, Neto and Harris193 consisting of a micropatterned P4VP layer (hydrophilic) on a PS background (hydrophobic), were used for atmospheric water. Water droplets detached from the low hysteresis micropatterned PS/P4VP substrates at lower volumes than for flat P4VP films, thus accelerating water collection rates. Depending on the flow velocity of the incident humid air, they observed condensate collection rate in the range of 0.7–3.3 Lm−2 h−1 on the patterned substrate. Flat PS films had the lowest hysteresis of the three films considered, however they condensed the least amount of water (∼0.6–1.8 Lm−2 h−1). Some other recent studies Reference Anand, Paxson, Dhiman, Smith and Varanasi16,Reference Xiao, Miljkovic, Enright and Wang297 have demonstrated that oil-infused micro- and nanotextured surfaces exhibit superior performance in terms of droplet mobility and condensation rate. Combined influence of surface heterogeneity and low adhesion of water in an optimally oil-infused textured surface results in enhanced nucleation density and greater mobility of condensate. DwC on such surfaces has been observed at a moderate condition (heat flux ∼160 kW m−2 (Ref. Reference Anand, Paxson, Dhiman, Smith and Varanasi16) and HTC ∼10 kW m−2 K−1 (Ref. Reference Xiao, Miljkovic, Enright and Wang297), although longevity of these surfaces can be affected by lubricant cloaking, drainage and mixing (with condensate) in the case of suboptimal surface design.
By using perforated masks with the desired geometry during O2 plasma treatment, Kobaku et al. Reference Kobaku, Kota, Lee, Mabry and Tuteja203 fabricated superomniphilic domains on superomniphobic surfaces for condensation experiments of heptane vapors. The experiments revealed preferential condensation of heptane vapors on the superomniphilic domains. More recent studies have shown the efficacy of attaining spatial control over droplet nucleation and growth by using hybrid coatings, e.g., by selectively coating the tips of the hydrophobic microstructure posts with hydrophilic materials. Reference Varanasi, Hsu, Bhate, Yang and Deng194 Droplets preferentially nucleate and grow on these hydrophilic post tops more uniformly than they would on a similarly textured superhydrophobic surface, thereby promoting Cassie growth and more uniform droplet shedding. Reference Yao, Garvin, Alvarado, Jacobi, Jones and Marsh298 Recently, Mishchenko et al. Reference Mishchenko, Aizenberg and Hatton195 developed a more robust hybrid surface of various geometrical microstructures and demonstrated controlled nucleation and growth of droplets during condensation. However, like in the case of multiscale textured surfaces, the HTC in DwC of these hybrid surfaces, and their ability to maintain sustained DwC under high heat flux conditions still need to be quantified.
Engineered surfaces for applications with ice or frost
The technological challenges faced when attempting to avert frosting and icing are both multifaceted and numerous. Thus, engineers have long resorted to combining external means (mechanical, thermal, or chemical) to avoid ice formation/deposition even in the late 20th century. A passive strategy to achieve this goal includes delaying ice nucleation and the onset of mass solidification. This can be achieved by modifying the chemistry of the surface or its micro- and nanoscale texture. For example, surfaces modified with fluorinated and polysiloxane coatings have low water wettability and surface energy, resulting in icephobic behavior under subzero temperatures. Reference Croutch and Hartley299,Reference Somlo and Gupta300 However, this approach is limited under many technical circumstances: for example, when a cold surface encounters supercooled water droplets in a humid atmosphere, icing is ultimately inevitable. In this situation, ice adhesion hinders the effort to rid a surface of the ice. As a result, several engineering attempts to prevent ice/frost formation or prolong machinery operation in ice-promoting environments have concentrated on ice/frost delay, ice adhesion reduction, or both. An even more severe technical challenge is the design of surfaces that maintain machinery performance in the presence of ice or frost. The density of the ice/frost is a function of temperature, humidity, thermal conductivity, and wettability of the surface. Therefore, while it is desirable that a surface delay ice/frost nucleation, if ice/frost cannot be prevented, a surface that produces a dense phase is preferred in refrigeration systems for mitigating the heat transfer reduction due to icing. The present section describes engineering attempts to produce surfaces that delay ice/frost nucleation and reduce ice adhesion. Studies that focus on ice removal are not within the scope of this review.
Surface chemistry and texture affect ice nucleation: Ice nucleation normalized rates were found to be one order of magnitude higher on smooth hydrophobic surfaces compared to smooth hydrophilic surfaces, Reference Li, Xu, Shi, He, Li, Li, Zhou, Wang and Song301 where water microdroplets formed on flat, solid surfaces by an evaporation and condensation process. The first study of freezing on textured superhydrophobic surfaces was conducted by Saito and co-workers, and showed less snow accumulation on nanostructured superhydrophobic surfaces than on smooth surfaces. Reference Saito, Takai and Yamauchi302 Hydrophobic textured stainless steel surfaces functionalized with polyelectrolyte polymer brushes showed lower freezing temperatures than polished untreated steel for supercooled liquid droplets under slow cooling conditions. Reference Charpentier, Neville, Millner, Hewson and Morina303 Increased freezing delays and lower ice adhesion strength with decreasing contact angle hysteresis were observed by Arianpour et al., Reference Arianpour, Farzaneh and Kulinich304 who studied water droplets cooled on nanostructured composite coatings consisting of vulcanized silicone rubber and various amounts of carbon-black, titania, or ceria nanopowders as fillers. A recent condensation-frosting study performed on superhydrophobic surfaces with enhanced self-propelled jumping of condensed water microdroplets, showed significant delay in frost initiation even at very low (subzero) temperatures and high degree of supersaturation. Reference Boreyko and Collier305,Reference Zhang, He, Chen, Wang, Song and Jiang306 Another recent study Reference He, Wang, Li and Song307 on superhydrophobic surfaces made of zinc oxide nanowires showed significant retardation in frosting, as well as considerable delay in freezing of condensed liquid droplets on nanowires with smaller diameters. Condensed droplets on these surfaces were formed at temperatures well below 0 °C and showed very high contact angle, even at smaller length scales (∼50 µm). The mode of initial condensation also determined the freezing delay. When initial condensation occurred in filmwise mode, the freezing temperature was higher and freezing duration was an order of magnitude lower compared to DwC in Ref. Reference Zhang, He, Zeng, Li, Cui, Chen, Wang, Song and Jiang308, where nanostructured surfaces consisting of ZnO nanorod arrays were used in an evaporative closed cell. Sessile water droplets freezing on surfaces with different wettabilities – ranging from superhydrophilic to superhydrophobic – were also studied by Yin et al. Reference Yin, Xia, Xue, Yang, Wang and Chen309 under continuous substrate cooling. Ice accretion was tested by spraying supercooled water to samples at different horizontal inclination angles. Their results did not show any correlation of ice formation with surface wettability and revealed the greater role of surface texture in anti-icing performance. On micro/nanotextured superhydrophobic surfaces, the time delay in ice nucleation of sessile droplets was found to be extended, as was the total time of freezing. Reference Zhang, He, Zeng, Li, Cui, Chen, Wang, Song and Jiang308,Reference Guo, Zheng, Wen, Song, Lin and Jiang310
Controlling ice adhesion with surface hydrophobicity and texture: Several studies on shear force of ice adhesion on multiscale-texture hydrophobic/superhydrophobic surfaces have shown ice adhesion force reduction between a factor of 2 and 6 compared to the respective control surfaces. Reference Boinovich, Zhevnenko, Emel’yanenko, Gol’dshtein and Epifanov311–Reference Sarkar and Farzaneh315 Under axial stresses, the reduction factor was even higher (5–10). Reference Boinovich, Zhevnenko, Emel’yanenko, Gol’dshtein and Epifanov311 Saleema et al. Reference Saleema, Farzaneh, Paynter and Sarkar316 reported almost zero ice adhesion on a superhydrophobic (with low contact angle hysteresis) textured surface with a PTFE coated layer. Ice adhesion strength on superhydrophobic surfaces has been shown to directly correlate with contact angle hysteresis Reference Arianpour, Farzaneh and Kulinich304,Reference Kulinich and Farzaneh313,Reference Kulinich and Farzaneh317 rather than contact angle itself, as found in earlier studies. Reference Saito, Takai and Yamauchi302 Ice adhesion decreases with increasing contact angle on surfaces of similar roughness and increases with decreasing icing/freezing temperature. Reference Boinovich, Zhevnenko, Emel’yanenko, Gol’dshtein and Epifanov311 Cassie wetting on superhydrophobic surfaces creates voids between the solid surface and ice, which decrease the shear strength. These voids act as microcracks, which along with contact angle hysteresis play a major role in reducing ice adhesion on superhydrophobic surfaces. Hence superhydrophobic surfaces can have strong ice adhesion only if they do not create sufficiently large voids at the interface. Reference Nosonovsky and Hejazi318 Meuler et al. Reference Meuler, Smith, Varanasi, Mabry, McKinley and Cohen319 extensively studied ice adhesion on many smooth surfaces of representative wettabilities and hysteresis. Their results showed strong relationship between the average ice adhesion strength and the practical work of adhesion, which is a function of receding contact angle on those smooth surfaces. Humid conditions led to higher ice adhesion due to the anchoring effect. Reference Kulinich, Farhadi, Nose and Du320,Reference Yang, Xia, Zhu, Xue, Wang and Chen321 Studies have been carried out to understand the role of surface roughness on ice adhesion using superhydrophobic surfaces. Since the contact area between the ice and the solid on superhydrophobic surfaces is very low (typically less than 5% of the entire surface), such surfaces are expected to feature significantly lower ice adhesion force. Fibrous superhydrophobic surfaces with their increased robustness and resistance to condensation-induced wetting would also seem to be ideal for resisting ice adhesion, assuming they can be made robust enough not to be damaged. Reference Yang, Xia, Zhu, Xue, Wang and Chen321,Reference Shirtcliffe, McHale and Newton322 Wind turbine blades coated with highly porous superhydrophobic coating made from PTFE showed significant reduction in ice accretion rate. Reference Peng, Xing, Yuan, Xiao, Wang and Zeng323 Highly re-entrant surface structures reduce solid liquid contact area, and thus the low heat transfer rate may be responsible for their observed superior anti-frost performance. Reference Yang, Xia, Zhu, Xue, Wang and Chen321
Hydrophobicity affects frosting/defrosting: Jing et al. Reference Jing, Kim, Lee, Kim, Kim and Hwang324 investigated frosting and defrosting on various surfaces with different wetting properties, ranging from superhydrophilic to superhydrophobic. The degree of supercooling depended on wettability, because of the higher energy barrier for larger contact angles. Repeated frosting/defrosting cycles were found to destroy the repellent ability of their superhydrophobic surfaces. Further, surfaces made of rigid material remained repellent after the cyclical frosting/defrosting tests, but flexible surfaces degraded. Varanasi et al. Reference Varanasi, Deng, Smith, Hsu and Bhate108 studied the growth of frost on micro patterned superhydrophobic surfaces via ESEM observations. Frosting was found to significantly deteriorate icephobic properties of superhydrophobic surfaces. To achieve low ice adhesion under frosting conditions, they proposed to reduce the contact area between ice and the underlying surface; this is possible by preferential ice nucleation on the surface. A review on synthetic superhydrophobic surfaces as anti-ice and anti-frost surfaces is provided in Ref. Reference Meuler, McKinley and Cohen325.
Icing by impacting droplets: Icing caused by supercooled water impact on a solid surface is a phenomenon with important applications for vehicles and has been studied extensively. While earlier icing studies of supercooled water impact on superhydrophobic surfaces were mainly focused on ice adhesion strength, Reference Kulinich and Farzaneh313,Reference Kulinich and Farzaneh317 Cao et al. Reference Cao, Jones, Sikka, Wu and Gao110 concentrated on the formation of ice from supercooled liquid water and freezing rain. Their results showed the superior performance of superhydrophobic surfaces in keeping objects ice-free. They also showed that reducing the size of nanoparticle fillers in polymer nanocomposites reduces the ice nucleation probability of supercooled liquid. Wang et al. Reference Wang, Li, Lv, Lv and Du326 reported superior performance of superhydrophobic aluminum wires in ice accretion tests under freezing rain conditions. Mishchenko et al. Reference Mishchenko, Hatton, Bahadur, Taylor, Krupenkin and Aizenberg20 extensively studied the icing of supercooled water under dynamic conditions on lithographically prepared micro/nanostructured surfaces of varying wettability and geometric features under a wide range of water temperatures, surface temperatures, and impact angles. Their study showed the potential of micro/nanostructured superhydrophobic surfaces with densely packed features as efficient passive anti-icing devices under non humid conditions (RH ∼5%) down to −25 °C. A comprehensive theoretical model was also proposed to accommodate droplet dynamics, heat transfer and ice nucleation and verified with experimental observations. Reference Bahadur, Mishchenko, Hatton, Taylor, Aizenberg and Krupenkin327 Highly porous and self-cleaning superhydrophobic surfaces made from functionalized carbon nanotubes were also shown to have superior repellency against supercooled water droplet impact. Reference Yang, Xia, Zhu, Xue, Wang and Chen321 Lower droplet surface contact time, reduced heat transfer and low surface energy of the functionalized carbon nanotubes may be the reason for their superior performance. Ice adhesion and growth on superhydrophobic surfaces from impacting supercooled water drops revealed that the time delay in ice initiation increases with decreasing contact angle hysteresis and that surfaces with small roughness features are the most robust in ice repellency. Reference Sarshar, Swarctz, Hunter, Simpson and Choi328 A study of the dynamics of supercooled liquid impact on superhydrophobic surfaces revealed that ice nucleation delay on superhydrophobic surfaces is more important at moderate degrees of supercooling, while at much lower temperatures, close to the homogeneous nucleation temperature, bulk and air–water interface nucleation effects become dominant. Reference Alizadeh, Yamada, Li, Shang, Otta, Zhong, Ge, Dhinojwala, Conway, Bahadur, Vinciquerra, Stephens and Blohm329
Due to low residence time and slower ice nucleation rate, superhydrophobic surfaces are being explored as one possible solution for preventing aircraft icing. Antonini et al. Reference Antonini, Innocenti, Horn, Marengo and Amirfazli330 have studied anti icing performance of airfoils with and without superhydrophobic coatings under supercooled droplet impingement tests inside a wind tunnel. Superhydrophobic surfaces not only reduced the energy consumption (in keeping the rear side of the aircraft wing ice-free using electrical heaters embedded in the airfoil) by up to 80%, but also changed the morphology of accreted ice, which was easier to remove by deicing systems. A comprehensive predictive model encompassing surface properties and in-flight conditions was used to evaluate the anti-icing performance of different coatings. Reference Xiao and Chaudhuri331 Freezing of supercooled water on surfaces of different hydrophobicity was studied under shearing air flow and different humidity condition, and the critical shear velocity was measured and correlated with environmental conditions. Reference Jung, Tiwari, Doan and Poulikakos106
Jung et al. Reference Jung, Dorrestijn, Raps, Das, Megaridis and Poulikakos105 compared the time to freeze a given flow rate of supercooled liquid droplets impacting on surfaces that ranged from hydrophilic to superhydrophobic. They found that surfaces with nanometer-size roughness and high wettability nucleate later than typical superhydrophobic surfaces with multiscale roughness and low wettability. In that work, observations of repeated droplet collisions on the same location up to the point of ice formation revealed a previously unseen regime for liquid-on-liquid bounce under atmospheric pressure and at subfreezing surface temperatures. This bouncing behavior is beneficial because it can reduce the total amount of water collected on surfaces. Figure 20 shows freezing delay times versus (a) contact angle θ, and (b) average surface roughness. The data points are separated according to roughness of the corresponding surface; for rough surfaces (average roughness >> critical nucleus size; for water at −20 °C, r c = 2.2 nm), shown in Fig. 20(a), the freezing delay time is independent of roughness. The classical heterogeneous nucleation theory is shown by the dotted curve in Fig. 20(a) and deviates significantly from the experimental data (symbols). A similar discrepancy was reported by Gorbunov et al. Reference Gorbunov, Baklanov, Kakutkina, Windsor and Toumi332 An extension to the classical theory was formulated in Ref. Reference Jung, Dorrestijn, Raps, Das, Megaridis and Poulikakos105 taking into account the reduction in excess entropy of water in the proximity of a surface, as compared to bulk liquid. Figure 20(b) shows the freezing delay versus roughness with measured contact angle for the smooth surfaces (average roughness ≤ critical nucleus size). The adjusted model [solid curve in Fig. 20(b)] reproduces the significant roughness dependency of freezing delay for very small values of roughness. The results of Fig. 20 are important in revealing that ultra-smooth nonhydrophobic surfaces resist considerably longer against icing than typical multiscale hydrophobic surfaces. Poulikakos et al. Reference Maitra, Tiwari, Antonini, Schoch, Jung, Eberle and Poulikakos333 elucidated key aspects of droplet impact on surfaces that are severely undercooled, leading to the formation of frost and icing. Multiscale surfaces with small gaps between the asperities (both at micro- and nanoscales) yielded the largest resistance to millimeter drop impalement. The best performing surface showed rebound at −30 °C for drop impact velocity of 2.6 m s−1; see Fig. 21(a).
Influence of surface roughness and wettability on freezing delay time during impact of subcooled droplets. (a) Freezing delay time versus advancing contact angle for highly corrugated (rough) surfaces (average roughness of the order of micrometers). Contrary to the classical nucleation theory (dotted curve), the extended model reported in Ref. Reference Jung, Dorrestijn, Raps, Das, Megaridis and Poulikakos105 (solid curve) offers a better fit for the experimental data (symbols). (b) Freezing delay time versus surface roughness for smooth surfaces (average roughness of the order of nanometer). The value beside each symbol indicates the measured water contact angle on the respective surface. The extended model is indicated by the solid curve. Reprinted with permission from Ref. Reference Jung, Dorrestijn, Raps, Das, Megaridis and Poulikakos105. Copyright 2011, American Chemical Society.

Multiscale surfaces prevent drop adhesion and shorten drop contact time, preventing frost formation. (a) Beneficial role of micro-to-nanoscale texture in determining water penetration resistance at substrate temperatures of −30 °C. The black rectangular structures in the bottom row denote the surface microtexture, while the shaded domains (sparse or dense) denote the overlaying nanofeatures. Reprinted with permission from Ref. Reference Maitra, Tiwari, Antonini, Schoch, Jung, Eberle and Poulikakos333, copyright 2014, American Chemical Society. (b) Top-view image sequence of a water droplet impacting orthogonally onto a protruding ridge milled on an anodized aluminum plate that was coated with a fluorinated coating to induce liquid repellency. The breakup induced by the ridge and the low wettability minimize the contact time. Reprinted with permission from Macmillan Publishers Ltd., Reference Bird, Dhiman, Kwon and Varanasi334 copyright 2013.

In the situation of impacting droplets, it seems reasonable to assume that the risk of icing increases with the contact time between liquid and solid, as contact time controls the extent to which mass and energy are exchanged between the impacting drop and the solid target. Bird et al. Reference Bird, Dhiman, Kwon and Varanasi334 therefore defined the problem of designing surfaces with minimum contact time during drop impact. They investigated a range of surfaces with varying degree of hydrophobicity, for which the contact time was comparable to the lowest-order oscillation period for a spherical drop. They reduced the contact time further with multiscale surfaces combining O(100 μm) ridges and a superhydrophobic texture. Figure 21(b) depicts an impact sequence of a water droplet striking an anodized aluminum oxide plate with a milled macroscopic texture, pitted microtexture and a fluorinated coating (to induce superhydrophobicity). The droplet separates in half around the protruding ridge. Since the recoil time τ ∼ (m/σ)½, the smaller drops with lower mass m spread and rebound faster from the solid surface, reducing the probability for freezing if the plate is at subfreezing temperatures.
Frosting: Compared to icing, frosting directly from the gas phase (desublimation) onto superhydrophobic surfaces is much more challenging and has not been investigated extensively yet. An initial study Reference Mishchenko, Hatton, Bahadur, Taylor, Krupenkin and Aizenberg20 in this area indicated that superhydrophobic surfaces retard frosting via metastability of the triple point line. Reference Zhang, Yu, Wu and Wu335
Other anti-icing surfaces: Besides superhydrophobic surfaces, a new kind of surface, called liquid suffused solid (SLIP) surface, with very low contact angle hysteresis has also been proposed Reference Kim, Wong, Alvarenga, Kreder, Adorno-Martinez and Aizenberg111 and evaluated to effectively address the issue of icing and frosting. SLIP surfaces also inhibit ice nucleation in supercooled liquid very effectively due to their ultra-smooth texture and high degree of surface homogeneity Reference Wilson, Lu, Xu, Kim, Kreder, Alvarenga and Aizenberg336 which act in tandem to lower the temperature for ice nucleation initiation. Though these surfaces have shown promising results, they currently have drawbacks, such as cloaking. Reference Rykaczewski, Anand, Subramanyam and Varanasi337 The entropy reduction of the crystalline phase near a charged solid surface also influences the heterogeneous nucleation rate of ice at the interface. Recently, zwitter-wettability surfaces (which rapidly absorb molecular water from the environment, but simultaneously appear hydrophobic when probed with water droplets) made from molecular water absorbing polymeric molecules were reported to display frost resisting capability. Reference Lee, Alcaraz, Rubner and Cohen338
Biphilic surfaces: Frosting/icing studies on biphilic surfaces have been almost entirely lacking, and only recently started to appear in the literature. Mishchenko et al. Reference Mishchenko, Aizenberg and Hatton195 used functionalized, hydrophilic polymers and particles deposited on the tips of superhydrophobic posts to induce precise geometrical control over water condensation and freezing at the micrometer scale. Control of freezing behavior was demonstrated via deposition of ice-nucleating AgI nanoparticles on the tips of these structures. The hydrophilic polymer with AgI particles on the tips was used to achieve templating of ice nucleation at the micrometer scale. They presented preliminary results indicating that control over ice crystal size, spatial symmetry, and position might be possible with this method.
Technology sustainability: energy, economic, and environmental benefits
Advanced surface engineering for phase change heat transfer will impact, among many others, three important industries: (a) manufacturing, (b) electricity generation, and (c) automotive.
Energy savings in manufacturing: Thermal transfer and energy storage processes directly impact chemicals, petroleum refining, as well as the plastic and rubber industries. These industries collectively consume more than 10% of the total energy used in the United States, which represents 97.3 quadrillion BTU in 2011. 339 For comparison, the total energy consumption per capita in Japan represents half that in the USA. For shell-and-tube vapor generators, a 20–50% improvement of global HTC using engineered surfaces would reduce by a corresponding amount the surface areas (and likewise size and material costs) of heat exchangers needed in the chemical and manufacturing industry, and facilitate process integration. Reference Linnhoff340
Energy savings in the thermal generation of electricity: Fig. 22 shows that electricity production represents more than 40% (40 Quad) of the total energy used in the United States. Electricity is overwhelmingly produced via phase change thermal processes involving devices such as condensers, evaporators, steam turbines. The conversion losses, from heat to electricity, account for more than 25% (25 Quad) of the total US energy consumption. Advanced surface engineering for phase change heat transfer would significantly reduce conversion losses by minimizing exergetic losses. Reference Linnhoff340 Also, heat exchangers with engineered surfaces for dielectric fluids would improve by about 15% the efficiency of low-ΔT Rankine cycles used in refrigeration, solar power, and air conditioning.
US electricity flow, in Quad, from production source to consumption sectors in year 2011. See Ref. 339 for original image and detailed caption. One Quad (quadrillion BTU) equals 1015 BTU or approximately 1018 Joule.

Economic and energy impact to the automotive industry: Electric and hybrid vehicles use energy in a more sustainable manner than vehicles with thermal combustion engines. Engineered surfaces for phase change heat transfer will make hybrid and electric drive vehicles more affordable, thereby increasing their market share. It has been estimated that power electronics constitute 40% of the total cost of the traction drive system in hybrid vehicles. Reference Marlino341 Recent work at the US National Renewable Energy Laboratory (NREL) has demonstrated that two-phase immersion cooling systems can significantly improve thermal performance by reducing the total thermal resistance (junction-to-coolant) of an automotive power electronics module by more than 50%, compared to the conventional single-phase automotive cooling system. Reference Moreno342
Importantly, micro and nano-engineered surfaces for phase change heat transfer represent an enhancement process that could be implemented either by retrofitting existing heat exchanger equipment or in manufacturing newer-generation heat exchangers.
Summary and outlook
The present review illustrates the rationale, techniques, and challenges of engineering the texture and chemistry of surfaces for phase change heat transfer. While the idea of engineering surfaces for enhancing phase change heat transfer is not new, Reference Jakob and Fritz209 the degree of sophistication with which surfaces can be engineered today – owing to advances in micro and nanofabrication over the last two decades – has caused a resurgence of interest in the subject. Examples of the variety of methods available to the “surface engineer” have been presented, and a large choice of modifications of surface energy and textures is possible, from the nanoscale to the centimeter scale.
Many examples described in this review infer that optimum surfaces need to address the specificities of phase change heat transfer in the way that a key matches its lock. In that sense, surfaces specifically need to be engineered as:
-
• Multiscale, to address the multiple scales of phase change.
-
• Featuring nonhomogeneous wettability, to address the biphasic nature of phase change.
-
• Adaptive, to address the transients and various regimes associated with phase change.
Very recently, several surfaces featuring multiscale textures and spatial variations of wettability have shown improved boiling, Reference Kandlikar38,Reference Betz, Jenkins, Kim and Attinger58 condensation, Reference Chen, Wu, Ma, Hua, Koratkar, Yao and Wang289 and frost-avoidance performance. Reference Bird, Dhiman, Kwon and Varanasi334 Few surfaces currently possess the ability to adapt their features to the various regimes associated with phase change, but such strategies are feasible (e.g., using either passive thermal sensitive liquid crystal coatings, Reference Thevenin, Wu, Keller, Cohen, Clanet and Quere343 or magnetophoretic assembly of nanoparticles into nanofins for on-demand hot spot cooling Reference Yi, Khoshmanesh, Chrimes, Campbell, Ghorbani, Nahavandi, Rosengarten and Kalantar-zadeh344 ).
While this review has exposed the related fundamentals and state-of-the-art techniques to fabricate such surfaces, we identify below several remaining challenges important to the design, manufacturing, and widespread use of engineered surfaces for phase change heat transfer.
There is a need for design rules. Phase change heat transfer covers such a wide range of length scales, from the nucleation scales (O(nm)) to the larger length scales associated with flow instabilities, which are O(cm). The time scales also vary over six orders of magnitude, from those relevant to nucleation (O(ms)) to those of frost growth (O(hours)). The way to obtain design rules is not clear at present. Several modeling techniques are available, Reference Abarajith and Dhir66,Reference Chien and Webb227,Reference Agbaglah, Delaux, Fuster, Hoepffner, Josserand, Popinet, Ray, Scardovelli and Zaleski345,Reference Raj, Kunkelmann, Stephan, Plawsky and Kim346 but they do not cover the multiple scales associated with phase change heat transfer on engineered surfaces. Computation time is typically prohibitive. Several theoretical analyses are also available, but typically focus on one or another regime, length scale or timescale. Molecular dynamics (MD) combined with multiscale approaches can be valuable Reference Koumoutsakos347 in bridging the gap between the macroscale (which is of ultimate practical use) and the molecular scale processes. Several experimental methods exist to characterize phase change heat transfer, but there is a tremendous difficulty in handling the transients and multiple interfaces associated with boiling, the small temperature differences associated with condensation, and the solidification associated with freezing. Recent techniques, such as liquid crystal chromatography can capture microscale spatial variations in substrate temperature. Reference Bansal, Khandekar and Muralidhar258 Other recent experimental techniques are worthy of considering, such as Micro-Raman thermometry, thermal SEM, and environmental SEM.
There is a need for better understanding of the physical aspects of phase change. In boiling, the evolution of the microlayer thickness and its contribution to the boiling heat transfer is still poorly quantified Reference Utaka, Kashiwabara and Ozaki62 and a subject of continued debate. Reference Kim348 While the influence of wettability (static and dynamic) on nucleation has been studied from the field's inception, its influence on nucleate and critical phase change heat transfer is still an open question. For instance, Dhir et al. Reference Dhir, Abarajith, Warrier, Kakac, Vasiliev, Bayazitoglu and Yener47 state that, “In spite of all the advances in the computational techniques for solving boiling problems, the one variable that has still not been modeled correctly is the contact angle (static or dynamic).” Moreover, a recent report redefines the threshold angle for wettability transition (from wettable to nonwettable), and makes a case for its dependence on surface tension (e.g., for hexadecane this transition occurs at 125°, which is far removed from the 90° value applying for water). Reference Law349 There is also a need to study how surface coatings modify the thermal conductivity of surfaces. The physics behind DwC nucleation and its dependence on wetting are poorly understood, as the temperature difference involved in the process is often in the range of the instrumentation error. In frosting, boiling, and condensation, there is a strong need for experimental and theoretical studies on the poorly understood transition between the nucleation-driven high HTC phase change heat transfer and the single phase heat transport.
Another challenge is extending the knowledge base and techniques mostly developed for water to technical fluids such as refrigerants, used in the heating, ventilation, and air conditioning industries. Due to the very low surface tension of refrigerants, it is difficult to fabricate surfaces that are not wetted by them. A recent investigation of DwC of low surface tension fluids motivates further studies on development of ultra-low-surface-energy modifiers and lubricant-impregnated surfaces compatible to fluorinated refrigerants to achieve a major breakthrough in this area. Reference Rykaczewski, Paxson, Staymates, Walker, Sun, Anand, Srinivasan, McKinley, Chinn, Scott and Varanasi350
Also, technical applications call for surfaces that are durable and stable over time. Nanostructures with very small cross-sections are prone to failure under stress, as shown in frost formation studies. Reference Kulinich, Farhadi, Nose and Du320,Reference Farhadi, Farzaneh and Kulinich351,Reference Wang, Xue, Wang, Chen and Ding352 Indeed, simple surface enhancements like sandblasting can dissipate “within a day”, Reference Webb49 mostly because the additional cavities degas easily. Hydrophobic spots can delaminate. Chemical stability is also a challenge for several superhydrophilic patterning techniques, as is the case with UV-irradiation of TiO2 containing coatings which revert to their original hydrophobic state during storage. Reference Zhang, Kono, Liu, Nishimoto, Tryk, Murakami, Sakai, Abe and Fujishima353 Thermal stability is critical for surfaces for phase change heat transfer. Additionally, micro and nanostructures may exhibit different thermal behaviors compared to bulk materials. Reference Zhang, Efremov, Schiettekatte, Olson, Kwan, Lai, Wisleder, Greene and Allen354 The resistance to fouling Reference Bott355 of these surfaces also needs to be investigated. It is difficult to claim a priori that enhanced surfaces are more or less prone to fouling than other enhanced surfaces or flat surfaces. Interestingly, low surface energy has also been shown to reduce and prevent fouling, Reference Smith, Meuler, Bralower, Venkatesan, Subramanian, Cohen, McKinley and Varanasi183 and nanostructures with pitches and features significantly smaller than the fouling particles have been shown to mitigate fouling, Reference Humplik, Lee, O'Hern, Fellman, Baig, Hassan, Atieh, Rahman, Laoui, Karnik and Wang356–Reference Heo, Koh, Kang, Ahn, Chi, Kim and Kim358 for both superhydrophobic and superhydrophilic samples. Reference Page, Wilson, Mordan, Chrzanowski, Knowles and Parkin3
There are several obstacles that need to be addressed to produce commercially viable surfaces for controlling phase change heat transfer. These issues have been reviewed in Refs. Reference Page, Wilson, Mordan, Chrzanowski, Knowles and Parkin3, Reference Webb49, Reference Humplik, Lee, O'Hern, Fellman, Baig, Hassan, Atieh, Rahman, Laoui, Karnik and Wang356, and Reference Thome359–Reference Scardino and de Nys361.
Acknowledgments
DA and CMM acknowledge funding from NSF grants CBET-1066426, 1236030, and 1235867. The authors acknowledge insightful discussions with Gilbert Moreno and Sreekant Narumanchi from NREL, as well as with the participants of the 2013 International Workshop on Micro and Nano Structures for Phase Change Heat Transfer, organized by Yoav Peles (RPI) and Evelyn Wang (MIT). With his academic offspring CJK, the authors also acknowledge the exceptional mentoring of Art Bergles, a selfless leader in the community of enhanced heat transfer, who passed away in March 2014.