INTRODUCTION
The high demand for natural gas to produce electricity has resulted in the creation of a large number of natural gas storage facilities. The liquefied natural gas (LNG) re-gasification structures may be onshore (on land in coastal areas), offshore gravity based (at sea on a platform) and offshore on the seabed (on board re-gasifying LNG ships). Italy does not extract a sufficient amount of natural gas to meet domestic demand: to make our nation less dependent on other countries, an offshore LNG re-gasification terminal project was developed. This project began more than 10 years ago and involved the construction and operation of an offshore terminal and pipeline connected to the Italian gas network. This is the first offshore LNG terminal in Italy and the first gravity based structure (GBS) in the world for unloading, storing and re-gasifying liquefied natural gas. The terminal is located in the Northern Adriatic Sea (Mediterranean Sea), 12 km from the nearest coast. It consists of a reinforced concrete structure (GBS) resting on the seabed at a depth of approximately 29 m, and a pipeline which connects the structure to facilities on land. The GBS, which is 180 m long, 88 m wide and 47 m high was towed by tugboats to its current location in 2008. The pipeline consists of an off-shore section approximately 12 km in length (from the terminal to the nearest coast), and an on-shore section that is approximately 25 km long (Virno Lamberti et al., Reference Virno Lamberti, Gabellini, Maggi, Nonnis, Manfra, Ceracchi, Trabucco, Moltedo, Onorati, Franceschini, Di Mento and Hughes2013). The terminal's re-gasification plant is located on the top of the GBS. It consists of vaporizers that operate using the natural heat of water drawn from the sea during the re-gasification process. The seawater used for re-gasification is discharged (maximum flow rate of 29,000 m3 h−1) toward the South at a depth of 12 m with temperature lower than that of the receiving system (thermal delta of −4.6°C). To prevent the growth of encrusting organisms on the circuits, the withdrawn seawater is treated with sodium hypochlorite (as antifouling); the active chlorine concentration in the discharge (0.2 mg l−1) is within limits set by Italian regulations. Realization of such structures may have different impacts both on the water column and on the sea floor. Several prior studies have shown that the presence and activity of these structures might have some impact on benthic communities inhabiting the surrounding seabed. In particular, the presence of the plant might cause variations in physical features of the sediment (e.g. sediment grain size, sedimentation rates), inducing qualitative and quantitative changes in the structure of soft-bottom benthic communities living immediately around the installations (Davis et al., Reference Davis, Vanblaricom and Dayton1982; Olsgard & Gray, Reference Olsgard and Gray1995; Barros et al., Reference Barros, Underwood and Lindegarth2001; Spagnolo et al., Reference Spagnolo, Panfili, Giampieri, Spegne and Trovatelli2002; Trabucco et al., Reference Trabucco, Cicero, Gabellini, Virno Lamberti, Di Mento, Bacci, Moltedo, Tomassetti, Panfili, Marusso and Cornello2006, Reference Trabucco, Maggi, Manfra, Nonnis, Di Mento, Mannozzi, Virno Lamberti, Cicero, Gabellini and Al-Megren2012; Terlizzi et al., Reference Terlizzi, Bevilacqua, Scuderi, Fiorentino, Guarnieri, Giangrande, Licciano, Felline and Fraschetti2008; Manoukian et al., Reference Manoukian, Spagnolo, Scarcella, Punzo, Angelini and Fabi2010; Ellis et al., Reference Ellis, Fraser and Russell2012). Because the GBS LNG terminal is the first of its kind in the world, very few studies on the potential impact of this terminal on benthic communities and on marine ecosystems are available (e.g. Amjad & Khan, Reference Amjad and Khan2011). The terminal construction and its presence could cause disturbances on the seabed, inducing sediment resuspension, changes in sediment grain size, modification of hydrological and geo-morphological features, resuspension of pollutants, and an increase in turbidity. The main stresses on the ecosystem during the operation phase are due to heat exchange water and chlorine residues originating in the seawater used during the re-gasification process. The heat exchange water that is discharged into the sea appears to be cooler with a chlorine residue that could give rise to chlorinated disinfection byproducts. The difference in temperature can cause harm to marine organisms while some chlorinated organic substances can be dangerous for biota. Finally, the offshore terminal also affects maritime traffic and environmental noise primarily due to supply vessels and the tankers (Kamp, Reference Kamp2005; Virno Lamberti et al., Reference Virno Lamberti, Gabellini, Maggi, Nonnis, Manfra, Ceracchi, Trabucco, Moltedo, Onorati, Franceschini, Di Mento and Hughes2013). To verify the possible impact on the marine environment associated with the project, on behalf of Adriatic LNG, the Institute for Environmental Protection and Research (ISPRA, formerly ICRAM) that operates under the supervision and policy guidance of the Italian Ministry of Environment, in 2005 designed and implemented a multidisciplinary monitoring plan. The plan consists of three phases: (i) before, (ii) during the construction of the structures and (iii) during terminal operation. During each phase, water, sediment (including physical and chemical analyses) and biota characteristics were investigated. With the purpose of monitoring the degree of disturbance on the surrounding environment, data on the macrozoobenthic community around the terminal were analysed. These assemblages are commonly used as environmental indicators that allow an integrated evaluation of the ecosystem alterations. Soft-bottom macrobenthic animals are in fact relatively sedentary, having long lifespans and a large diversity of species with different ecologies and tolerance levels to stress and pollution, and finally, an important role in recycling nutrients (Pearson & Rosenberg, Reference Pearson and Rosenberg1978). In this paper we report the results of our study on the potential effects of terminal installation and storage activities on macrozoobenthic communities during the period from June 2006 to July 2012. Benthic assemblage structures were studied by comparing the area in which the LNG terminal was located with an undisturbed area. We then focused on the area of the terminal to investigate the macrofauna composition patterns at increasing distances from the LNG structure.
MATERIALS AND METHODS
Sampling strategy, field and laboratory procedures
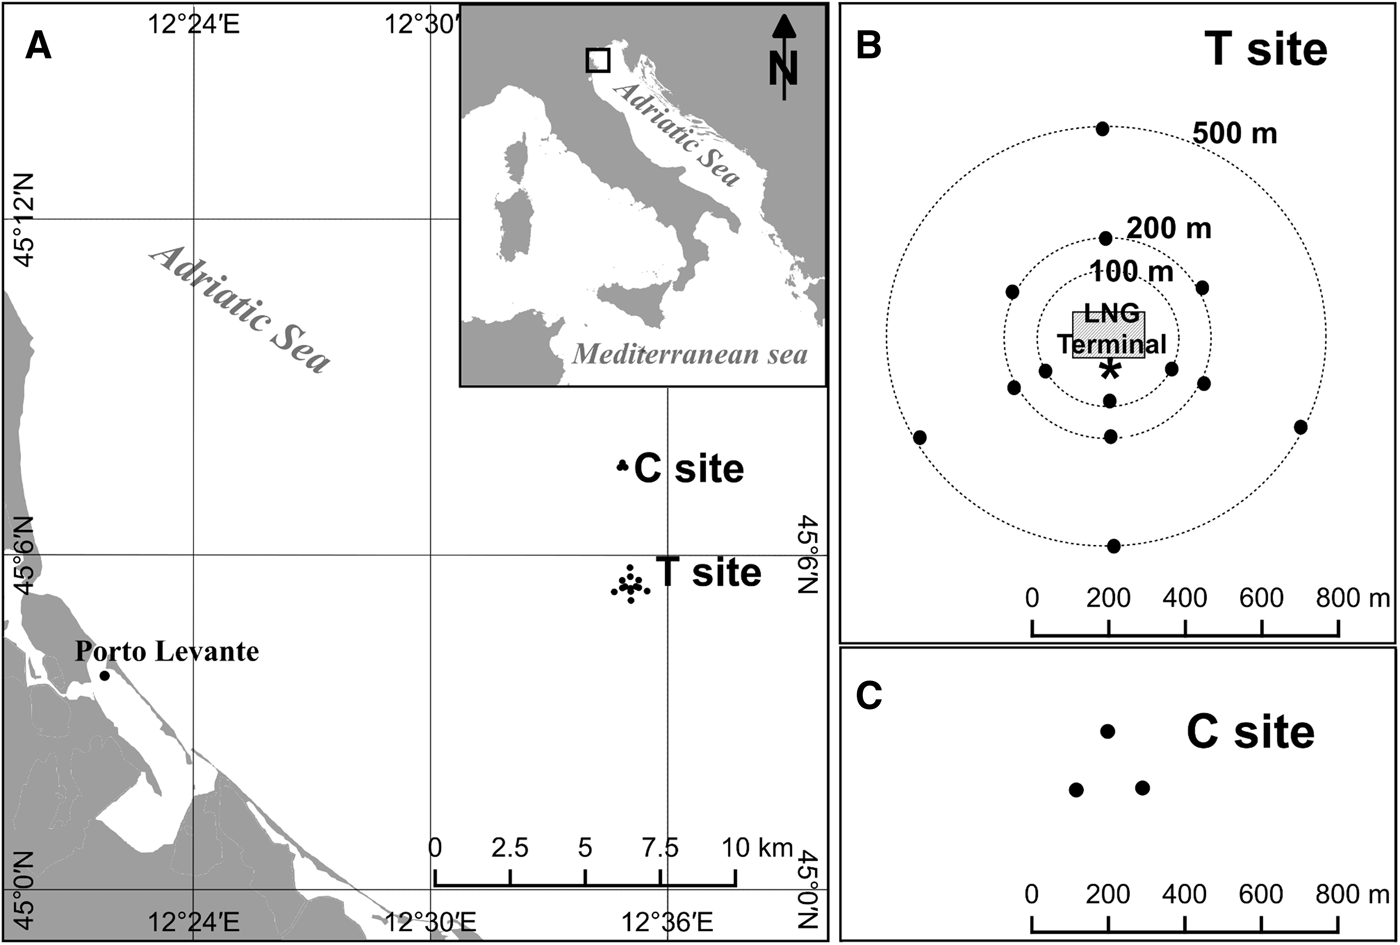
The terminal is located approximately 12 km from the nearest coast (Porto Levante, Rovigo, Italy) (Figure 1). To study the benthic community structure before the construction of the offshore structures, sediments were sampled around the terminal in 35 stations, distributed at different distances from the terminals in a radial pattern with a predominant number of sample stations in the main marine current direction (NO-SE). This sampling design is in fact particularly appropriate for highlighting environmental changes when the point source of disturbance is known (Ellis & Schneider, Reference Ellis and Schneider1997; Cicero et al., Reference Cicero, Di Mento, Gabellini, Maggi, Trabucco, Astori and Ferraro2003; Ellis et al., Reference Ellis, Fraser and Russell2012; Virno Lamberti et al., Reference Virno Lamberti, Gabellini, Maggi, Nonnis, Manfra, Ceracchi, Trabucco, Moltedo, Onorati, Franceschini, Di Mento and Hughes2013). In subsequent phases of the study, the sampling plan was modified. The physical presence of the plant and the results obtained from the first years of monitoring determined the reduction of the number of sampling stations around the terminal, maintaining the same radial design. Within the Terminal site, we focused on an area closer to the structure, since potentially it was the most vulnerable area to the presence of the terminal and its activities. Previous studies carried out on oil and offshore gas platforms have shown significant effects on sediment deposition and benthic assemblage at distances shorter than 100 m. Furthermore, some studies have shown a drastic decline of these effects at 100 m from the structures, which become hardly recordable beyond 500 m (e.g. Davis et al., Reference Davis, Vanblaricom and Dayton1982; Spagnolo et al., Reference Spagnolo, Panfili, Giampieri, Spegne and Trovatelli2002; Terlizzi et al., Reference Terlizzi, Bevilacqua, Scuderi, Fiorentino, Guarnieri, Giangrande, Licciano, Felline and Fraschetti2008; Trabucco et al., Reference Trabucco, Bacci, Marusso, Lomiri, Vani, Marzialetti, Cicero, Di Mento, De Biasi, Gabellini and Virno Lamberti2008). Herein, we present data on a subset of 13 stations, monitored during all phases of the project. At a short distance from the terminal (T) site: three stations were located at 100 m from the terminal, on the southward side of the plant, at the chlorinated water discharge point (Figure 1B); six other stations were placed at 200 m from the terminal; four more stations were located at 500 m from the terminal. The sampling stations were distributed more densely downstream to the main marine current direction to enhance the contrast of the community structure along a possible diffusion gradient (Figure 1B). Furthermore, a control site (C), consisting of three stations, was chosen 4000 m north of the structure. The control site stations were sampled continuously, and were set 100 m apart, characterized by geo-morphological features similar to those of the terminal (T) area (Figure 1), within sufficient distance from the terminal activities. Sampling surveys were carried out from 2006 to 2012. In June 2006 a preliminary survey was conducted before the construction of the terminal (B); in October 2008 another survey was carried out during yard activities of the terminal construction (D); in September 2010, July 2011 and July 2012 three more surveys were performed while the terminal was fully operational (respectively A1, A2, A3). Two sediment samples per station were collected around the terminal with a Van Veen grab (0.1 m2). The samples were then processed through a sieve (1 mm mesh-size) and the retained fraction was fixed in 4% formaldehyde buffered with CaCO3. Next, with the use of a microscope, the samples were grouped into taxonomic groups (Polychaeta, Mollusca, Crustacea and Echinodermata) and identified at the lowest possible taxonomic level (i.e. species). The sediment samples, on which macrozoobenthos studies were carried out, were also studied for grain size, total organic carbon (TOC), total polychlorinated biphenyls (PCBs), total polycyclic aromatic hydrocarbons (PAHs) and total hydrocarbons (HCs) (Cicero & Di Girolamo, Reference Cicero and Di Girolamo2001). Chlorinated disinfection byproducts (halomethanes, haloacetonitriles, volatile organic compounds, haloacetic acids and halophenols) were analysed on water and sediments, but results are not presented here, since they were in general below the quantification levels of the specific method.
(A) Study area (top right corner) and location of Control (‘C site’) and Terminal (‘T site’) sites; (B) position of the 13 sampling stations (black dots) in the T site; (C) position of the 3 sampling stations (black dots) in the C site. The dashed rectangle represents the LNG terminal, and the asterisk on the South side represents the discharge point of chlorinated waters. Belts of stations at distances of 100, 200 and 500 m from the LNG terminal are outlined.

Data analyses
Data analyses were performed on a total of 160 samples. Total macrofauna abundance (N), total species richness (S), Shannon index (H′; Shannon, Reference Shannon1948) and equitability (J′; Pielou, Reference Pielou1974), were calculated to explore quantitative and qualitative changes in assemblage structure among stations, both at Control (C) vs Terminal (T) sites, and with increasing distances from the installation. A Mann–Whitney test was performed on diversity indices data to highlight significant differences between Control (C) and Terminal (T) sites, while a Kruskal–Wallis test was performed on diversity indices data to highlight significant differences among the sites with an increasing distance from the installation. Furthermore, when differences were significant (P < 0.05) a Mann–Whitney pair-wise test (with Bonferroni correction) was performed. As a first step, we evaluated the differences in multivariate species composition between the two sites, Control (C) and Terminal (T), in the various surveys. For each survey, the analysis consisted of a one-way model with Site (2 levels, T and C)as a fixed factor. Subsequently, we looked for effects of the presence of the structure at three distances in the terminal area. For each survey, the analysis consisted of a one-way model with the Distance (three levels: 100, 200 and 500 m) as a fixed factor. Multivariate data analysis were performed on square-root transformed abundance matrices. Similarity matrices were calculated using the Bray–Curtis similarity index (Bray & Curtis, Reference Bray and Curtis1957) and data were graphically represented using non-metric Multi-Dimensional Scaling (nMDS) ordinations. One-way unbalanced permutational multivariate ANOVA (PERMANOVA) analyses were carried out for each survey to test the effects of Site and Distance factors. Test of permutational multivariate dispersion (PERMDISP) (Anderson et al., Reference Anderson, Diebel, Blom and Landers2005) was performed for testing homogeneity of dispersion between the investigated sample groups. For each survey, decomposition of Bray–Curtis dissimilarity into relative contribution to dissimilarity from single species was calculated using SIMPER (similarity percentage) routines on untransformed abundance data matrices. Species were listed in decreasing order of their importance in the discriminating sets of samples (Clarke & Gorley, Reference Clarke and Gorley2006). In order to investigate sediment grain size characteristics of our study area, a principal components analysis (PCA) was performed. Subsequently, to evaluate how the macrozoobenthic community structure could have been influenced by some abiotic parameters, a canonical correspondence analysis (CCA) (Ter Braak, Reference Ter Braak1986) was performed on the faunal matrix (principal one) and the abiotic matrix (second one), using sediment grain size (silt), TOC, total PCBs, total PAHs and total hydrocarbons (HCs) data. Further detailed analyses were carried out to analyse the spatial distribution of the benthic community within the terminal site. We investigated whether the geographic layout of the sampling stations around the LNG terminal might have played a role in determining differences in multivariate species composition between the stations. A test was performed to assess spatial autocorrelation in the stations taken at the same distance from the LNG terminal. To test variability among Distances, using the multivariate permutational methods described above (PERMANOVA), it is necessary to establish if replicate stations within a certain Distance are representative and exchangeable. This is a key step and cannot be assumed without testing. Exchangeability implies that there is no tendency for spatial autocorrelation, in which nearby pairs of stations give more similar values than those placed at greater distances. To test the exchangeability we used the RELATE test in the PRIMER software, a non-parametric form of Mantel test (Clarke & Gorley, Reference Clarke and Gorley2006), usually employed to assess trends in space, but with good capacity to detect autocorrelation in a multivariate context. In this case, the Spearman rank matrix correlation (ρ) is computed between two resemblance matrices: one constructed as Bray–Curtis distances between the samples of (square-root transformed) species abundances and the other as (non-normalized) Euclidean distances from the spatial coordinates (X and Y) determining the location of each of the 13 stations sampled. The RELATE null hypothesis of no relationship of elemental composition to spatial position is tested by permuting positional labels among the samples at random, and recalculating the test statistic ρ. If the observed value of ρ is indistinguishable from those generated under random reallocations of the sampling stations locations, then this is the exchangeability required to validate the use of these stations as replicates in the subsequent permutation tests of differences between Distances from the LNG terminal. For a full description of the procedure and its rationale see Di Franco et al. (Reference Di Franco, Bulleri, Pennetta, De Benedetto, Clarke and Guidetti2014). Univariate and multivariate analyses were conducted using PAST package, version 3.05 (Hammer et al., Reference Hammer, Harper and Paul2001) and PRIMER package, version 6 (Clarke & Gorley, Reference Clarke and Gorley2006) with PERMANOVA+ add-on (Anderson et al., Reference Anderson, Gorley and Clarke2008).
RESULTS
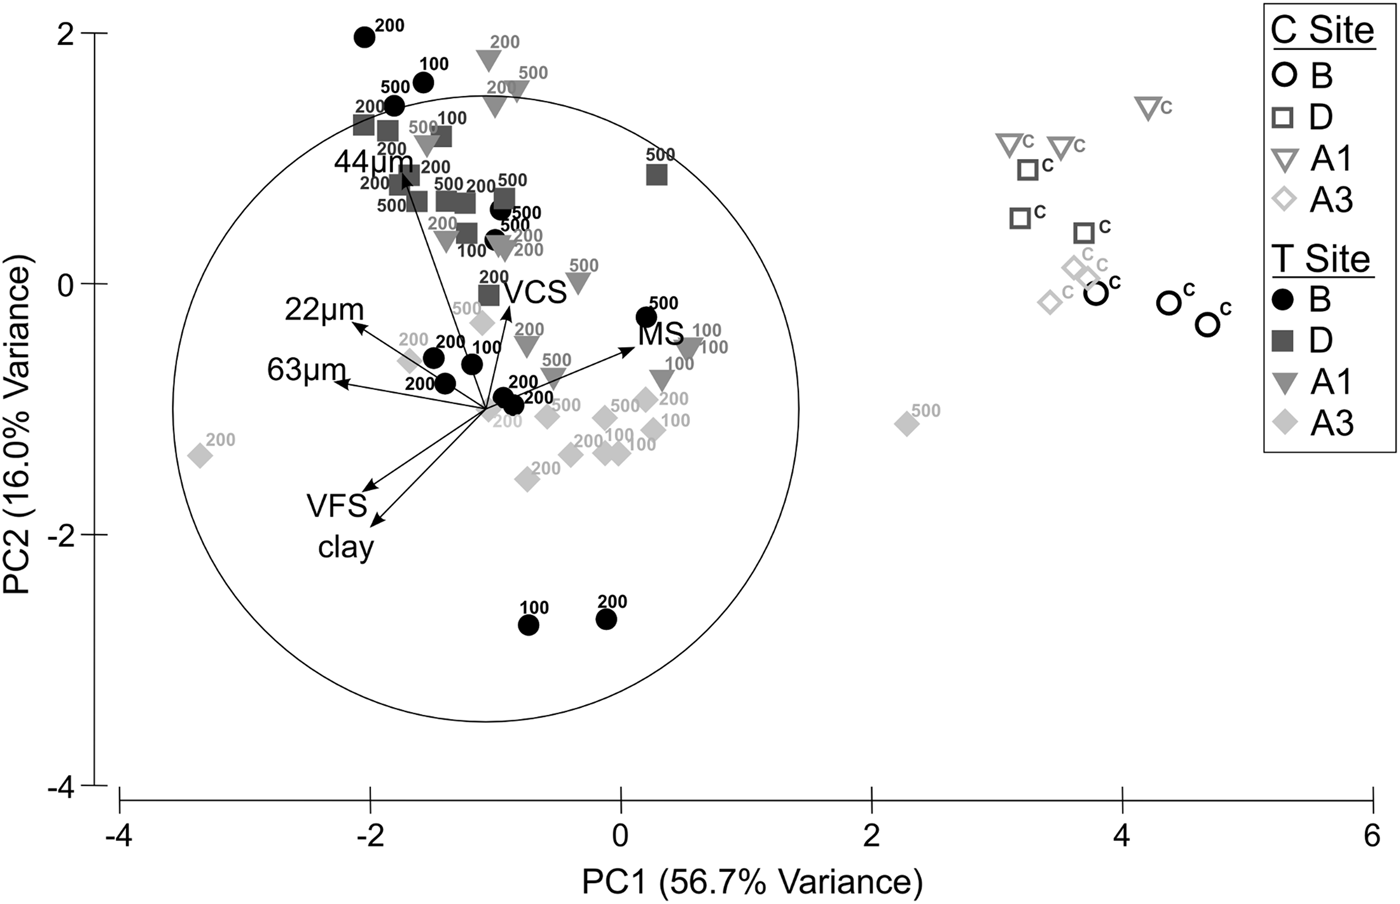
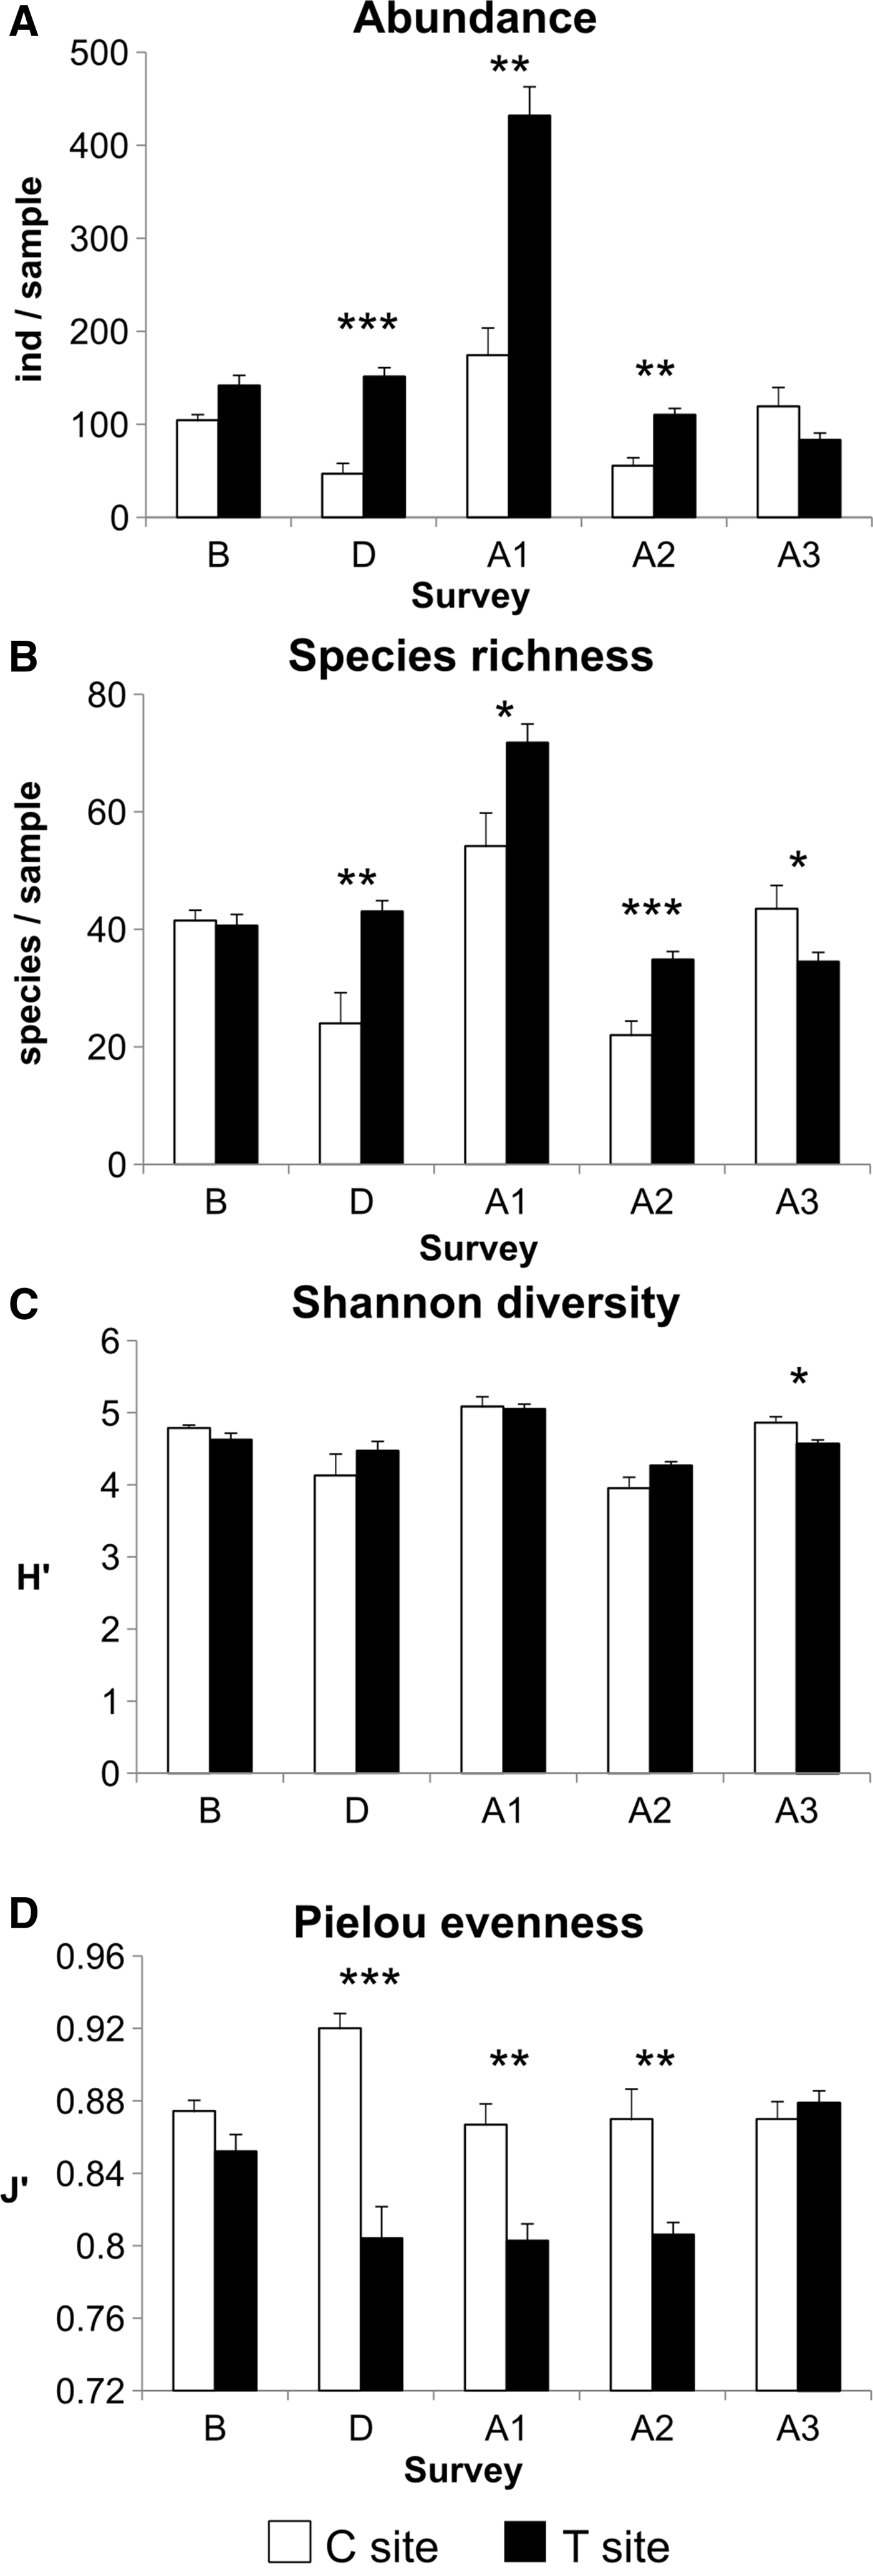
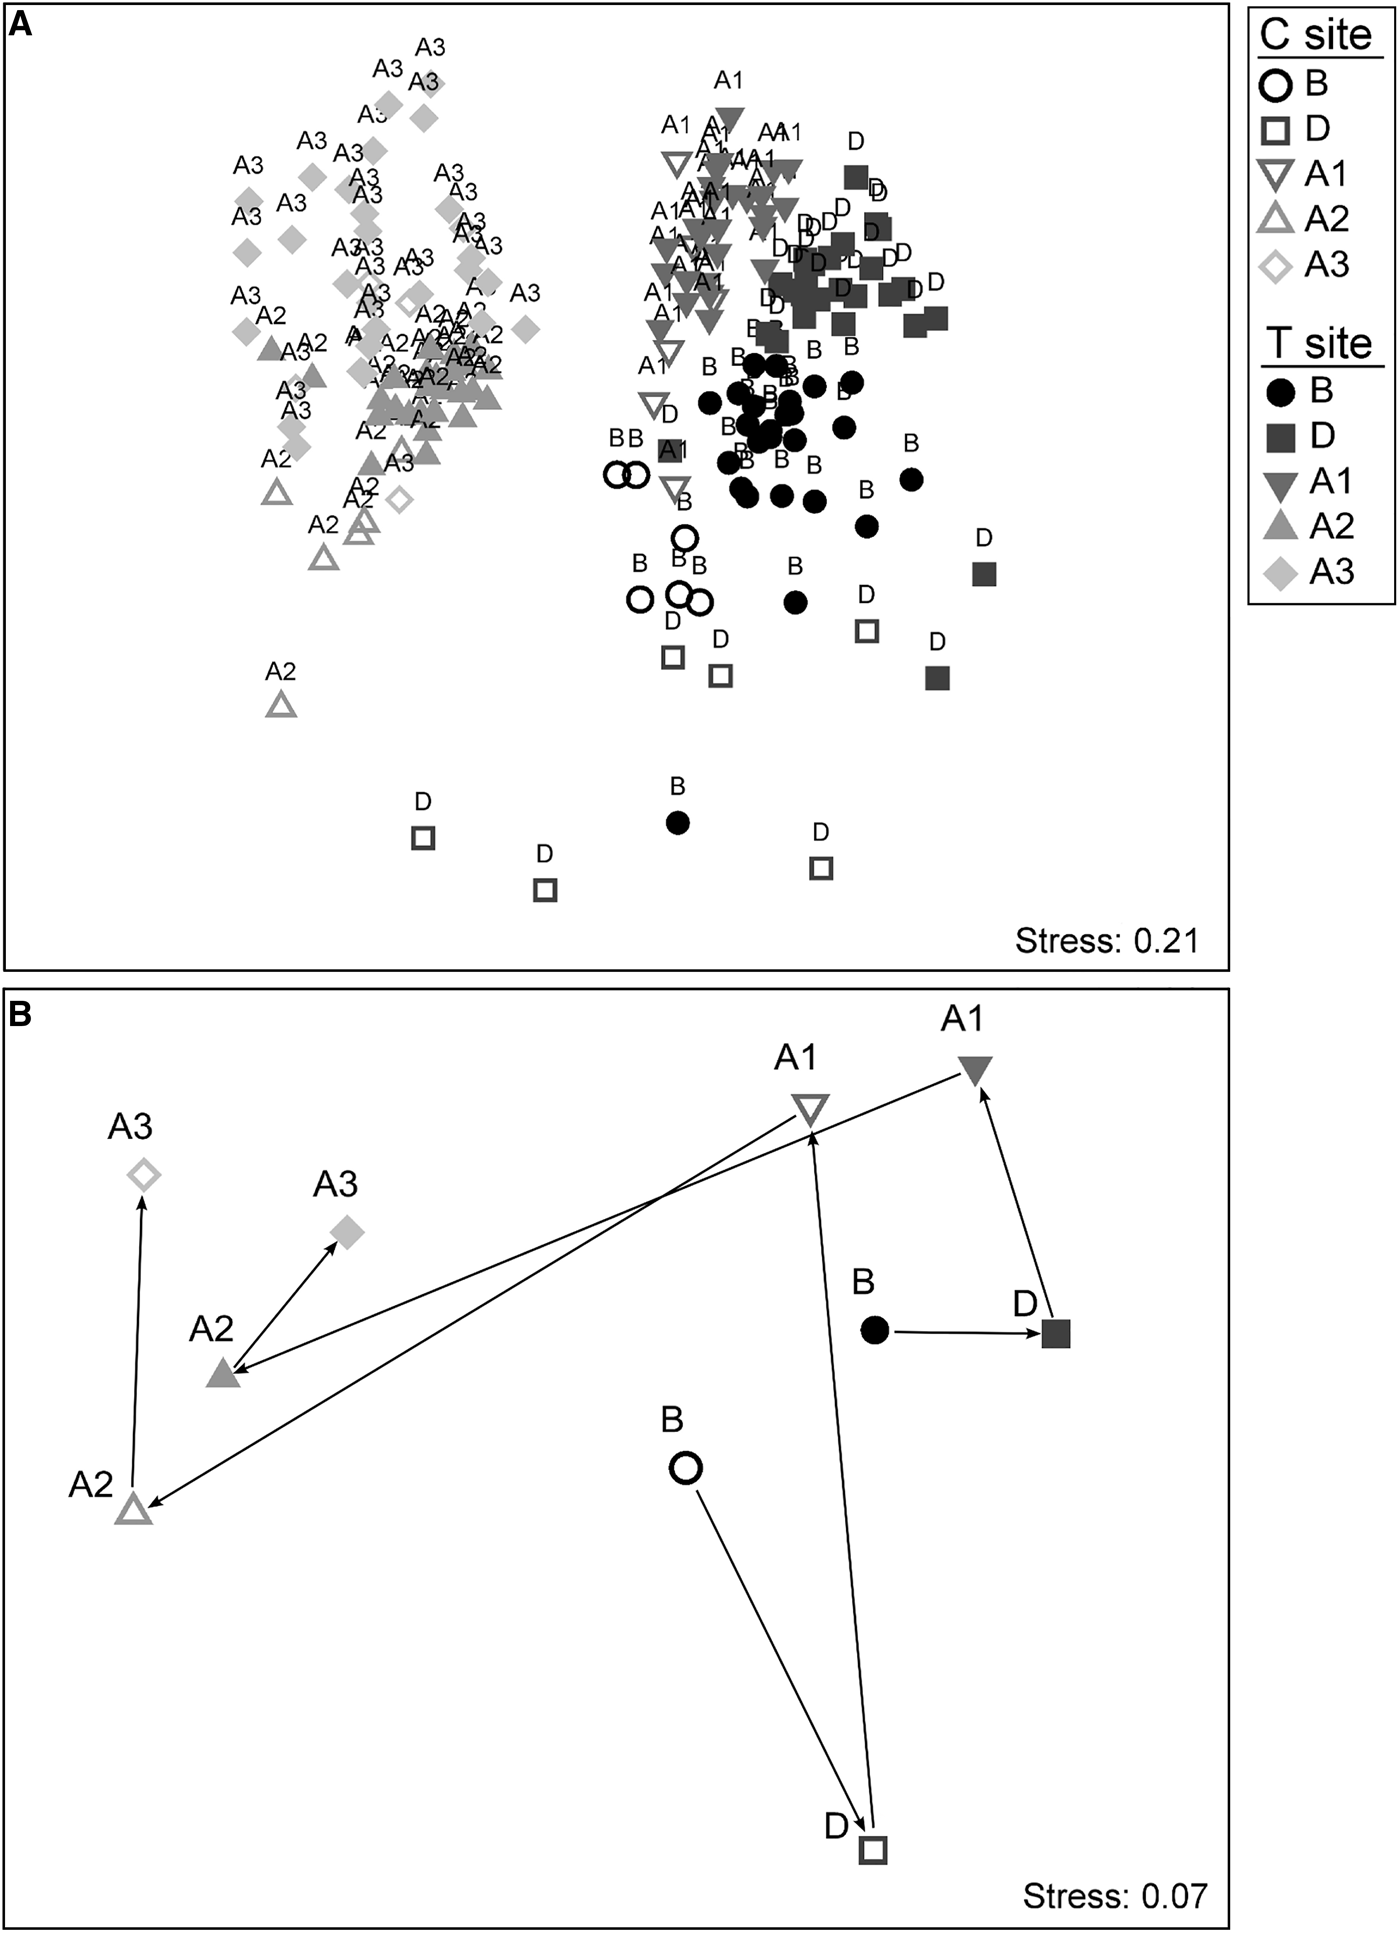
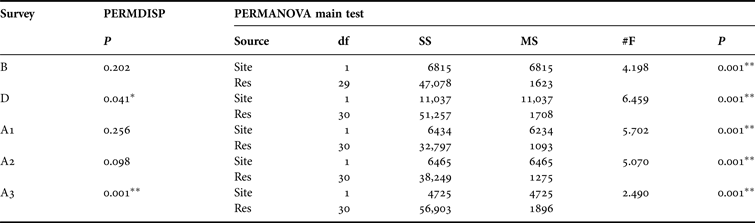
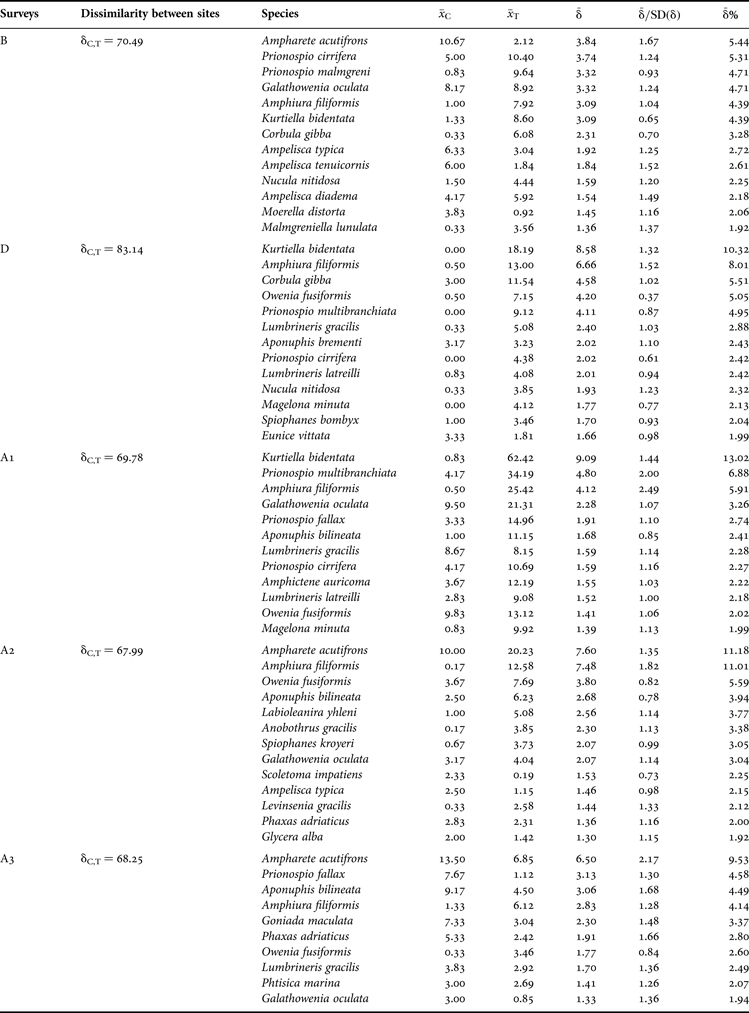
The principal component analysis (PCA) performed on sediment grain size data showed a clear differentiation along the first axis (PC1: 56.7% of variance) among stations of Control site (C), all located on the right side of the plot, and those of Terminal site (T), distributed on the left side. The 16% of variance, explained by the second axis (PC2), is determined by the fraction of 44 μm (Figure 2). Grain size fractions smaller than 63 μm, 22 μm and very fine sand displayed growth moving to the left of the plot, while medium sand grew to the opposite side. In the Control site (C) sediment grain size appears homogeneous in all surveys, characterized by medium and fine sand. Terminal site (T) is characterized by a more heterogeneous sediment grain size, differing from C site for fractions smaller than very fine sand. Regarding the B survey, points are distributed along axis 2, indicating granulometric composition variable in space; in the D survey points form a cluster in the upper part, indicating a homogeneous grain size composition with a high percentage of fraction smaller than 44 μm; A1 points move more toward the central part of the plot, while A3 points are definitively aggregated at the centre of the plot, along the first axis (PC1), indicating a heterogeneous grain size composition between medium sand and fine fractions (Figure 2). In the whole sampling area, over the entire sampling period, values of abundance for the whole macrofauna ranged from 19 to 693 ind per sample. The highest average of abundance was found in September 2010 in the stations around the LNG terminal. This was the first year since the beginning of the LNG Terminal activity (A1) where the number of organisms were found to be three times higher than in other sampling periods. Abundance of macrofauna was comparable between C and T sites during the B and the A3 survey only (Figure 3A). Across the entire sampling period, 388 different species of macrofauna were recognized. Species richness ranged between 11 and 116 species per sample. In the B survey similar values were found between the two sites. In the subsequent surveys, number of species was always higher in T than in C site, with the exception of the A3 survey. Highest values of species richness for both sites were found in the A1 survey (Figure 3B). Shannon diversity index showed comparable values between C and T sites across almost all sampling periods. During the A1 survey we detected slightly higher values than the other surveys (Figure 3C). In most of the sampling occasions, Pielou's evenness had lower values in T that in C site, the values being comparable only during B and A3 surveys. Highest values were detected in C site during the construction of the Terminal (D survey) (Figure 3D). The global nMDS plot shows a sharp separation between two groups of points, which include the samples from B, D and A1 surveys, and the samples from A2 and A3 years (Figure 4A). However, all samples of each survey appear neighbours, to form a cluster. More in detail, it can be observed that Control and Terminal points from the same survey are displaced relatively close together to each other, with the exception of Control points of the D survey which lay in the bottom of the plot, in a more scattered group (Figure 4A). Taking into account the trajectories of centroids, nMDS plot indicates that the evolution of the benthic assemblages in C and T sites diverged between the first survey (B) and the survey carried out during the construction yard activities (D). In the subsequent campaigns (A1, A2 and A3), the centroids relative to C and T sites seem to shift in a similar way, drawing almost parallel paths on the plot (Figure 4B). PERMDISP analysis evidenced a significantly different degree in multivariate dispersion among Control and Terminal in D and A3 surveys (Table 1). PERMANOVA showed significant differences in Site factor (Terminal vs Control) in all the sampling times, including the B survey (Table 1). SIMPER analysis for factor Site is shown in Table 2. Before the construction of the Terminal (B survey) the average Bray–Curtis dissimilarity between T and C site was 70.49, and this was made up of 3.84 from Ampharete acutifrons (Grube, 1860), with higher abundances in the C site, and 3.74 from Prionospio cirrifera Wirén, 1883, 3.32 from P. malmgreni Claparède, 1869, and 3.09 from Amphiura filiformis (O.F. Müller, 1776), with higher abundances in T site (Table 2). During the construction yard activities (D survey) the dissimilarity increased to 83.14 owing to the higher abundances of Kurtiella bidentata (Montagu, 1803), A. filiformis, Prionospio multibranchiata Berkeley, 1927, in the T site, which together with Corbula gibba (Olivi, 1792), and Owenia fusiformis Delle Chiaje, 1844, accounted for 33.84% of the average dissimilarity between sites (Table 2). Two years after the construction of the Terminal (A1 campaign) the dissimilarity between the two sites decreased to 69.78, and also in this case was mainly due to the higher abundances of the species K. bidentata, P. multibranchiata, A. filiformis in the T site (Table 2). In the subsequent surveys, A2 and A3, the dissimilarity values between sites were 67.99 and 68.25, respectively. Breakdown of dissimilarity revealed that in A2 the relative contribution was made up to 11.18 from A. acutifrons and 11.01 from A. filiformis which were more abundant in T site. On the contrary, in A3 survey, most of the discriminating species showed higher abundances in C site, including A. acutifrons, Prionospio fallax Söderström, 1920, Aponuphis bilineata (Baird, 1870) and Goniada maculata Örsted, 1843, while A. filiformis remained most abundant in T site (Table 2).
Principal Component Analysis (PCA) ordination of samples from sampling stations at Control (C) and at Terminal site (100, 200 and 500 m from the LNG terminal) in four sampling surveys, based on the normalized grain size data. VCS, very coarse sand and coarse sand; MS, medium sand; VFS, very fine sand and fine sand; 63 mm, silt fraction range 63–44 mm; 44 mm, silt fraction range 44–22 mm; 22 mm, silt fraction >22 mm; clay, clay fraction.
Mean values (+SE) for (A) total macrofauna abundance, (B) species richness, (C) Shannon's diversity index and (D) Pielou's evenness index recorded in the sampling area at Control and at Terminal site in the different sampling surveys. Black bars, Control (C) Site; white bars, Terminal (T) Site. Mann–Whitney significance test, ***P < 0.001; **P < 0.01; *P < 0.05.
nMDS ordination plot of (A) sampling points and (B) centroids derived from Bray–Curtis similarity matrix calculated on square-root transformed data abundances. from different Sites and Surveys. Sites: C, Control; T, Terminal. Surveys: B, June 2006; D, October 2008; A1, September 2010; A2, July 2011; A3, July 2012.
Results of the PERMDISP test (P-values) and one-way PERMANOVA analysis performed for Site factor in the different surveys. P-values are based on 999 permutations.
*P < 0.05; **P < 0.01.
Breakdown of the average dissimilarity (SIMPER) between Site C and T into contribution from the most discriminating species for each survey (B, D, A1, A2, A3). Cut-off is first species with less than 2% average contribution to the dissimilarity.
For each species:  $\bar x$, average abundance (ind. sample−1) in each of the two sites;
 ${\rm \bar \delta} $, average contribution to dissimilarity;
 ${\rm \bar \delta /SD(\delta)}$, ratio between contribution to dissimilarity and its relative Standard Deviation;
 ${\rm \bar \delta} $%, per cent average contribution to the dissimilarity.
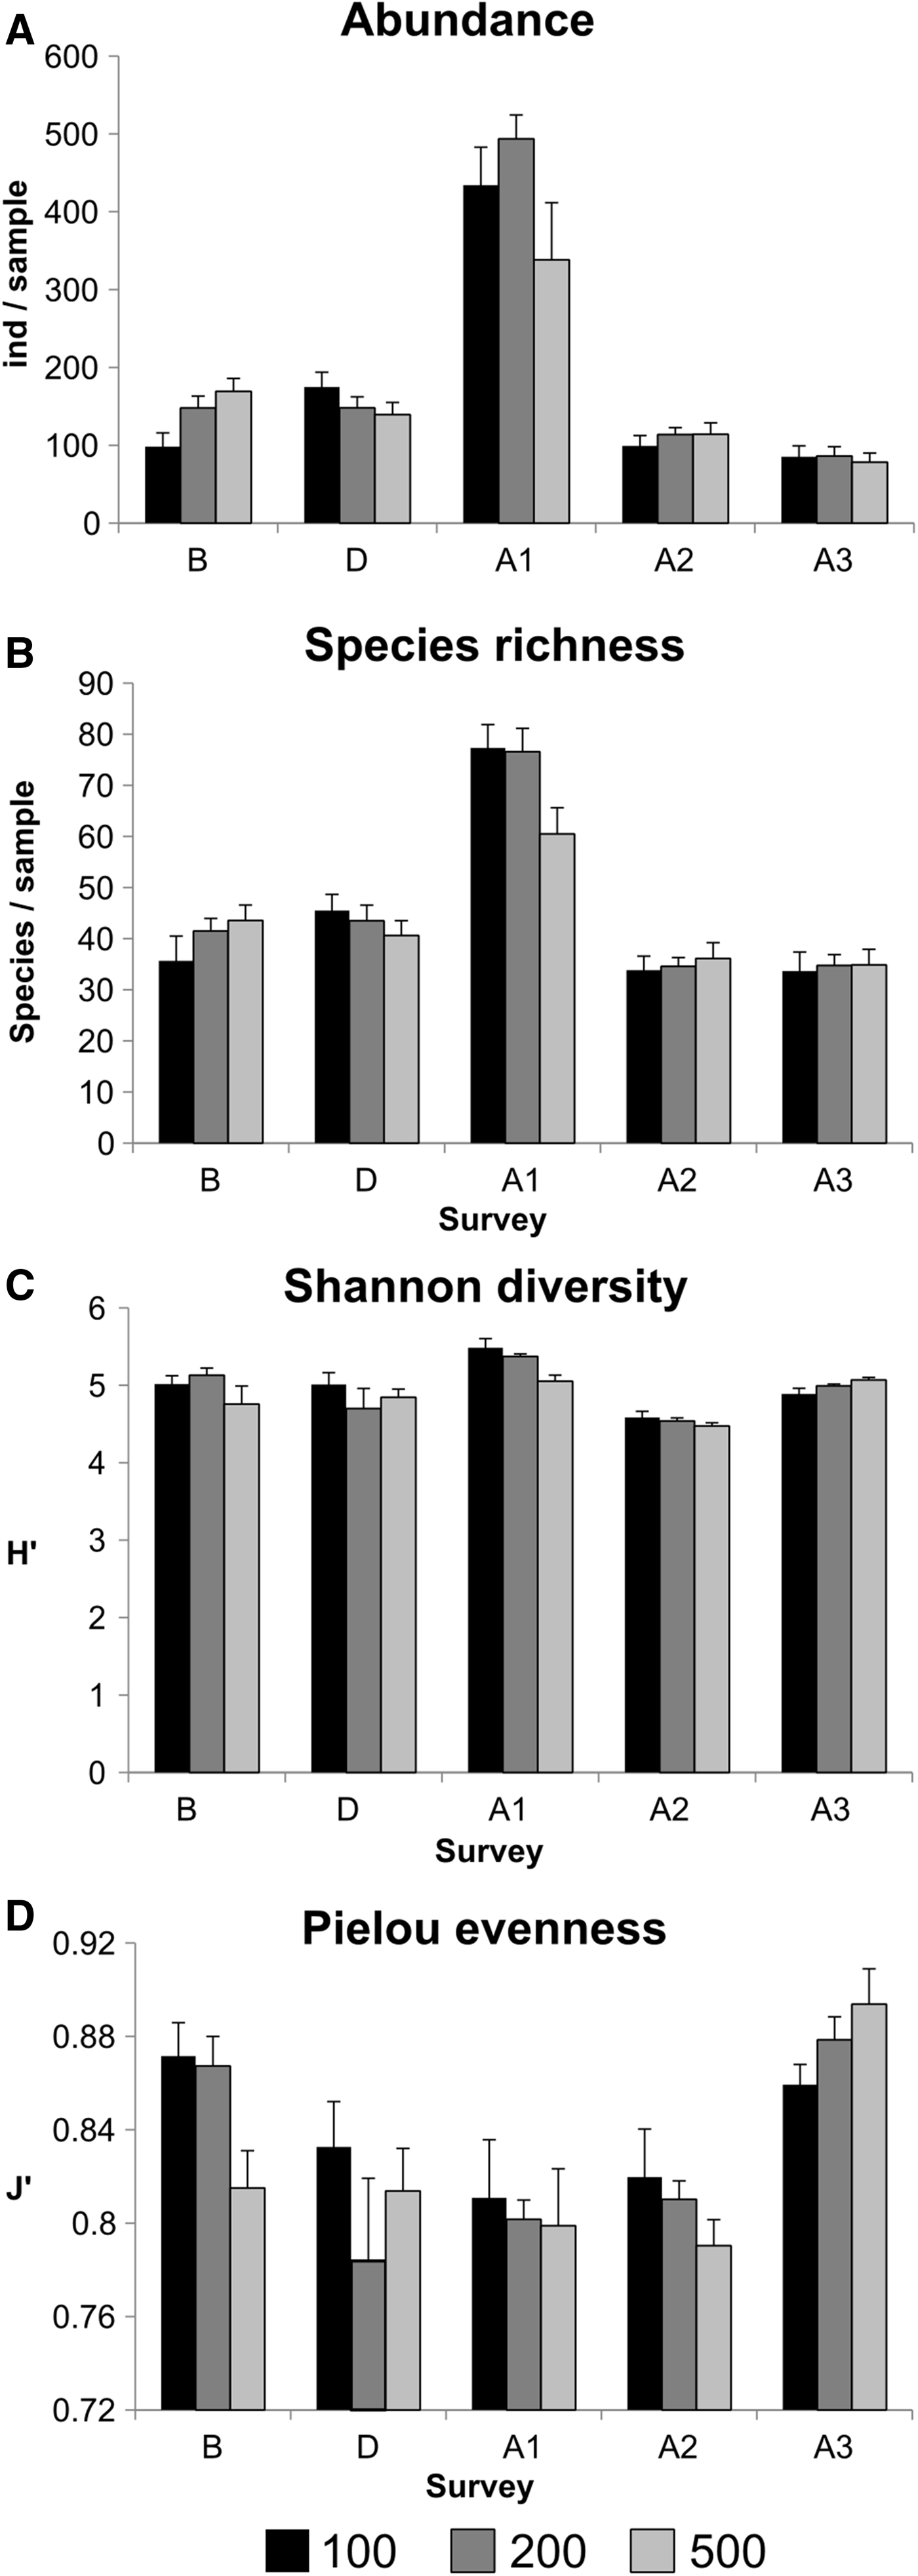
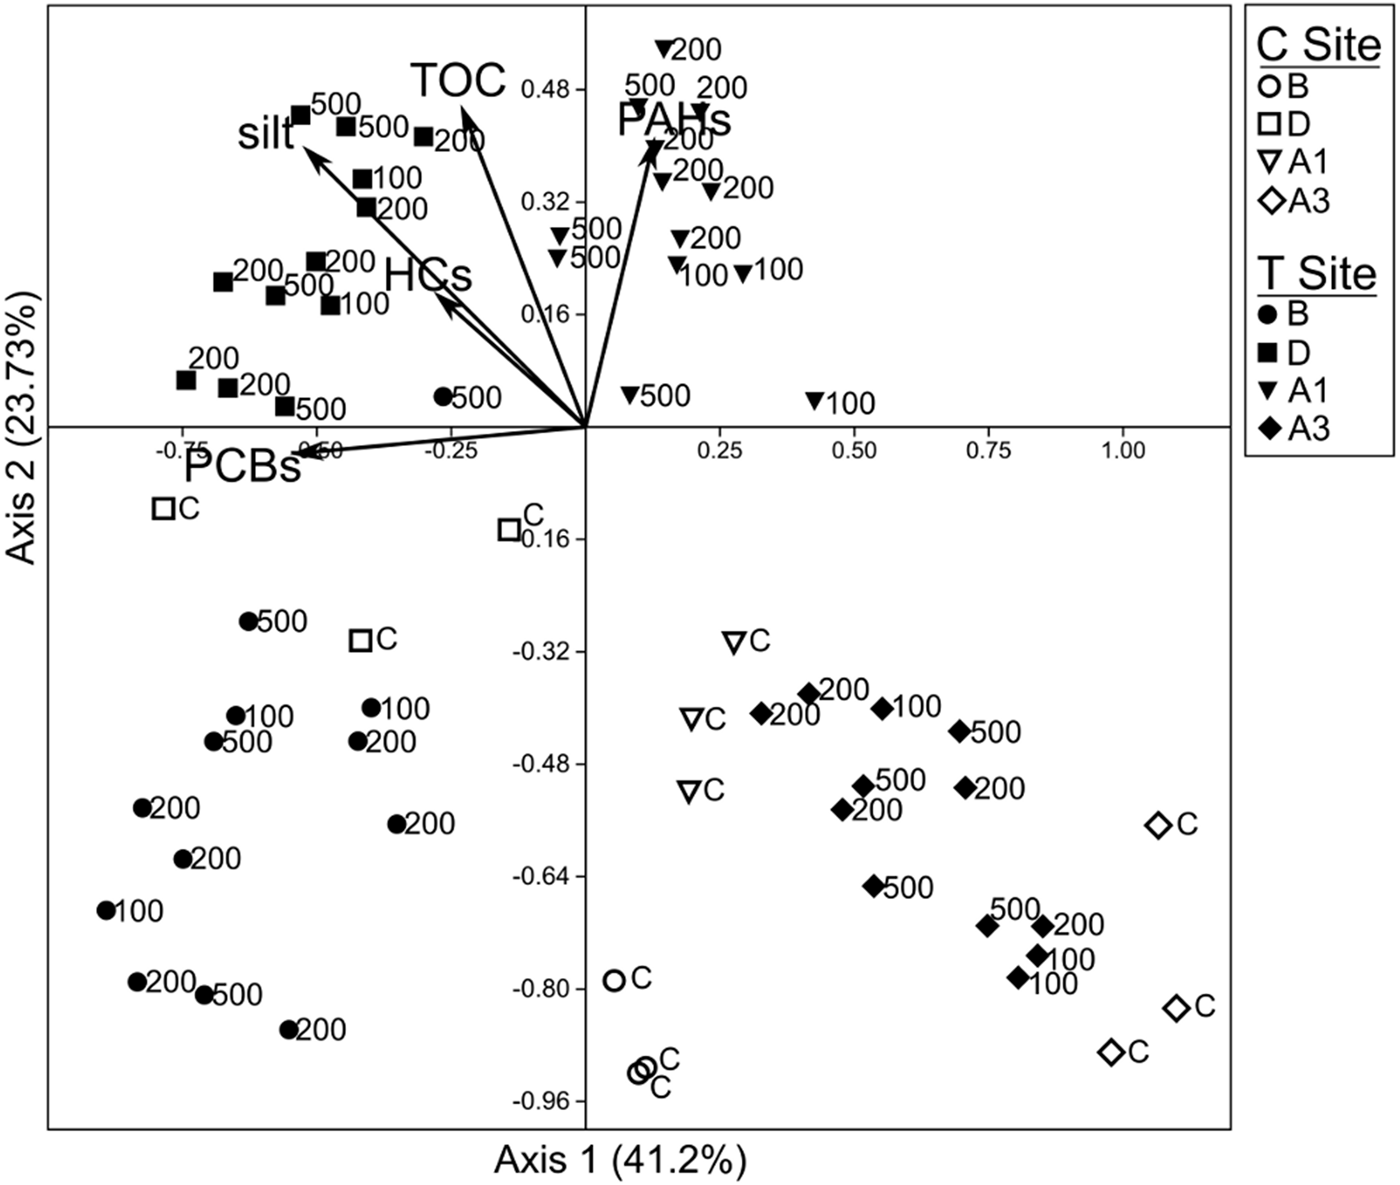
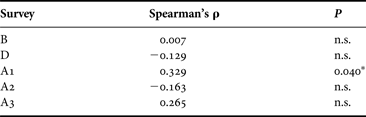
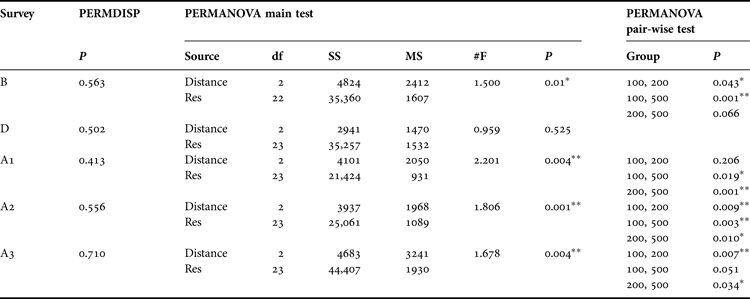
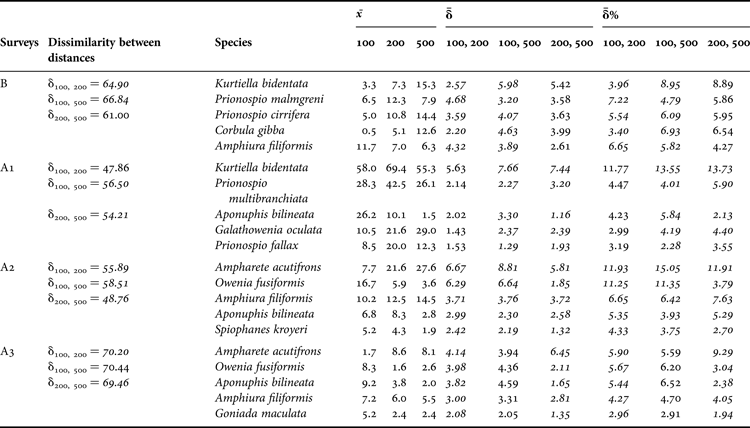
To analyse the presence of a gradient at increasing distances (100, 200 and 500 m) from the LNG terminal, the subsequent analysis were focused on the terminal area only. Before proceeding with the analysis of the possible effects of the LNG Terminal on benthic communities at different distances from the structure, we tested for the presence of a spatial correlation among all sampling stations in the terminal area. Testing for spatial non-independence of multivariate data is needed to avoid problems of spatial non-independence of data, which can lead to spurious results and misinterpretations of the outcomes of the subsequent tests (Legendre, Reference Legendre1993; Dormann, Reference Dormann2007; Fiorentino et al., Reference Fiorentino, Caruso and Terlizzi2012). RELATE analysis outlined that, at the investigated spatial scale, in most sampling surveys no spatial correlation was found between the displacement of the sampling stations and the multivariate composition of the macrofaunal assemblages. Only in the A1 survey a low, but significant, correlation was found (Table 3). Abundance and species richness were higher in September 2010 (A1) than in all the other sampling surveys, at all investigated distances from the LNG terminal, particularly at 100 and 200 m from it (Figure 5A, B). In LNG serminal site values of abundance ranged from 26 to 693 ind·per sample and number of species ranged between 12 and 116 units per sample. Shannon diversity index showed comparable values at all distances across all sampling times. In the A1 and A2 surveys slightly higher and lower values respectively were detected in comparison with the B survey (Figure 5C). Evenness values appeared to be higher before the construction of the structure (B) and after 3 years of operation (A3), in comparison with the D, A1 and A2 surveys, no significant differences have been detected among different distances (100, 200, 500) from the LNG Terminal (Figure 5D). PERMDISP analysis between the Distances from the terminal show the absence of significant differences, during all the surveys (Table 4). PERMANOVA allowed us to detect differences at various Distances in all surveys, with the exception of the yard activities (B) period (Table 4). Pair-wise test showed that, also before the construction of the structure (B survey), significant differences were found between the assemblages at 100 m, and the ones at 200 and 500 m from the future terminal (Table 4). Contrarily, during the A1 survey, the macrobenthic assemblages at 500 m from the terminal were significantly different from those at 100 and 200 m, which, in turn, did not differ significantly between them (Table 4). Differences between Distances were all significant during A2 survey, while in the last year of operation of the Terminal (A3 survey), only the communities at 200 m from the terminal were significantly different from those at a distance of 100 and 500 m, which were not dissimilar between them (Table 4). Results of SIMPER analysis for factor Distance is shown in Table 5. During the B survey, the highest percentage contribution to dissimilarity between 100 and 200 m was made up of 7.22% from Prionospio malmgreni and 6.65% from Amphiura filiformis. Dissimilarity between 100 and 500 m was 8.95% from Kurtiella bidentata, 6.93% from Corbula gibba and 6.09% from Prionospio cirrifera. Two years after the construction yard activities (A1 survey), K. bidentata was the species with the highest contribution to the dissimilarity between 100 and 500 m (7.66), and between 200 and 500 m (7.44). In the A2 survey, the dissimilarity between the distances was primarily due to Ampharete acutifrons (contribution to dissimilarity up to 15.05%), whose abundances were gradually increasing with the distance from the terminal, and to Owenia fusiformis (up to 11.35%), whose abundances gradually decreased moving from 100 to 500 m (Table 5). After 3 years of operation of the terminal (A3), A.acutifrons was the best discriminating species between 200 and 500 m (contribution to dissimilarity 9.29%), and between 100 and 200 m (5.90%), followed by Owenia fusiformis (up to 5.67%), Aponuphis bilineata (up to 5.44%) and A. filiformis (up to 4.27%). The canonical correspondence analysis (CCA) showed a high inertia along the first axis (CC1: 41.2% of variance) due mostly to silt and PCBs vectors (Figure 6). For all surveys C site points are separate from those of the T site, which are displayed in each of the four quadrants of the plot. C site points are instead almost all in the II quadrant, except those of the D survey: this is related to an increase of silt and TOC during this period. Regarding T site points, during D and A1 surveys we observed a higher content of silt and TOC than in the B and A3 surveys, with a consequent greater quantity of PAHs, PCBs and HCs. A3 survey shows the least content of silt, and as a result of PAHs, PCBs and HCs (Figure 6).
Mean values (+SE) for: (A) total macrofauna abundance, (B) species richness, (C) Shannon's diversity index and (D) Pielou's evenness index recorded in the Terminal site at 100, 200 and 500 m from the LNG terminal in the different surveys. Distances: black, 100 m; dark grey, 200 m; light grey, 500 m. Surveys: B, June 2006; D, October 2008; A1, September 2010; A2, July 2011; A3, July 2012. Kruskal–Wallis significance test, ***P < 0.001; **P < 0.01; *P < 0.05.
Canonical Correspondence Analysis (CCA) ordination of samples from sampling stations at the Control (C) and the Terminal site (100, 200 and 500 m from the LNG terminal) in the four sampling surveys. Analysis is based on a biotic matrix of 394 species (not shown on the plot) and an abiotic matrix of five quantitative environmental variables (full line arrows). Silt, percentage of sediment silt content; TOC, total organic carbon; PAHs, total polycyclic aromatic hydrocarbons; PCBs, total polychlorinated biphenyls; HCs, total hydrocarbons.
Results of RELATE comparing the physical distance matrix (Euclidean distance) and the assemblage resemblance distance matrix (Bray–Curtis similarity) calculated between every pair of sampling stations of the terminal area, for each survey.
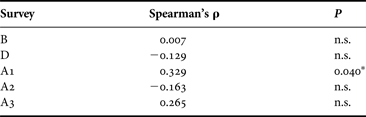
ρ = Spearman's rank correlation coefficient. n.s., not significant; *P < 0.05.
Results of the PERMDISP test, one-way PERMANOVA main test performed for Distance factor in the different surveys, and PERMANOVA pair-wise test between the levels of Distance factor. P-values are based on 999 permutation.
*P < 0.05; **P < 0.01.
Breakdown of the average dissimilarity (SIMPER) between Distances 100, 200 and 500 m into contribution from the most discriminating species in each survey. SIMPER routines were performed only for those surveys where significant differences were detected by PERMANOVA. Results for significant pair-wise comparisons detected in PERMANOVA test (see Table 4) are in italics. See online Appendix for full tables.
For each species:  $\bar x$, average abundance at each Distance;
 ${\rm \bar \delta} $, average contribution to dissimilarity between each pair of distances;
 ${\rm \bar \delta} $%, per cent average contribution to the dissimilarity between each pair of distances.
DISCUSSION
This is the first study displaying the analyses of the evolution of the macrobenthic community in the proximity of a LNG structure. Our data seemed to reveal that changes in benthic assemblages were mostly linked to the construction phase of the LNG plant, and, to some extent, are limited to the first period of activity of the terminal. Indeed, to corroborate this assertion, the level of chemicals in the resulting sediment were generally low, and comparable between every campaign of the different phase and with the control site, suggesting a very marginal role of chemical contamination in determining the observed gradients of variation in benthic assemblages. Macrofauna abundance and species richness highlighted higher values in the terminal site in comparison to the Control site from the yard activities survey (D) to the fourth survey (A2). Conversely, evenness in the T site had lower values than in the C site between D and A2 surveys. This seems to indicate that in the T site a temporary settlement of an additional number of opportunistic species, characterized by high abundances, may have appeared during and after the yard activities. This trend could be interpreted as a signal of a temporary imbalance in the organization of the benthic community of the Terminal site, probably induced by the construction activities, and therefore did not appear in the subsequent surveys. We observed that univariate measures of diversity tend to become similar in correspondence of the last survey (A3), suggesting a temporal trend in the macrozoobenthic community structure moving towards the pristine balance registered in B survey. On the other hand, multivariate analyses pointed out that between the T and C sites some differences in benthic assemblages were already present before, during and after the construction of the LNG terminal. This outcome seems to match with the results from grain size analysis, which showed that all the surveys were characterized by higher content of medium fine sand in the C site, and higher content of several silt fractions in the T site. An in-depth data analysis of the macrozoobenthic assemblage pointed out that dissimilarity between the two sites was mainly due to the presence, mostly in T site, of various species characterized by different ecological traits. Since our first survey in T site, we recorded the concurrent presence of species with ecological preference for sandy sediments (e.g. Owenia fusiformis), together with species linked to finer sediment (e.g. Ampharete acutifrons, Prionospio malmgreni, Goniada maculata, Kurtiella bidentata), and others known as indicators of organic enrichment and sedimentary instability (e.g. Prionospio ssp. Malmgren, 1867, Amphiura filiformis, Corbula gibba) (Sigvaldadóttir & Mackie, Reference Sigvaldadóttir and Mackie1993; Snelgrove & Butman, Reference Snelgrove and Butman1994; Blake, Reference Blake, Blake, Hilbig and Scott1996; Arvanitidis et al., Reference Arvanitidis, Koutsoubas, Dounas and Eleftheriou1999; Borja et al., Reference Borja, Franco and Perez2000; Martin et al., Reference Martin, Pinedo and Sarda2000; O'Reilly et al., Reference O'Reilly, Kennedy and Patterson2006). In the subsequent surveys, particularly during D phase, we recognized an increase in terms of abundance and richness for those species characterized by surface and subsurface deposit feeding traits. This fits well with the increased content of silt and TOC content outlined in the CCA analysis. Trajectories of centroids and dispersion of points in MDS analysis seemed to highlight the presence of some ‘noise’ in the data in the C site. An anomalous increase of the multivariate dispersion was detected in the C site points during the D survey. We may hypothesize that some erratic signal in our data may be related to unpredictable disturbances occurring in C site for unknown reasons. It has to be pointed out that, for security reasons, the maritime traffic is not allowed within a radius of 1 nautical mile from the LNG terminal. This protection measure, extended throughout all of the T site stations, prohibits all activity. Thus, this area can be considered to be a ‘protected area’ from the effects of human activity in the North Adriatic Sea (e.g. trawling, dumping activities). This is not the case for the Control site, which is located in an unsupervised area and is exposed to possible pressures. Focusing on the terminal area, we found a high number of species presenting an opportunistic behaviour. These species contribute to the sustained abundance of the whole macrofauna in the terminal area mostly during the yard activities construction (D). Moreover, we recorded a reduction of the natural patchiness of macrozoobenthic assemblages previously detected in the area surrounding the LNG structure before the construction yard activities. The described dynamics seem to have occurred over the whole terminal area up to a distance of 500 m from the yard activities. This seems to be substantiated both by the findings from the particle size analyses (PCA), and from other environmental parameters (CCA), which show a greater homogeneity in all the sediment parameters at various distances from the terminal in the yard activities survey. Biotic data seem to respond accordingly to this generalized flattening of the environmental conditions. Indeed, both the multivariate and univariate indexes showed no significant differences at different distances (100, 200, 500 m) from the LNG terminal during the yard survey (D). This seemed to indicate that yard activities may have resulted in increased re-suspension rates, causing an alteration in sedimentary characteristics of the areas close to the yard activities. Consequently, the presence of very fine particles of organic matter, both suspended and deposited on the sediment surface, may have promoted the presence of several species which can feed on deposits, as well as on suspended particles, such as the bivalve Kurtiella bidentata (Moodley et al., Reference Moodley, Heip and Middelburg1998) and the commonly associated ophiurid Amphiura filiformis (Ockelmann & Muus, Reference Ockelmann and Muus1978). The presence of species characterized by mixed functional traits distributed around the terminal site during the A1 sampling period seemed to highlight the presence of a rather complex community. The presence of significant correlation between the spatial arrangement of sampling stations and the Bray–Curtis measure of (dis)similarity during the A1 survey suggests some modification in spatial distribution of macrofauna. In this survey, we have observed that some species showed a decreasing trend in abundances moving from the closer (100 m) to the farthermost stations (i.e. Galathowenia oculata (Zachs, 1923)), while some other species showed an opposite pattern (i.e. Aponuphis bilineata). Barros et al. (Reference Barros, Underwood and Lindegarth2001) asserted that biota inhabiting the boundaries between two habitats naturally display great spatial and temporal variability in composition or relative abundance. Natural and artificial structures on the seabed (e.g. sub-tidal rocky reefs) may alter the distribution and abundance of species in adjacent sandy-bottom assemblages (Davis et al., Reference Davis, Vanblaricom and Dayton1982). Newly introduced structures may in fact modify soft-bottom habitats in several ways. They could alter the intensity of water movement, current patterns, rates of erosion or sedimentation, changes in sediment grain-size, organic content of sediments as well as number or type of predators (Ambrose & Anderson, Reference Ambrose and Anderson1990; Posey & Ambrose Jr., Reference Posey and Ambrose1994; Barros et al., Reference Barros, Underwood and Lindegarth2001). Nevertheless, the terminal can be an element of uniqueness in the morphology of the northern Adriatic Sea as it may act as shelter for fish and other mobile marine organisms, and provide a habitat for benthic organisms usually associated with hard substrates (Spagnolo et al., Reference Spagnolo, Panfili, Giampieri, Spegne and Trovatelli2002; Trabucco et al., Reference Trabucco, Cicero, Gabellini, Virno Lamberti, Di Mento, Bacci, Moltedo, Tomassetti, Panfili, Marusso and Cornello2006; Terlizzi et al., Reference Terlizzi, Bevilacqua, Scuderi, Fiorentino, Guarnieri, Giangrande, Licciano, Felline and Fraschetti2008; Virno Lamberti et al., Reference Virno Lamberti, Gabellini, Maggi, Nonnis, Manfra, Ceracchi, Trabucco, Moltedo, Onorati, Franceschini, Di Mento and Hughes2013). In our sample specimens we did not find any indication of the presence of species linked to the hard bottom. Nevertheless, it may be hypothesized that the physical structure of the terminal may influence sedimentation rates and then animal settlement. In the preliminary surveys carried out recently by remote operating vehicle (RV) inspections, the development of a complex hard-bottom community in a belt a few metres from the base of the LNG structure was evident. Therefore, in the coming years an evolution of the complexity of the benthic habitat in the areas surrounding the LNG terminal is highly plausible. Further studies would be desirable to understand the long-term consequences of the presence of the LNG terminal in the North Adriatic environment. Monitoring activities around the investigated areas are ongoing and scheduled up to 2017. The collection of a long-term data series is expected to shed more light on the effects of the presence of the LNG structure on the surrounding marine seabed. First analyses seem to indicate that the effects on benthic macrofauna, if any, were limited to the period of the construction yard activities, and some signal of alterations in diversity measures were found for the subsequent 2 years. On the basis of our data, comparable conditions with the Control area seemed to be reached during the last monitoring survey reported here. This research allowed us to gain a huge amount of data that could provide a reference for future similar studies and could facilitate the optimization of field and laboratory work.
Supplementary materials and methods
The supplementary material for this article can be found at http://www.journals.cambridge.org/MBI
ACKNOWLEDGEMENTS
The authors thank the crew of the Research Vessel ASTREA, Drs Valentina Bernarello and Dr Gianluca Franceschini for working support in field activities. We also thank Dr Gianluca Franceschini and Dr Otello Giovanardi (ISPRA Chioggia, Venice) for logistic support during sampling campaigns and ISPRA Chemical Laboratories for environmental analyses. We are grateful to Dr Annie Petrosyan for the critical reading of the manuscript. The authors are grateful to two anonymous reviewers for valuable comments and suggestions to greatly improve the quality of the paper.
FINANCIAL SUPPORT
This work was founded by Adriatic LNG S.r.l. (company established by Edison, Qatar Petroleum and ExxonMobil) as a part of the prescribed monitoring programme for the potential impact of the offshore gravity based structure for unloading, storing and re-gasifying Liquefied Natural Gas (LNG).