1 Introduction
Since the first experiments by Klebanoff, Tidstrom & Sargent (Reference Klebanoff, Tidstrom and Sargent1962) and Kline et al. (Reference Kline, Reynolds, Schraub and Runstadler1967), it was shortly realised that despite the conspicuous disorder of wall turbulence, the flow is far from structureless. Instead, fluid motions in the vicinity of walls can be apprehended as a collection of recurrent patterns usually referred to as coherent structures or eddies (Richardson Reference Richardson1922). Particularly interesting are those eddies carrying most of the kinetic energy and momentum, further categorised as streaks (regions of high and low velocity aligned with the mean-flow direction) and rolls/vortices (regions of rotating fluid). These eddies are considered the most elementary structures capable of explaining the energetics of wall-bounded turbulence as a whole, and are the cornerstone of modelling and controlling geophysical and industrial flows (Sirovich & Karlsson Reference Sirovich and Karlsson1997; Hof et al. Reference Hof, de Lozar, Avila, Tu and Schneider2010). The practical implications of wall turbulence are evidenced by the fact that approximately 25 % of the energy used by the industry is spent in transporting fluids along pipes or in propelling vehicles through air or water (Jiménez Reference Jiménez2013). Hence, understanding the dynamics of energy-eddies has attracted enormous interest within the fluid mechanics community (see reviews by Robinson Reference Robinson1991; Kawahara, Uhlmann & van Veen Reference Kawahara, Uhlmann and van Veen2012; Haller Reference Haller2015; McKeon Reference McKeon2017; Jiménez Reference Jiménez2018). In spite of the substantial advancements in the last decades, the causal interactions among coherent motions have been overlooked in turbulence research. In the present work, we frame the causal analysis of energy-eddies from an information-theoretic perspective.
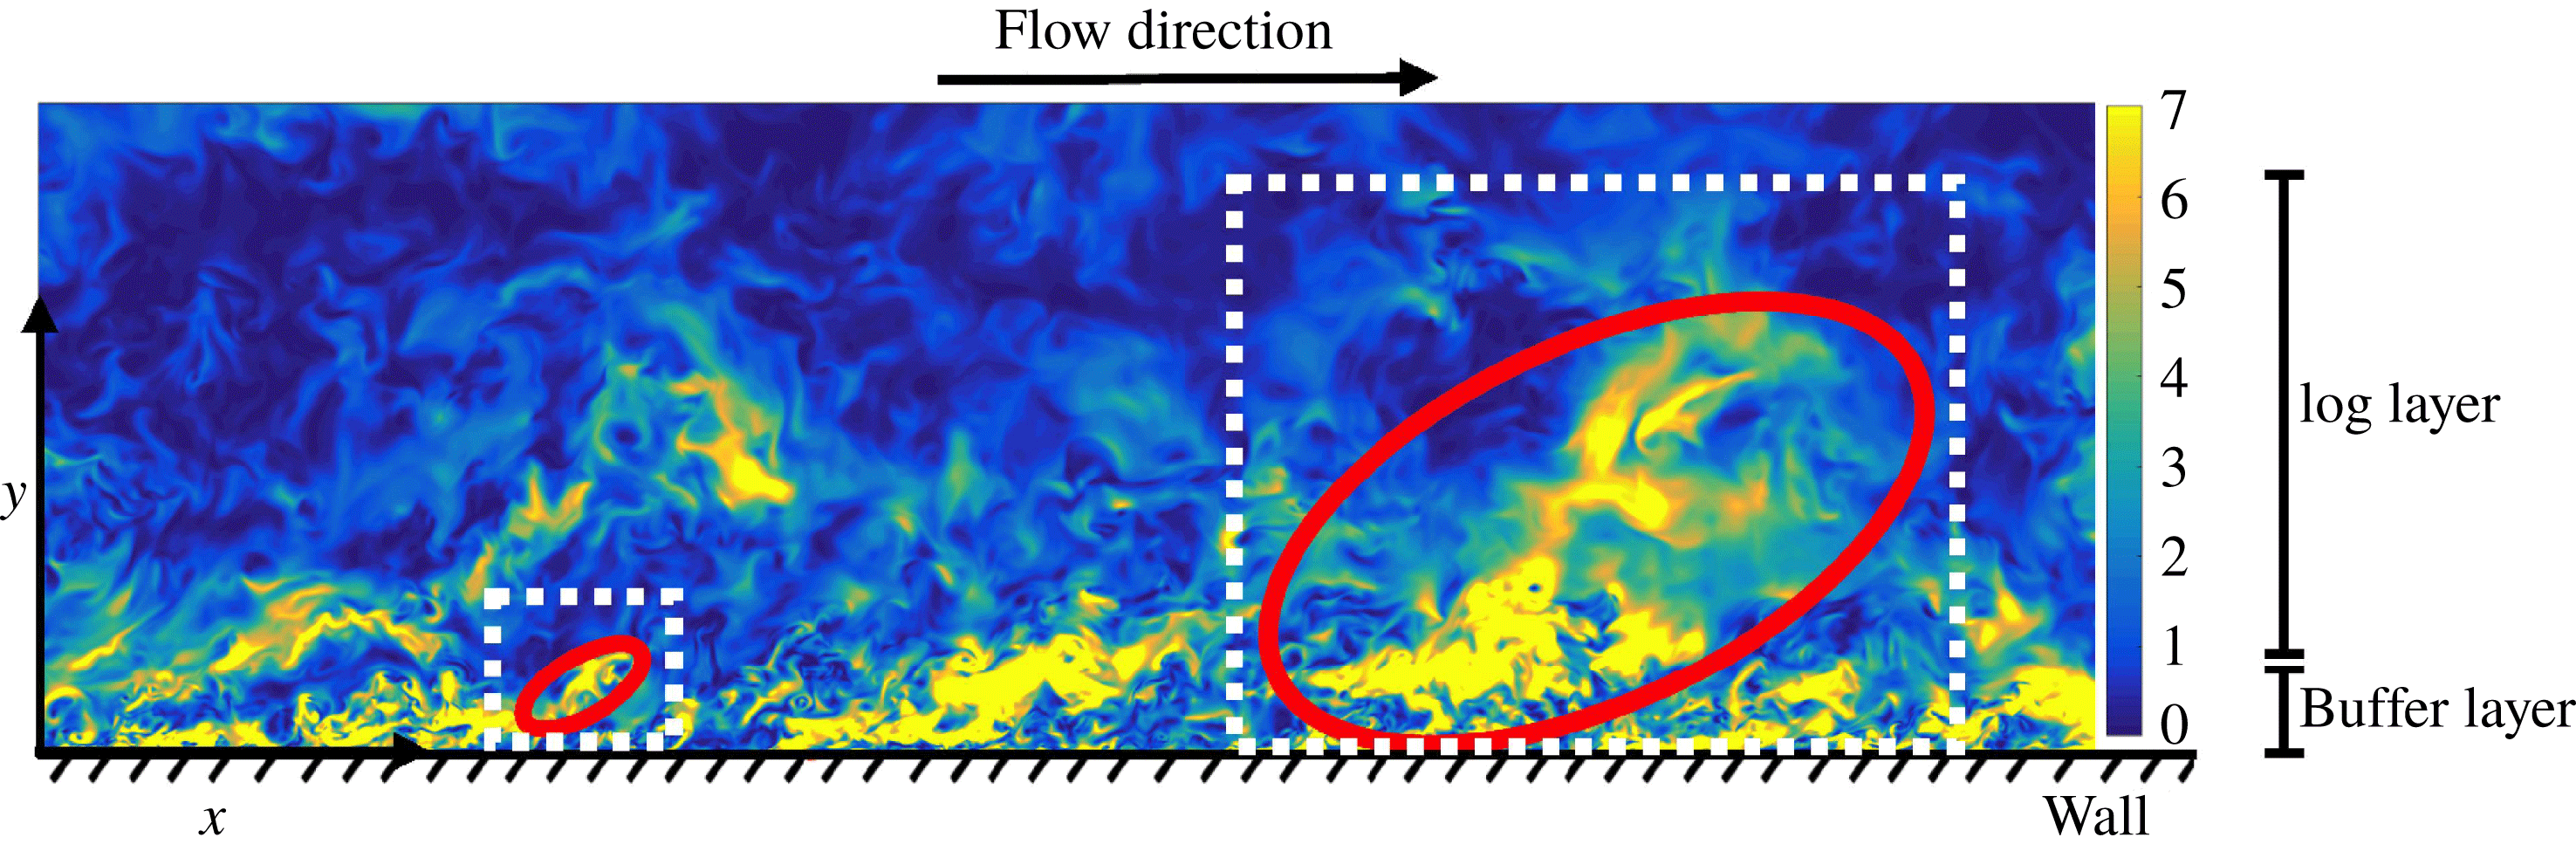
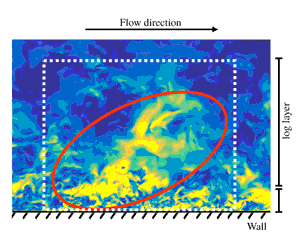
The most celebrated conceptual model for wall-bounded turbulence was proposed by Townsend (Reference Townsend1976), who envisioned the flow as a multiscale population of energy/momentum eddies starting from the wall and spanning a wide range of sizes across the boundary layer thickness as highlighted in figure 1. The conceptualisation of the flow as a superposition of energy-eddies of different sizes is usually referred to as the wall-attached eddy model. The smallest energy-eddies are located closer to the wall, in the buffer layer, and their sizes are dictated by the limiting effect of the fluid viscosity. For example, the size of the buffer layer energy-eddies may be of the order of millimetres for atmospheric flows (Marusic, Mathis & Hutchins Reference Marusic, Mathis and Hutchins2010). Further from the wall, in the so-called logarithmic layer (log layer), the flow is also organised into energy-eddies that differ from those in the buffer layer by their larger dimensions, e.g. of the order of hundreds of metres for atmospheric flows (Marusic et al. Reference Marusic, Mathis and Hutchins2010).
Instantaneous turbulence kinetic energy,
 $(u^{\prime 2}+v^{\prime 2}+w^{\prime 2})/2$
, where the prime denotes fluctuating quantities with respect to their mean values defined by averaging in the homogeneous directions and time. The turbulence kinetic energy is normalised in wall units and plotted for planes parallel to streamwise and wall-normal directions. The data are from a direct numerical simulation (DNS) of a turbulent channel flow at
 $Re_{\unicode[STIX]{x1D70F}}\approx 4200$
in a non-minimal domain by Lozano-Durán & Jiménez (Reference Lozano-Durán and Jiménez2014a
). The red ovals highlight the location of energy-eddies of different sizes in the buffer and log layers, respectively, while the white dashed lines indicate the local domain of each eddy.

The existence of wall-attached energy-eddies as depicted above is endorsed by a growing number of studies. The footprint of attached flow motions has been observed experimentally and numerically in the spectra and correlations at relatively modest Reynolds numbers in pipes (Morrison & Kronauer Reference Morrison and Kronauer1969; Perry & Abell Reference Perry and Abell1975, Reference Perry and Abell1977; Bullock, Cooper & Abernathy Reference Bullock, Cooper and Abernathy1978; Kim Reference Kim1999; McKeon et al. Reference McKeon, Li, Jiang, Morrison and Smits2004; Guala, Hommema & Adrian Reference Guala, Hommema and Adrian2006; Bailey et al. Reference Bailey, Hultmark, Smits and Schultz2008; Hultmark et al. Reference Hultmark, Vallikivi, Bailey and Smits2012) and in turbulent channels and flat-plate boundary layers (Tomkins & Adrian Reference Tomkins and Adrian2003; Del Alamo et al. Reference Del Alamo, Jiménez, Zandonade and Moser2004; Hoyas & Jiménez Reference Hoyas and Jiménez2006; Monty et al. Reference Monty, Stewart, Williams and Chong2007; Hoyas & Jiménez Reference Hoyas and Jiménez2008; Vallikivi, Ganapathisubramani & Smits Reference Vallikivi, Ganapathisubramani and Smits2015; Chandran et al. Reference Chandran, Baidya, Monty and Marusic2017). Other works have extended the attached-eddy model (Perry & Chong Reference Perry and Chong1982; Perry, Henbest & Chong Reference Perry, Henbest and Chong1986; Perry & Marusic Reference Perry and Marusic1995) or complemented the original picture proposed by Townsend (Davidson, Nickels & Krogstad Reference Davidson, Nickels and Krogstad2006; Mizuno & Jiménez Reference Mizuno and Jiménez2011; Dong et al. Reference Dong, Lozano-Durán, Sekimoto and Jiménez2017; Lozano-Durán & Bae Reference Lozano-Durán and Bae2019). Reviews of Townsend’s model can be found in Smits, McKeon & Marusic (Reference Smits, McKeon and Marusic2011), Jiménez (Reference Jiménez2012, Reference Jiménez2013, Reference Jiménez2018) and Marusic & Monty (Reference Marusic and Monty2019).
Traditionally, wall-attached eddies have been interpreted as statistical entities (Marusic et al. Reference Marusic, Mathis and Hutchins2010; Smits et al. Reference Smits, McKeon and Marusic2011), but recent works suggest that they can also be identified as instantaneous features of the flow (see Jiménez Reference Jiménez2018, and references therein). The methodologies to identify instantaneous energy-eddies are diverse and frequently complementary, ranging from the Fourier characterisation of the turbulent kinetic energy (Jiménez Reference Jiménez2013, Reference Jiménez2015) to adaptive mode decomposition (Hellström, Marusic & Smits Reference Hellström, Marusic and Smits2016; Agostini & Leschziner Reference Agostini and Leschziner2019; Cheng et al. Reference Cheng, Li, Lozano-Durán and Liu2019), and three-dimensional clustering techniques (e.g. Del Álamo et al. Reference Del Álamo, Jiménez, Zandonade and Moser2006; Lozano-Durán, Flores & Jiménez Reference Lozano-Durán, Flores and Jiménez2012; Lozano-Durán & Jiménez Reference Lozano-Durán and Jiménez2014b ; Hwang & Sung Reference Hwang and Sung2018, Reference Hwang and Sung2019), to name a few. The detection and isolation of energy-eddies have deepened our understanding of the spatial structure of turbulence. However, the most interesting results are not the kinematic description of these eddies in individual flow realisations, but rather the elucidation of how they relate to each other and, more importantly, how they evolve in time.
In the buffer layer, the current consensus is that energy-eddies are involved in a temporal self-sustaining cycle (Jiménez & Moin Reference Jiménez and Moin1991; Hamilton, Kim & Waleffe Reference Hamilton, Kim and Waleffe1995; Waleffe Reference Waleffe1997; Schoppa & Hussain Reference Schoppa and Hussain2002; Farrell, Gayme & Ioannou Reference Farrell, Gayme and Ioannou2017) based on the emergence of streaks from wall-normal ejections of fluid (Landahl & Landahlt Reference Landahl and Landahlt1975) followed by the meandering and breakdown of the new-born streaks (Swearingen & Blackwelder Reference Swearingen and Blackwelder1987; Waleffe Reference Waleffe1995, Reference Waleffe1997; Kawahara et al. Reference Kawahara, Jiménez, Uhlmann and Pinelli2003). The cycle is restarted by the generation of new vortices from the perturbations created by the disrupted streaks. In this framework, it is hypothesised that streamwise vortices collect the fluid from the inner region, where the flow is very slow, and organise it into streaks (cf. Butler & Farrell Reference Butler and Farrell1993). Other works suggest that the generation of streaks is due to the structure-forming properties of the linearised Navier–Stokes operator, independently of any organised vortices (Chernyshenko & Baig Reference Chernyshenko and Baig2005). Conversely, the streaks are hypothesised to trigger the formation of vortices by losing their stability (Waleffe Reference Waleffe1997; Farrell & Ioannou Reference Farrell and Ioannou2012) or the collapse of vortex sheets via streamwise stretching (Schoppa & Hussain Reference Schoppa and Hussain2002). The reader is referred to Panton (Reference Panton2001) and Jiménez (Reference Jiménez2018) for reviews on self-sustaining processes in the buffer layer.
A similar but more disorganised scenario is hypothesised to occur for the larger wall-attached energy-eddies within the log layer (Flores & Jiménez Reference Flores and Jiménez2010; Hwang & Cossu Reference Hwang and Cossu2011; Cossu & Hwang Reference Cossu and Hwang2017). The existence of a self-similar streak/roll structure in the log layer consistent with Townsend’s attached-eddy model has been supported by the numerical studies by Del Álamo et al. (Reference Del Álamo, Jiménez, Zandonade and Moser2006), Flores & Jiménez (Reference Flores and Jiménez2010), Hwang & Cossu (Reference Hwang and Cossu2011), Lozano-Durán et al. (Reference Lozano-Durán, Flores and Jiménez2012) and Lozano-Durán & Jiménez (Reference Lozano-Durán and Jiménez2014b ), among others. A growing body of evidence also indicates that the generation of the log-layer streaks has its origins in the linear lift-up effect (Kim & Lim Reference Kim and Lim2000; Del Álamo & Jiménez Reference Del Álamo and Jiménez2006; Pujals et al. Reference Pujals, García-Villalba, Cossu and Depardon2009; Hwang & Cossu Reference Hwang and Cossu2010; Moarref et al. Reference Moarref, Sharma, Tropp and McKeon2013; Alizard Reference Alizard2015) in conjunction with Orr’s mechanism (Orr Reference Orr1907; Jiménez Reference Jiménez2012). Regarding roll formation, several works have speculated that they are the consequence of a sinuous secondary instability of the streaks that collapses through a rapid meander until breakdown (Andersson et al. Reference Andersson, Brandt, Bottara and Henningson2001; Park, Hwang & Cossu Reference Park, Hwang and Cossu2011; Alizard Reference Alizard2015; Cassinelli, de Giovanetti & Hwang Reference Cassinelli, de Giovanetti and Hwang2017), while others advocate for a parametric instability of the streamwise-averaged mean flow as the generating mechanism of the rolls (Farrell et al. Reference Farrell, Ioannou, Jiménez, Constantinou, Lozano-Durán and Nikolaidis2016).
Although it is agreed that both the buffer-layer and log-layer energy-eddies are involved in a self-sustaining cycle, their causal relationships have only been assessed indirectly by altering the governing equations of fluid motion (Jiménez & Pinelli Reference Jiménez and Pinelli1999; Hwang & Cossu Reference Hwang and Cossu2010, Reference Hwang and Cossu2011; Farrell et al. Reference Farrell, Gayme and Ioannou2017). Moreover, the mechanisms discussed above, each capable of leading to the observed turbulence structure, are rooted in simplified theories or conceptual arguments. Whether the flow follows any or a combination of these mechanisms is in fact unclear. Most interpretations stem from linear stability theory, which has proved successful in providing a theoretical framework to rationalise the length and time scales observed in the flow (Del Álamo & Jiménez Reference Del Álamo and Jiménez2006; Pujals et al. Reference Pujals, García-Villalba, Cossu and Depardon2009; Jiménez Reference Jiménez2015). However, a base flow must be selected a priori to enable the linearisation of the equations, which introduces an important degree of arbitrariness, and quantitative results are known to be sensitive to the details of the base state (Vaughan & Zaki Reference Vaughan and Zaki2011; Lozano-Durán, Karp & Constantinou Reference Lozano-Durán, Karp and Constantinou2018b ). Another criticism for linear theories comes from the fact that turbulence is a highly nonlinear phenomenon, and a complete self-sustaining cycle cannot be anticipated from a single set of linearised equations.
The limitations above have hampered the comparison of the flow dynamics in the buffer and log layers, and there is no conclusive evidence on whether the mechanisms controlling the eddies at different scales are of similar nature. One major obstacle arises from the lack of a tool in turbulence research that resolves the cause-and-effect dilemma and unambiguously attributes a set of observed dynamics to well-defined causes. This brings to attention the issue of causal inference, which is a central theme in many scientific disciplines but has barely been discussed in turbulent flows with the exception of a handful of works (Cerbus & Goldburg Reference Cerbus and Goldburg2013; Tissot et al. Reference Tissot, Lozano-Durán, Jiménez, Cordier and Noack2014; Liang & Lozano-Durán Reference Liang and Lozano-Durán2017; Bae, Encinar & Lozano-Durán Reference Bae, Encinar and Lozano-Durán2018a ). Given that the events in question are usually known in the form of time series, the quantification of causality among temporal signals has received the most attention. Typically, causal inference is simplified in terms of time correlation between pairs of signals. However, it is known that correlation lacks the directionality and asymmetry required to guarantee causation (Beebee, Hitchcock & Menzies Reference Beebee, Hitchcock and Menzies2012). To overcome the pitfalls of correlations, Granger (Reference Granger1969) introduced a widespread test for causality assessment based on the statistical usefulness of a given time signal in forecasting another. Nonetheless, there are ongoing concerns regarding the presumptions about the joint statistical distribution of the data as well as the applicability of Granger causality to strongly nonlinear systems (Stokes & Purdon Reference Stokes and Purdon2017). In an attempt to remedy this deficiency, recent works have centred their attention to information-theoretic measures of causality such as transfer entropy (Schreiber Reference Schreiber2000) and information flow (Liang & Kleeman Reference Liang and Kleeman2006; Liang Reference Liang2014). The former is notoriously challenging to evaluate, requiring long time series and high associated computation cost (Hlavackova-Schindler et al. Reference Hlavackova-Schindler, Palus, Vejmelka and Bhattacharya2007), but recent advancements in entropy estimation from insufficient datasets (Kozachenko & Leonenko Reference Kozachenko and Leonenko1987; Kraskov, Stögbauer & Grassberger Reference Kraskov, Stögbauer and Grassberger2004) and the advent of longer time series from numerical simulations have made transfer entropy a viable approach.
In this study, we use transfer entropy from information theory to quantify the causality among energy-eddies. Our goal is to compare the fully nonlinear self-sustaining processes in the buffer layer and log layer with minimum intrusion. We show that eddies in both layers follow comparable self-sustaining processes despite their vastly different sizes. Our findings are also used to inspect the implications of self-similar causality of energy-eddies for the control and modelling of wall turbulence.
The paper is organised as follows. The numerical experiments and methods are introduced in § 2. In § 2.1, we describe two numerical simulations to isolate the energy-eddies in the buffer layer and log layer, respectively. The characterisation of energy-eddies as time signals is discussed in § 2.2, and the methodology for quantifying causal interactions among the signals is offered in § 2.3. The results are presented in § 3. We first investigate the relevant time scales for causal inference in § 3.1, then the causal links among energy-eddies in § 3.2 and finally some applications to flow modelling in § 3.3. We conclude our study in § 4.
2 Numerical experiments and methods
2.1 Isolating energy-eddies at different scales
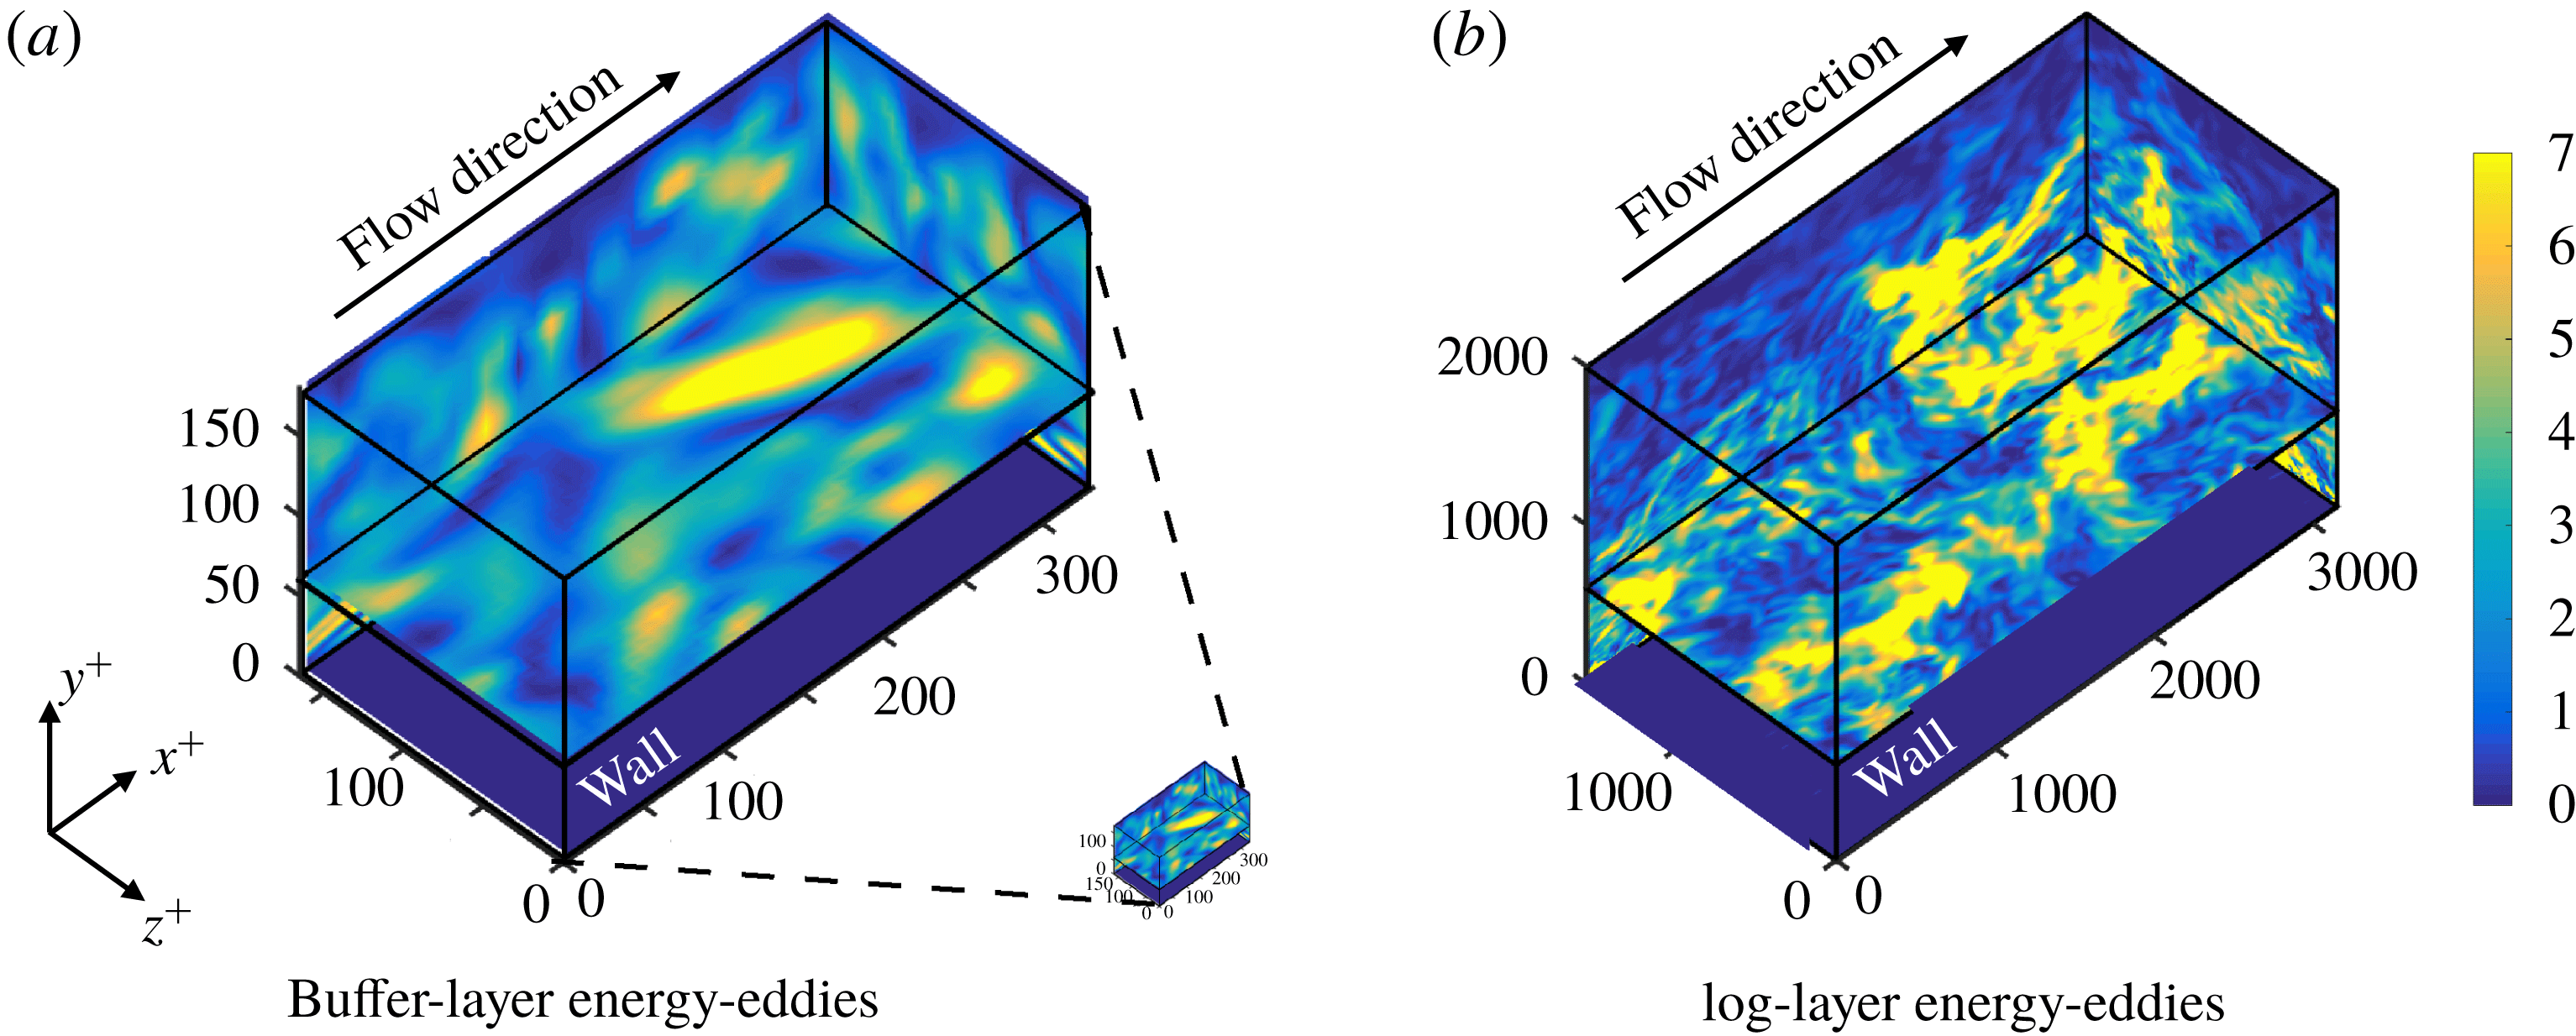
To investigate the self-sustaining process of the energy-eddies at different scales, we examine data from two temporally resolved DNS of an incompressible turbulent channel flow. Each simulation is performed within a computational domain tailored to isolate just a few of the most energetic eddies in either the buffer layer (Jiménez & Moin Reference Jiménez and Moin1991) or log layer (Flores & Jiménez Reference Flores and Jiménez2010), respectively, and can be considered as the simplest numerical set-up to study wall-bounded energy-eddies of a given size. The configuration of the two simulations is illustrated in figure 2(a,b) (see also movie 1 available at https://doi.org/10.1017/jfm.2019.801).
Minimal simulations of wall-bounded turbulence to isolate energy-eddies in (a) the buffer layer, and (b) the log layer. The quantity represented is the turbulence kinetic energy at different planes. Only half of the channel domain is shown in the
 $y$
-direction. The wall is located at
 $y^{+}=0$
, quantities are scaled in
 $+$
units and the arrows indicate the mean-flow direction. Panel (a) also includes the computational domain for the buffer-layer simulation, shown at scale with respect to the log-layer simulation in panel (b). See also Movie 1.

Hereafter, the streamwise, wall-normal and spanwise directions are denoted by
 $x$
,
 $y$
and
 $z$
, respectively, and the corresponding flow velocity components by
 $u$
,
 $v$
and
 $w$
. Each DNS is characterised by its friction Reynolds number
 $Re_{\unicode[STIX]{x1D70F}}=\unicode[STIX]{x1D6FF}/\unicode[STIX]{x1D6FF}_{v}$
, where
 $\unicode[STIX]{x1D6FF}$
is the channel half-height and
 $\unicode[STIX]{x1D6FF}_{v}$
is the viscous length scale defined in terms of the kinematic viscosity of the fluid,
 $\unicode[STIX]{x1D708}$
, and the friction velocity at the wall,
 $u_{\unicode[STIX]{x1D70F}}$
. Our friction Reynolds numbers are
 $Re_{\unicode[STIX]{x1D70F}}\approx 180$
for the buffer-layer simulation and
 $Re_{\unicode[STIX]{x1D70F}}\approx 2000$
for the log-layer case, which yield a scale separation of roughly a decade between the energy-eddies in each simulation. The disparity in sizes between the buffer- and log-layer DNS domains is remarked in figure 2. Lengths and velocities normalised by
 $\unicode[STIX]{x1D6FF}_{v}$
and
 $u_{\unicode[STIX]{x1D70F}}$
, respectively, are denoted by the superscript
 $+$
.
For the buffer-layer simulation, the streamwise, wall-normal and spanwise domain sizes are
 $L_{x}^{+}\approx 337$
,
 $L_{y}^{+}\approx 368$
and
 $L_{z}^{+}\approx 168$
, respectively. Jiménez & Moin (Reference Jiménez and Moin1991) showed that simulations in this domain constitute an elemental structural unit containing a single streamwise streak and a pair of staggered quasi-streamwise vortices, which reproduce reasonably well the statistics of the flow in larger domains. For the log-layer simulation, the length, height and width of the computational domain are
 $L_{x}^{+}\approx 3148$
,
 $L_{y}^{+}\approx 4008$
and
 $L_{z}^{+}\approx 1574$
, respectively. These dimensions correspond to a minimal box simulation for the log layer and are considered to be sufficient to isolate the relevant dynamical structures involved in the bursting process (Flores & Jiménez Reference Flores and Jiménez2010). Minimal log-layer simulations have also demonstrated their ability to reproduce statistics of full-size turbulence computed in larger domains (Jiménez Reference Jiménez2012).
The flow is simulated for more than
 $800\unicode[STIX]{x1D6FF}/u_{\unicode[STIX]{x1D70F}}$
after transients. This period of time is orders of magnitude longer than the typical lifetime of the individual energy-eddies in the flow, whose lifespans are statistically shorter than
 $\unicode[STIX]{x1D6FF}/u_{\unicode[STIX]{x1D70F}}$
(Lozano-Durán & Jiménez Reference Lozano-Durán and Jiménez2014b
). During the simulation, snapshots of the flow were stored frequently in time every
 $0.03\unicode[STIX]{x1D6FF}/u_{\unicode[STIX]{x1D70F}}$
(
 ${\approx}5\unicode[STIX]{x1D6FF}_{v}/u_{\unicode[STIX]{x1D70F}}$
) and
 $0.05\unicode[STIX]{x1D6FF}/u_{\unicode[STIX]{x1D70F}}$
(
 ${\approx}90\unicode[STIX]{x1D6FF}_{v}/u_{\unicode[STIX]{x1D70F}}$
) for the buffer and log layers, respectively. It is also convenient to normalise the values above with the time scale introduced by mean shear
 $S^{-1}$
, defined by averaging in the homogeneous directions, time and a prescribed band along the wall-normal direction. Selecting as representative bands
 $y^{+}\in [40,80]$
and
 $y^{+}\in [500,700]$
for the buffer layer and log layer, respectively (more details in § 2.2), our simulations span a period longer than
 $10^{3}S^{-1}$
, with a time lag between stored snapshots smaller than
 $0.5S^{-1}$
. The long yet temporally resolved datasets of the current study enable the statistical characterisation of many eddies throughout their entire life cycle.
The simulations are performed by discretising the incompressible Navier–Stokes equations with a staggered, second-order accurate, central finite difference method in space (Orlandi Reference Orlandi2000), and a explicit third-order accurate Runge–Kutta method (Wray Reference Wray1990) for time advancement. The system of equations is solved via an operator splitting approach (Chorin Reference Chorin1968). Periodic boundary conditions are imposed in the streamwise and spanwise directions, and the no-slip condition is applied at the walls. The flow is driven by a constant mean pressure gradient in the streamwise direction. For both the buffer and log layers, the streamwise and spanwise grid resolutions are uniform and equal to
 $\unicode[STIX]{x0394}x^{+}\approx 6$
, and
 $\unicode[STIX]{x0394}z^{+}\approx 3$
, respectively. The wall-normal grid resolution,
 $\unicode[STIX]{x0394}y$
, is stretched in the wall-normal direction following an hyperbolic tangent with
 $\unicode[STIX]{x0394}y_{min}^{+}\approx 0.3$
and
 $\unicode[STIX]{x0394}y_{max}^{+}\approx 10$
. The time step is such that the Courant–Friedrichs–Lewy condition is always below 0.5 during the run. The code has been validated in turbulent channel flows (Bae et al.
Reference Bae, Lozano-Durán, Bose and Moin2018b
,Reference Bae, Lozano-Durán, Bose and Moin
c
) and flat-plate boundary layers (Lozano-Durán, Hack & Moin Reference Lozano-Durán, Hack and Moin2018a
). Details on the parameters of the numerical set-up are included in table 1.
Geometry and parameters of the simulations:
 $Re_{\unicode[STIX]{x1D70F}}$
is the friction Reynolds number;
 $L_{x}^{+}$
and
 $L_{z}^{+}$
are the streamwise and spanwise dimensions of the numerical box in wall units, respectively;
 $\unicode[STIX]{x0394}x^{+}$
and
 $\unicode[STIX]{x0394}z^{+}$
are the spatial grid resolutions for the streamwise and spanwise direction, respectively;
 $\unicode[STIX]{x0394}y_{min}^{+}$
and
 $\unicode[STIX]{x0394}y_{max}^{+}$
are the finer (closer to the wall) and coarser (further from the wall) grid resolutions in the wall-normal direction. Here,
 $N_{x}$
,
 $N_{y}$
, and
 $N_{z}$
are the number of streamwise, wall-normal and spanwise grid points, respectively. The simulations are integrated for a time
 $Tu_{\unicode[STIX]{x1D70F}}/\unicode[STIX]{x1D6FF}$
, where
 $u_{\unicode[STIX]{x1D70F}}$
is the friction velocity and
 $\unicode[STIX]{x1D6FF}$
is the channel half-height;
 $S$
is the mean shear within the wall-normal bands
 $y^{+}\in [40,80]$
and
 $y^{+}\in [500,700]$
for the buffer layer and log layer, respectively, and
 $1/S^{+}$
defines a characteristic time scale for each layer.

2.2 Characterisation of energy-eddies as time signals
The next step is to quantify the kinetic energy carried by the streaks and rolls as a function of time. To do that, we use the Fourier decomposition,
 $\check{(\cdot )}$
, of each velocity component in the streamwise and spanwise directions (Onsager Reference Onsager1949), i.e.
 ${\check{u}}_{n,m}(y,t)$
,
 $\check{v}_{n,m}(y,t)$
and
 $\check{w}_{n,m}(y,t)$
, where the streamwise (
 $n$
) and spanwise (
 $m$
) wavenumbers are normalised such that
 $n=1$
(
 $m=1$
) represents one streamwise (spanwise) period of the domain. The velocities are first averaged in bands along the wall-normal direction to produce Fourier components (or modes) that do not depend on
 $y$
, e.g.
 $$\begin{eqnarray}\hat{u} _{n,m}(t)=\frac{1}{y_{1}-y_{0}}\int _{y_{0}}^{y_{1}}{\check{u}}_{n,m}(y,t)\,\text{d}y,\end{eqnarray}$$
and similarly for
 $\hat{v}_{n,m}(t)$
and
 ${\hat{w}}_{n,m}(t)$
. The bands selected are
 $(y_{0}^{+},y_{1}^{+})=(40,80)$
for the buffer layer and
 $(y_{0}^{+},y_{1}^{+})=(500,700)$
for the log layer. These bands are chosen consistently with the regions of realistic turbulence reported for minimal boxes in the buffer layer (Jiménez & Moin Reference Jiménez and Moin1991) and the log layer (Flores & Jiménez Reference Flores and Jiménez2010). It was tested that the results presented here are qualitatively similar for
 $y_{0}^{+}$
and
 $y_{1}^{+}$
within the range
 $[20,100]$
and
 $[300,900]$
for the buffer and log layers, respectively.
The process of decomposing
 $u$
(similarly for
 $v$
and
 $w$
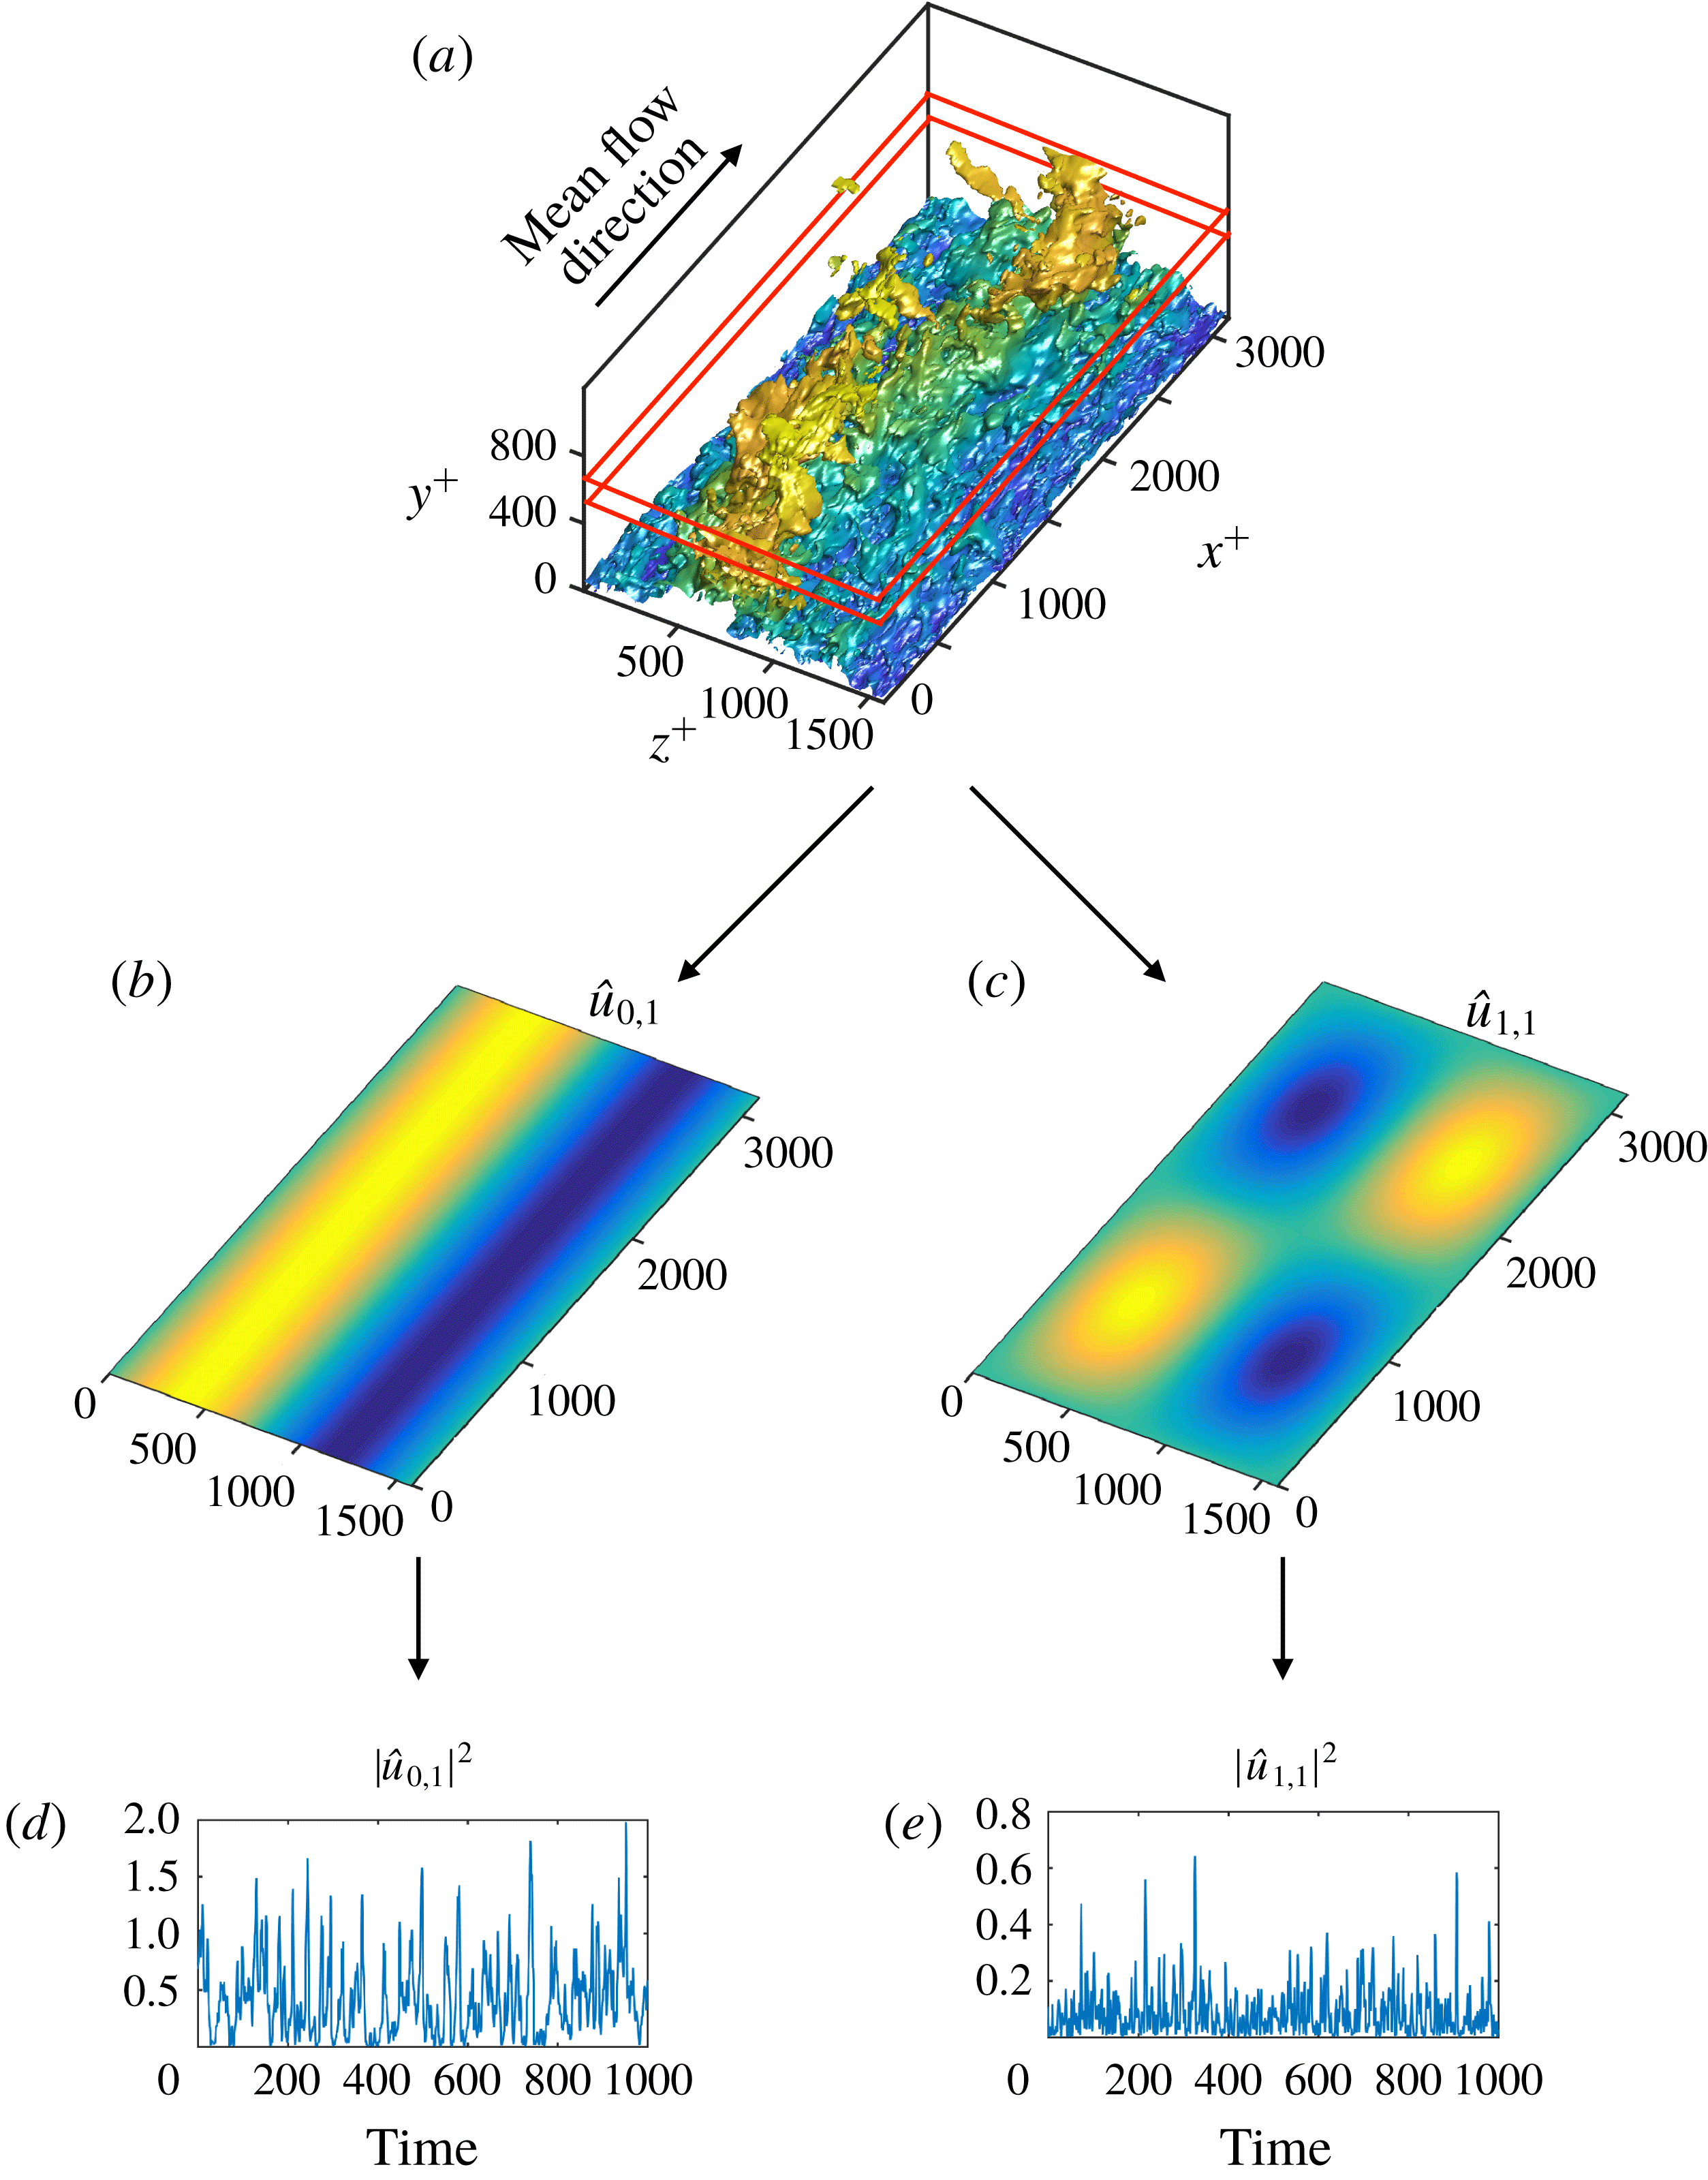
) into time signals for the log layer (similarly for the buffer layer) is schematically summarised in figure 3: the instantaneous
 $u$
(figure 3
a) is transformed into the wall-normal-averaged Fourier modes
 $\hat{u} _{0,1}$
and
 $\hat{u} _{1,1}$
, whose spatial structure is shown in figures 3(b) and 3(c), respectively. Then, the kinetic energy associated with each mode, namely,
 $|\hat{u} _{0,1}|^{2}$
and
 $|\hat{u} _{1,1}|^{2}$
, is obtained as a function of time as shown in figure 3(d,e). In this manner,
 $|\hat{u} _{0,1}|^{2}$
characterises the evolution of the kinetic energy of straight streaks, while meandering or broken streaks are represented by
 $|\hat{u} _{1,1}|^{2}$
. Analogously, rolls identified by
 $|\hat{v}_{n,m}|^{2}$
and
 $|{\hat{w}}_{n,m}|^{2}$
are divided into long motions (
 $|\hat{v}_{0,1}|^{2}$
and
 $|{\hat{w}}_{1,0}|^{2}$
) and short motions (
 $|\hat{v}_{1,1}|^{2}$
and
 $|{\hat{w}}_{1,1}|^{2}$
). The resulting set of signals can be arranged into a six-component vector (one per layer) defined by
 $$\begin{eqnarray}\boldsymbol{{\mathcal{V}}}(t)=[{\mathcal{V}}_{1},{\mathcal{V}}_{2},\ldots ,{\mathcal{V}}_{6}]=\left[|\hat{u} _{0,1}|^{2},|\hat{v}_{0,1}|^{2},|{\hat{w}}_{1,0}|^{2},|\hat{u} _{1,1}|^{2},|\hat{v}_{1,1}|^{2},|{\hat{w}}_{1,1}|^{2}\right].\end{eqnarray}$$
The vector
 $\boldsymbol{{\mathcal{V}}}(t)$
characterises the spatial and temporal evolution of energy-eddies, and all together account for approximately 50 % of the total kinetic energy of the flow within the wall-normal band considered in both layers.
Characterisation of energy-eddies as time signals. (a) Isosurface of the instantaneous streamwise velocity in the log layer. The value of the isosurface is 0.7 of the maximum streamwise velocity, coloured by the distance to the wall from dark blue (close to the wall) to light yellow (far from the wall). The red lines delimit the wall-normal region where
 $u$
is averaged. Panels (b,c) show the spatial structure of the Fourier modes associated with
 $\hat{u} _{0,1}$
and
 $\hat{u} _{1,1}$
, respectively. Panels (d,e) are the time evolution of
 $|\hat{u} _{0,1}|^{2}$
and
 $|\hat{u} _{1,1}|^{2}$
in the log layer. Time is normalised with the mean shear across the band considered for extracting the time signals, and the velocities are scaled in
 $+$
units.

2.3 Causality among time signals as transfer entropy
We use the framework provided by information theory (Shannon Reference Shannon1948) to quantify causality among time signals. The central quantity for causal assessment is the Shannon entropy (or uncertainty) of the signals, which is intimately related to the arrow of time (Eddington Reference Eddington1929). The connection between the entropy and the arrow of time is argued by the fact that the laws of physics are time symmetric at the microscopic level, and it is only from the macroscopic viewpoint that time asymmetries arise in the system. Such asymmetries can be statistically measured using information-theoretic metrics based on the Shannon entropy. Within this framework, causality from a
 ${\mathcal{V}}_{j}$
to
 ${\mathcal{V}}_{i}$
is defined as the decrease in uncertainty of
 ${\mathcal{V}}_{i}$
by knowing the past state of
 ${\mathcal{V}}_{j}$
. The method exploits the principle of time asymmetry of causation (causes precede the effects) and is mathematically formulated through the transfer entropy (Schreiber Reference Schreiber2000). Considering the vector
 $\boldsymbol{{\mathcal{V}}}(t)$
as defined in (2.2), the transfer entropy (or causality) from
 ${\mathcal{V}}_{j}$
to
 ${\mathcal{V}}_{i}$
is defined as (Schreiber Reference Schreiber2000; Duan et al.
Reference Duan, Yang, Chen and Shah2013)

where
 $T_{j\rightarrow i}$
is the causality from
 ${\mathcal{V}}_{j}$
to
 ${\mathcal{V}}_{i}$
,
 $\unicode[STIX]{x0394}t$
is the time lag to evaluate causality,
 $H({\mathcal{V}}_{i}|\boldsymbol{{\mathcal{V}}})$
is the conditional Shannon entropy (Shannon Reference Shannon1948) (i.e. the uncertainty in a variable
 ${\mathcal{V}}_{i}$
given
 $\boldsymbol{{\mathcal{V}}}$
) and
 is equivalent to
 $\boldsymbol{{\mathcal{V}}}$
but excluding the component
 $j$
. The conditional Shannon entropy of a variable
 ${\mathcal{V}}_{i}$
given
 $\boldsymbol{{\mathcal{V}}}$
is defined as
 $$\begin{eqnarray}H({\mathcal{V}}_{i}|\boldsymbol{{\mathcal{V}}})=E[\log (f({\mathcal{V}}_{i},\boldsymbol{{\mathcal{V}}}))]-E[\log (f(\boldsymbol{{\mathcal{V}}}))],\end{eqnarray}$$
where
 $f(\cdot )$
is the probability density function, and
 $E[\cdot ]$
signifies the expected value.
We are concerned with the cross-induced causalities
 $T_{j\rightarrow i}$
, with
 $j\neq i$
, hence,
 $T_{i\rightarrow i}$
are set to zero. Moreover, our goal is to evaluate the causal effect of
 $T_{j\rightarrow i}$
relative to the total causality from
 ${\mathcal{V}}_{j}$
to all the variables. Thus, we define the normalised causality as
 $$\begin{eqnarray}\tilde{T}_{j\rightarrow i}(\unicode[STIX]{x0394}t)=\frac{T_{j\rightarrow i}(\unicode[STIX]{x0394}t)-T_{j\rightarrow i}^{perm}(\unicode[STIX]{x0394}t)}{T_{j\rightarrow (1,\ldots ,6)}(\unicode[STIX]{x0394}t)-T_{j\rightarrow (1,\ldots ,6)}^{perm}},\end{eqnarray}$$
such that the value of
 $\tilde{T}_{j\rightarrow i}$
is bounded between 0 and 1. The term
 $T_{j\rightarrow i}^{perm}$
aims to remove spurious contributions due to statistical errors, and it is the transfer entropy computed from the variables
 ${\mathcal{V}}_{1},\cdots \,,{\mathcal{V}}_{j-1},{\mathcal{V}}_{j}^{perm},{\mathcal{V}}_{j+1},\ldots ,{\mathcal{V}}_{6}$
, where
 ${\mathcal{V}}_{j}^{perm}$
is
 ${\mathcal{V}}_{j}$
randomly permuted in time in order to preserve the one-point statistics of the signal while breaking time-delayed causal links. The calculation of (2.5) is numerical performed by estimating the probability density functions and their corresponding entropy using the binning method. More details about the computation of
 $T_{j\rightarrow i}$
are given in appendix A.
There is a growing recognition that information-theoretic metrics such as transfer entropy are fundamental physical quantities enabling causal inference from observational data (Prokopenko & Lizier Reference Prokopenko and Lizier2014; Spinney, Lizier & Prokopenko Reference Spinney, Lizier and Prokopenko2016). Moreover, causality measured by (2.5) is advantageous compared to classic time correlations employed in previous studies of wall turbulence (Jiménez Reference Jiménez2013). One desirable property is the asymmetry of the measurement, i.e. if a variable
 ${\mathcal{V}}_{i}$
is causal to
 ${\mathcal{V}}_{j}$
, it does not imply that
 ${\mathcal{V}}_{j}$
is causal to
 ${\mathcal{V}}_{i}$
. Another attractive feature of transfer entropy is that it is based on probability density functions and, hence, is invariant under shifting, rescaling and, in general, under nonlinear transformations of the signals (Kaiser & Schreiber Reference Kaiser and Schreiber2002). Additionally,
 $T_{j\rightarrow i}$
accounts for direct causality excluding intermediate variables: if
 ${\mathcal{V}}_{i}$
is only caused by
 ${\mathcal{V}}_{j}$
and
 ${\mathcal{V}}_{k}$
is only caused by
 ${\mathcal{V}}_{j}$
, there is no causality from
 ${\mathcal{V}}_{i}$
to
 ${\mathcal{V}}_{k}$
provided that the three components are contained in
 $\boldsymbol{{\mathcal{V}}}$
(Duan et al.
Reference Duan, Yang, Chen and Shah2013).
Finally, we close the section noting that the quest of identifying cause–effect relationships among events or variables remains an open challenge in scientific research. Formally, the transfer entropy in (2.3) determines the statistical direction of information transfer between time signals by measuring asymmetries in their interactions. We have adopted this metric as an indication of causality, but the definition of causation is subject to ongoing debate and controversy. Although transfer entropy entails a quantitative improvement with respect to other methodologies for causal inference, it is not flawless. Previous works have reported that transfer entropy obtained from poor time-resolved datasets or short time sequences are prone to yield biased estimates (Hahs & Pethel Reference Hahs and Pethel2011). More importantly, if some variables in the system are unavailable or neglected, or if the time lag in consideration does not account for the actual causal time lag of the signals, this could have profound consequences in the observed causality due to intermediate or confounding hidden variables. The reader is referred to Hlavackova-Schindler et al. (Reference Hlavackova-Schindler, Palus, Vejmelka and Bhattacharya2007) for an in-depth discussion on information theory in causal inference.
3 Results
3.1 Time scales for causal inference
Assessing causality in (2.5) requires the identification of a characteristic time lag,
 $\unicode[STIX]{x0394}t$
. In the present study, we seek
 $\unicode[STIX]{x0394}t$
for maximum causal inference,
 $\unicode[STIX]{x0394}t_{max}$
. The behaviour of
 $\tilde{T}_{j\rightarrow i}(\unicode[STIX]{x0394}t)$
can differ for each
 $(j,i)$
pair, but a sensible choice to estimate
 $\unicode[STIX]{x0394}t_{max}$
is obtained by defining a global measure based on the summation of all causalities for each
 $\unicode[STIX]{x0394}t$
, i.e.
 $\sum _{j,i}\tilde{T}_{j\rightarrow i}$
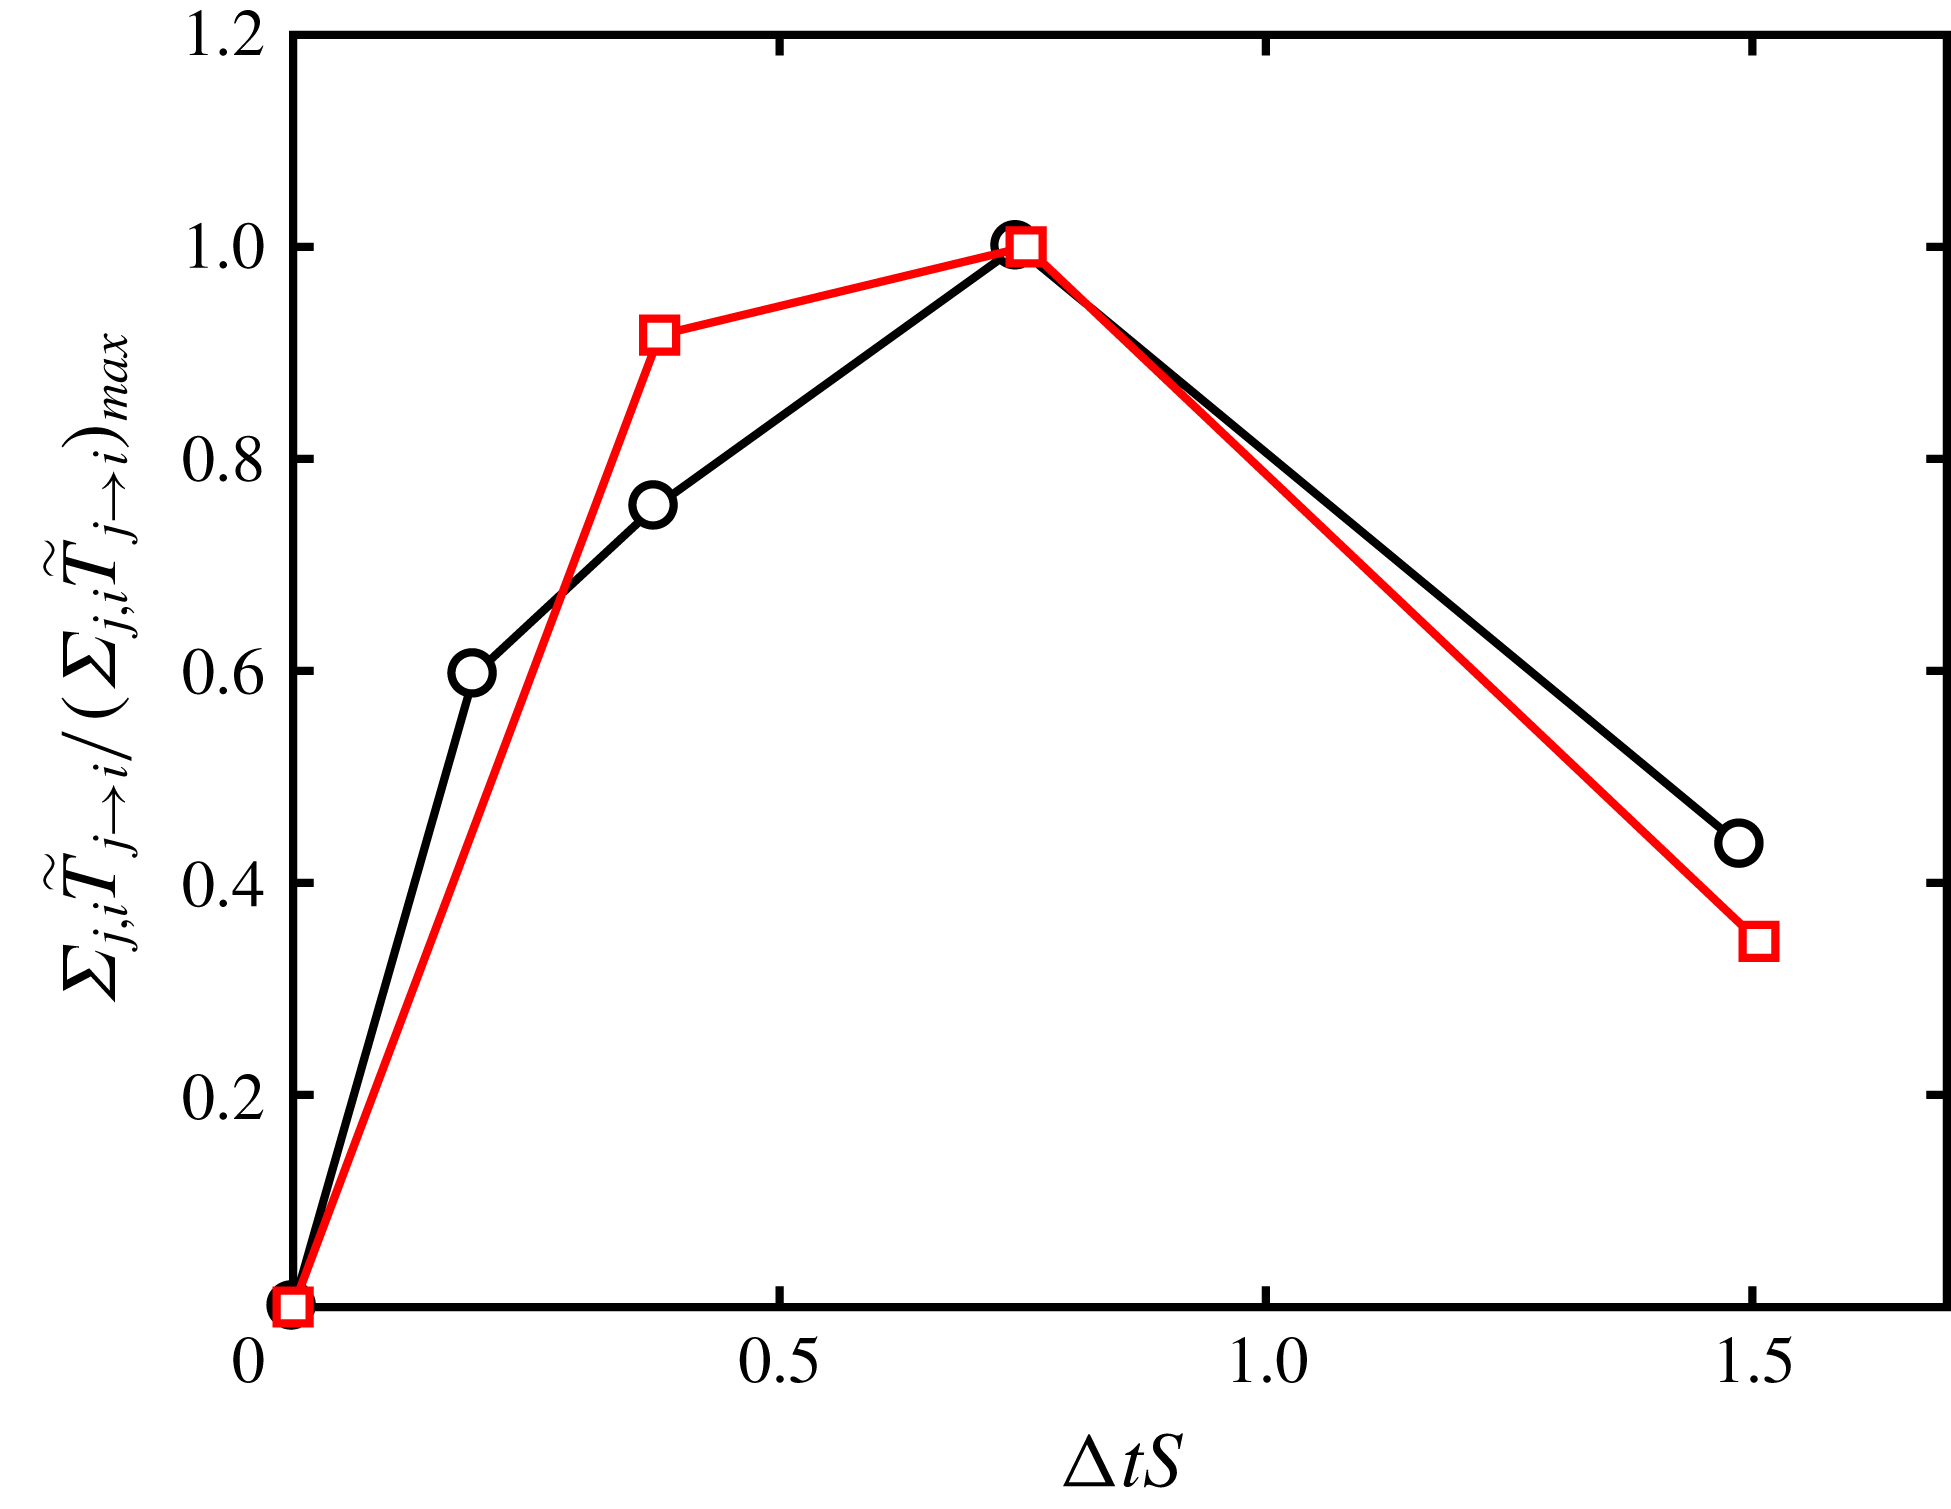
. The results are shown in figure 4, where
 $\unicode[STIX]{x0394}t$
is scaled by the average shear within the bands considered for each layer.
Summation of causalities
 $\sum _{j,i}\tilde{T}_{j\rightarrow i}$
as a function of the time horizon for causal influence,
 $\unicode[STIX]{x0394}t$
, for the buffer layer (black circles) and log layer (red squares);
 $\unicode[STIX]{x0394}t$
is scaled by the average shear of each layer, and causalities in the vertical axis are normalised by the maximum value among all
 $\unicode[STIX]{x0394}t$
.

Interestingly, causalities for both the buffer layer and log layer peak at
 $\unicode[STIX]{x0394}t_{max}\approx 0.8S^{-1}$
, which is the time lag selected for the remainder of the study. Note that from table 1, the ratio
 $S_{buffer}/S_{log}$
is roughly 10, and there is a non-trivial time-scale separation between both layers. The value of
 $\unicode[STIX]{x0394}t_{max}$
is comparable to the characteristic lifespan of coherence structures and the duration of bursting events in turbulent channel flows (Flores & Jiménez Reference Flores and Jiménez2010; Lozano-Durán & Jiménez Reference Lozano-Durán and Jiménez2014b
; Jiménez Reference Jiménez2018). Moreover, the collapse in figure 4 of the causal time horizon for both layers in shear times points at
 $S^{-1}$
as the physically relevant time scale controlling the energy-eddies (Mizuno & Jiménez Reference Mizuno and Jiménez2011; Lozano-Durán & Bae Reference Lozano-Durán and Bae2019). The result is also consistent with previous works on self-sustaining processes, which have shown that shear turbulence behaves quasi-periodically with time cycles proportional to
 $S^{-1}$
(Sekimoto, Dong & Jiménez Reference Sekimoto, Dong and Jiménez2016).
Causal maps for (a) buffer layer and (b) log layer. Grey-scale colours denote normalised causality magnitude. The variables
 $|\hat{u} _{n,m}|^{2}$
,
 $|\hat{v}_{n,m}|^{2}$
and
 $|{\hat{w}}_{n,m}|^{2}$
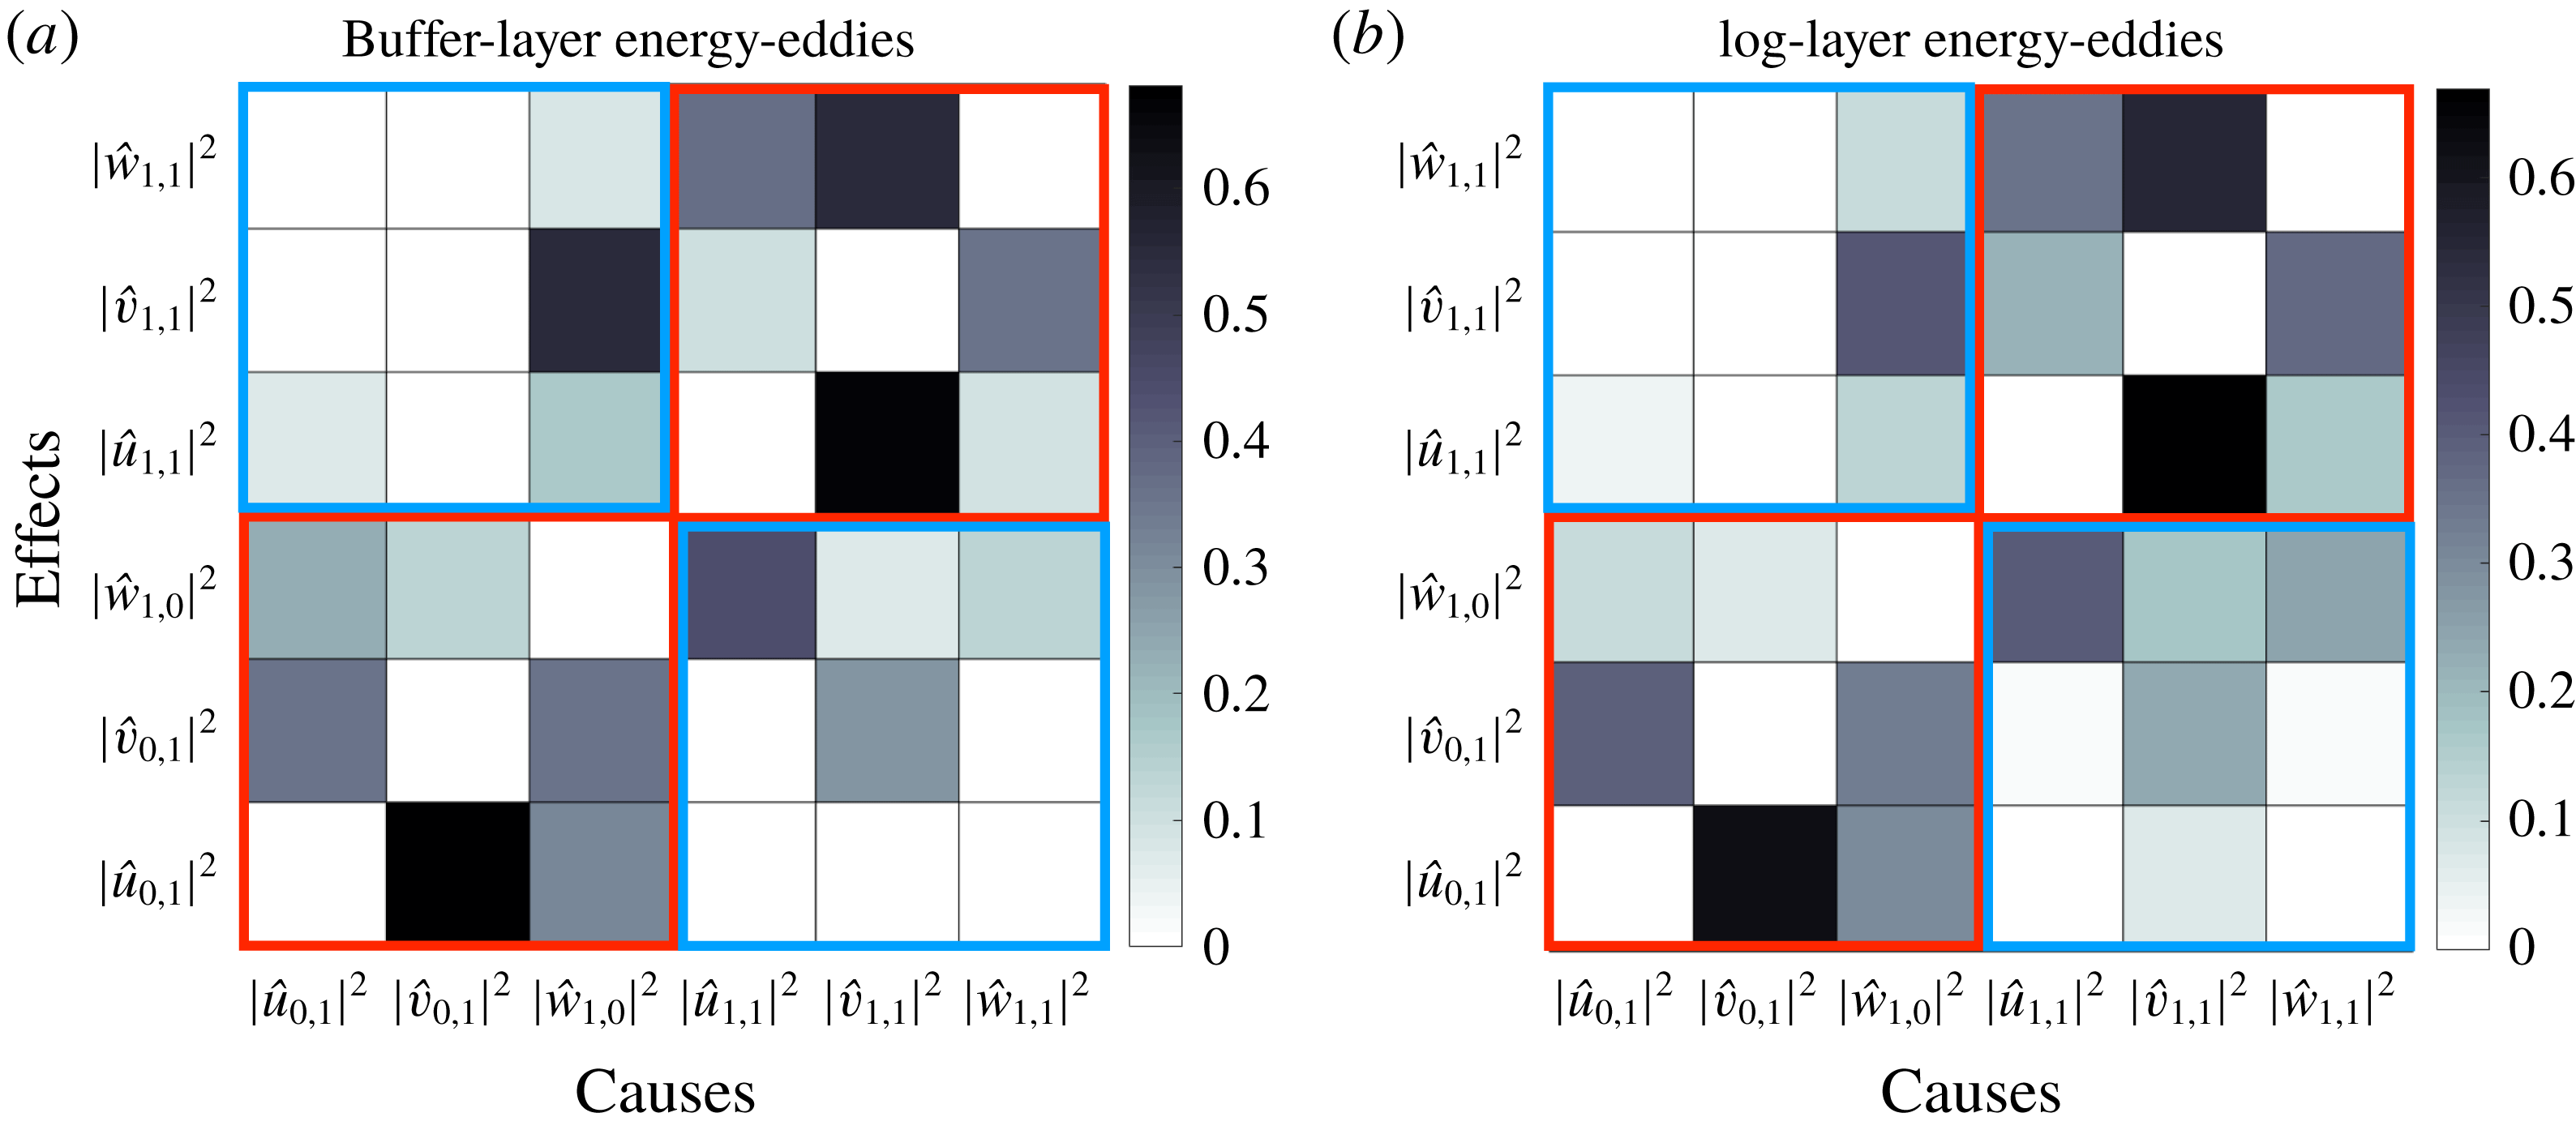
represent the magnitudes of the streamwise, wall-normal and spanwise velocity modes, respectively. Red and blue squares enclose intra-scale causalities and inter-scale causalities, respectively. The statistical convergence of the causal maps is assessed in appendix B.

3.2 Causal structure of wall-bounded energy-eddies
The key result of this work is shown in figure 5, which contains the causal relations
 $\tilde{T}_{j\rightarrow i}$
among the six flow components. Figure 5 is divided into two causal maps, one for each layer. The maps should be read as causative variables in the horizontal axis versus the corresponding effects in the vertical axis. The resemblance between the maps reveals that, despite the complex nonlinear dynamics and the sizeable length- and time-scale difference between buffer-layer and log-layer energy-eddies, there is a strikingly similar causal pattern shared among energy signals in both layers.
The causal maps in figure 5 also unify several well-known flow mechanisms in a single visual. If we separate the maps into two subsets, namely, intra-scale causalities (red squares in figure 5), and inter-scale causalities (black squares in figure 5), the strongest causalities occur among velocity signals at the same scale. The causal connections
 $|\hat{v}_{1,1}|^{2}\rightarrow |\hat{u} _{1,1}|^{2}$
and
 $|\hat{v}_{0,1}|^{2}\rightarrow |\hat{u} _{0,1}|^{2}$
are consistent with the wall-normal momentum transport by
 $v$
, which intensifies the streak amplitude through the Orr/lift-up mechanism (Orr Reference Orr1907; Landahl & Landahlt Reference Landahl and Landahlt1975). During this process, the causality
 $|\hat{v}_{1,1}|^{2}\rightarrow |{\hat{w}}_{1,1}|^{2}$
is anticipated by the formation of streamwise rolls enforced by the incompressibility of the flow. The most notable inter-scale causal links arise from
 $|\hat{u} _{1,1}|^{2}\rightarrow |{\hat{w}}_{1,0}|^{2}$
, and
 $|{\hat{w}}_{1,0}|^{2}\rightarrow |\hat{v}_{1,1}|^{2}$
. The former is reminiscent of the spanwise flow motions induced by the loss of stability of the streaks, while the latter is consistent with the subsequent meander and breakdown (Swearingen & Blackwelder Reference Swearingen and Blackwelder1987; Waleffe Reference Waleffe1995, Reference Waleffe1997; Kawahara et al.
Reference Kawahara, Jiménez, Uhlmann and Pinelli2003; Park et al.
Reference Park, Hwang and Cossu2011; Alizard Reference Alizard2015; Cassinelli et al.
Reference Cassinelli, de Giovanetti and Hwang2017). In contrast with previous studies, our results stem directly from the non-intrusive analysis of the fully nonlinear signals and do not rely on a particular linearisation of the equations of motion. Yet, linear theories and causal analysis do not oppose to each other and they should be perceived as complementary approaches; the former as a reduced system to investigate different flow mechanisms, and the latter as a mean to assess whether those processes are consistent with the time evolution of the actual nonlinear flow.
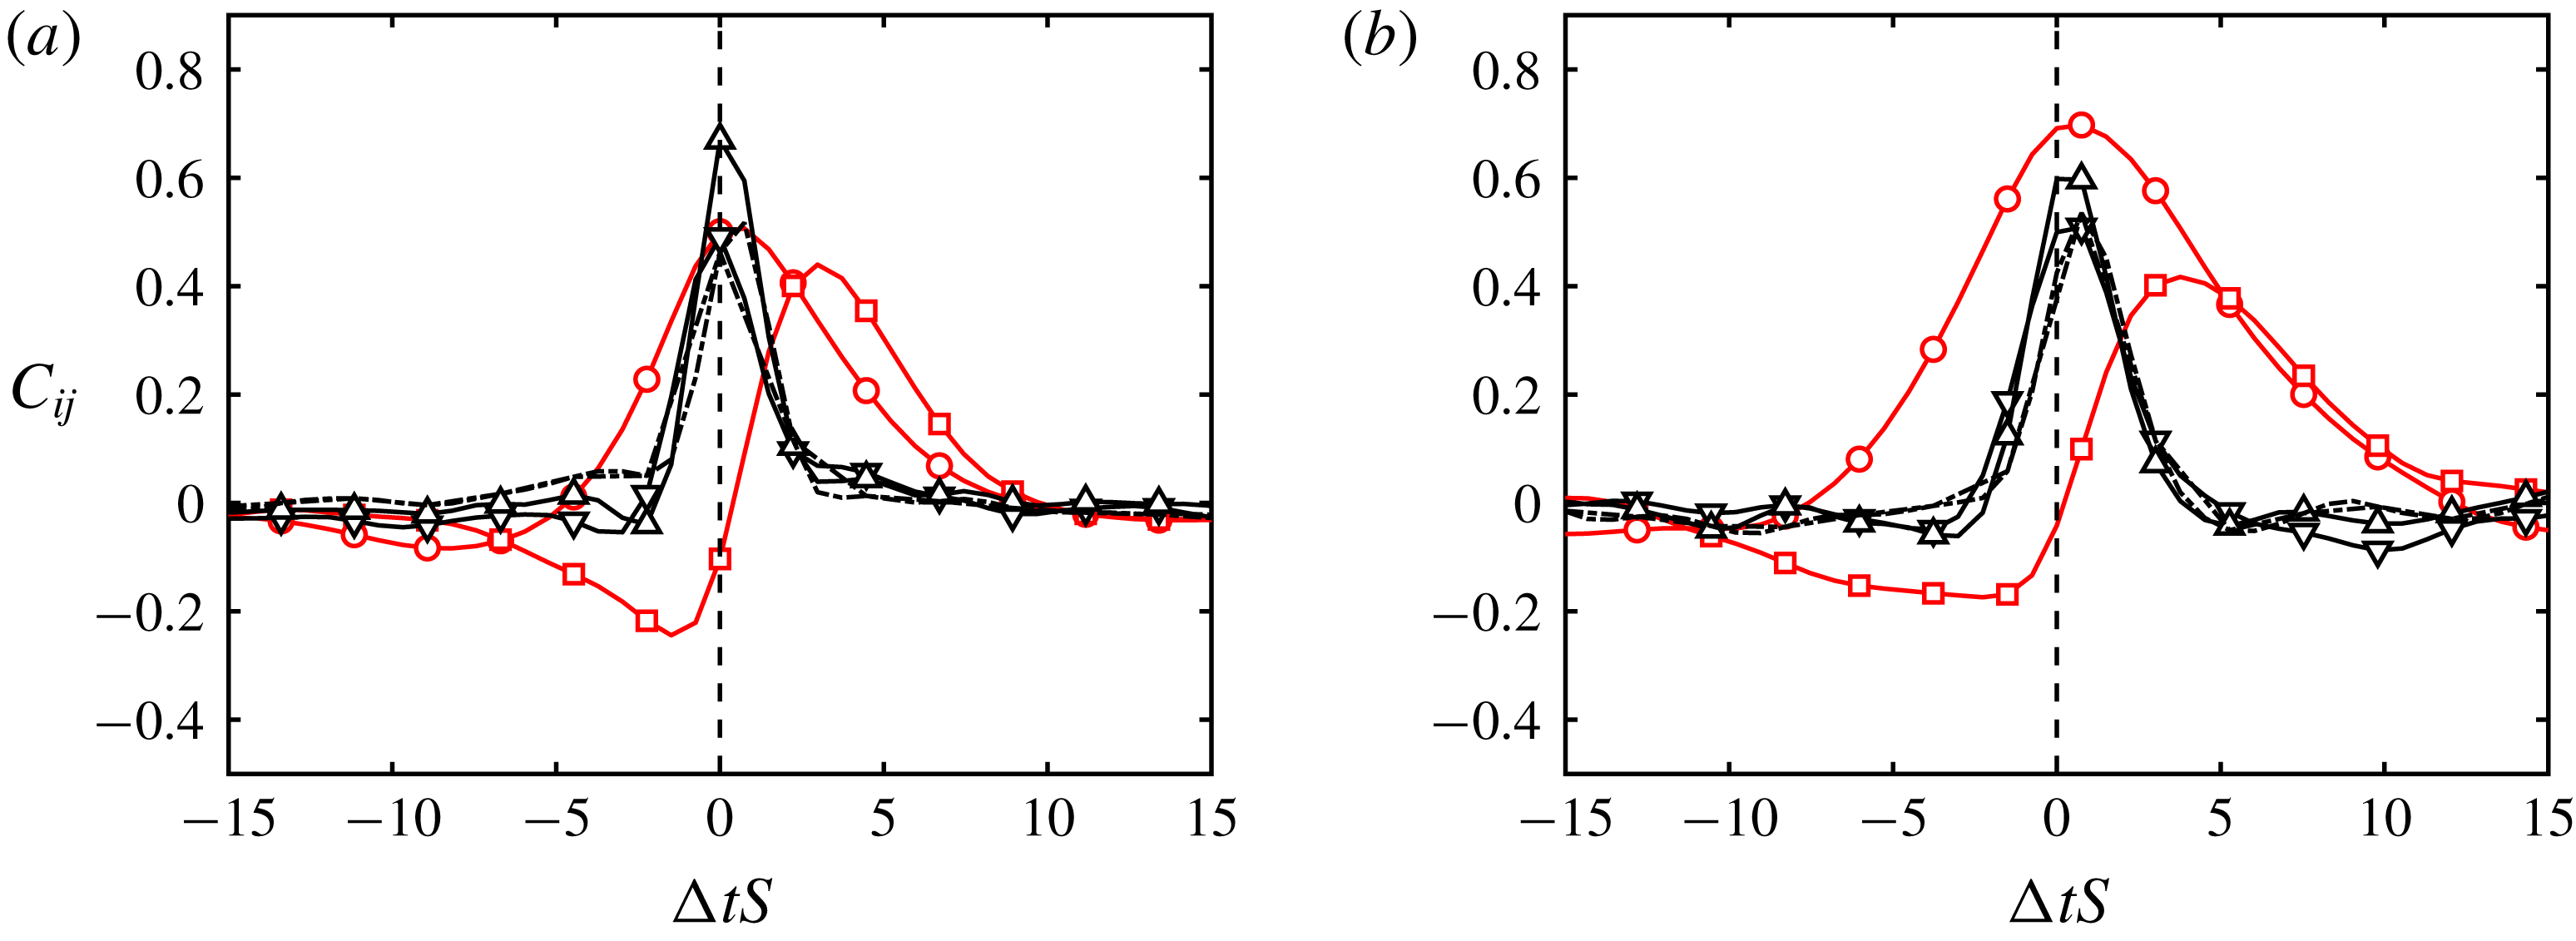
Temporal cross-correlation of
 $|\hat{u} _{0,1}|^{2}\rightarrow |\hat{v}_{0,1}|^{2}$
, ○;
 $|\hat{u} _{0,1}|^{2}\rightarrow |{\hat{w}}_{1,0}|^{2}$
, ▫;
 $|\hat{u} _{1,1}|^{2}\rightarrow |\hat{v}_{1,1}|^{2}$
, ▿;
 $|\hat{u} _{1,1}|^{2}\rightarrow |{\hat{w}}_{1,1}|^{2}$
, ▵;
 $|\hat{v}_{1,1}|^{2}\rightarrow |{\hat{w}}_{1,1}|^{2}$
, - - - -. The vertical dashed line is
 $\unicode[STIX]{x0394}t=0S^{-1}$
. (a) Buffer layer; (b) log layer. The notation used is such that
 $C_{ij}$
represents
 ${\mathcal{V}}_{i}\rightarrow {\mathcal{V}}_{j}$
. Lines in black are used for weakly skewed
 $C_{ij}$
. Time is scaled with the shear averaged over the respective bands.

For completeness, we also discuss the time cross-correlation between fluctuating signals
 ${\mathcal{V}}_{i}^{\prime }={\mathcal{V}}_{i}-\langle {\mathcal{V}}_{i}\rangle _{t}$
calculated as
 $$\begin{eqnarray}C_{ij}(\unicode[STIX]{x0394}t)=\frac{\langle {\mathcal{V}}_{i}^{\prime }(t){\mathcal{V}}_{j}^{\prime }(t+\unicode[STIX]{x0394}t)\rangle _{t}}{\langle {\mathcal{V}}_{i}^{\prime 2}(t)\rangle _{t}^{1/2}\langle {\mathcal{V}}_{j}^{\prime 2}(t)\rangle _{t}^{1/2}},\end{eqnarray}$$
where the average
 $\langle \cdot \rangle _{t}$
is taken over the whole time history. The results are displayed in figure 6, which includes correlations whose maxima are above 0.4. Both the buffer and log layers exhibit similar trends in the correlations, consistent with the self-similar causality shown above. Here, we wish to make qualitative comparisons of
 $C_{ij}$
with the maps in figure 5, and the reader is referred to Jiménez (Reference Jiménez2013) for a further discussion on time correlations in minimal channel flows.
An immediate consequence of causality is the emergence of some degree of correlation between variables, although the converse is not necessarily true. Despite this footprint of causality onto the correlations, fair comparisons of
 $C_{ij}$
and
 $T_{i\rightarrow j}$
are hindered by the intrinsic differences of each methodology. As discussed in § 2.3, the temporal symmetry of the correlations,
 $C_{ij}(\unicode[STIX]{x0394}t)=C_{ji}(-\unicode[STIX]{x0394}t)$
, does not enable the unidirectional assessment of interactions between variables. To overcome this limitation and only for the sake of qualitative comparisons, we assume that the amount of ‘causality’ from
 ${\mathcal{V}}_{i}$
to
 ${\mathcal{V}}_{j}$
can be inferred from the skewness of
 $C_{ij}$
towards later times. Adopting this convention, the prevailing directionalities in the correlations are identified as
 $|\hat{u} _{i,j}|^{2}\rightarrow (|\hat{v}_{i,j}|^{2},|{\hat{w}}_{j,i}|^{2})$
and
 $|\hat{v}_{1,1}|^{2}\rightarrow |{\hat{w}}_{1,1}|^{2}$
, which are also recognised in the causal maps in figure 5. The picture provided above is that the correlations are mostly dominated by strong events associated with the redistribution of energy from the streamwise velocity component to the cross-flow (Mansour, Kim & Moin Reference Mansour, Kim and Moin1988). However,
 $C_{ij}$
fails to account for key mechanisms required for sustaining wall turbulence, such as the lift-up/Orr effect (Kim & Lim Reference Kim and Lim2000), which is vividly captured by the causal maps. Regarding the time scales, the peaks of the time correlations are attained within the range
 $\unicode[STIX]{x0394}t\approx 0S^{-1}$
to
 $\unicode[STIX]{x0394}t\approx 3S^{-1}$
. The range encloses the averaged time horizon for maximum causal inference
 $\unicode[STIX]{x0394}t_{max}\approx S^{-1}$
(§ 3.1), and both approaches appear as valid to extract the representative time scales of the flow. Overall, the inference of causality based on the skewness of
 $C_{ij}$
is obscured by the often mild asymmetries in
 $C_{ij}$
and the bias towards strong events, whereas the causal maps in figure 5 convey a richer vision of the flow mechanisms easing the limitations of
 $C_{ij}$
.
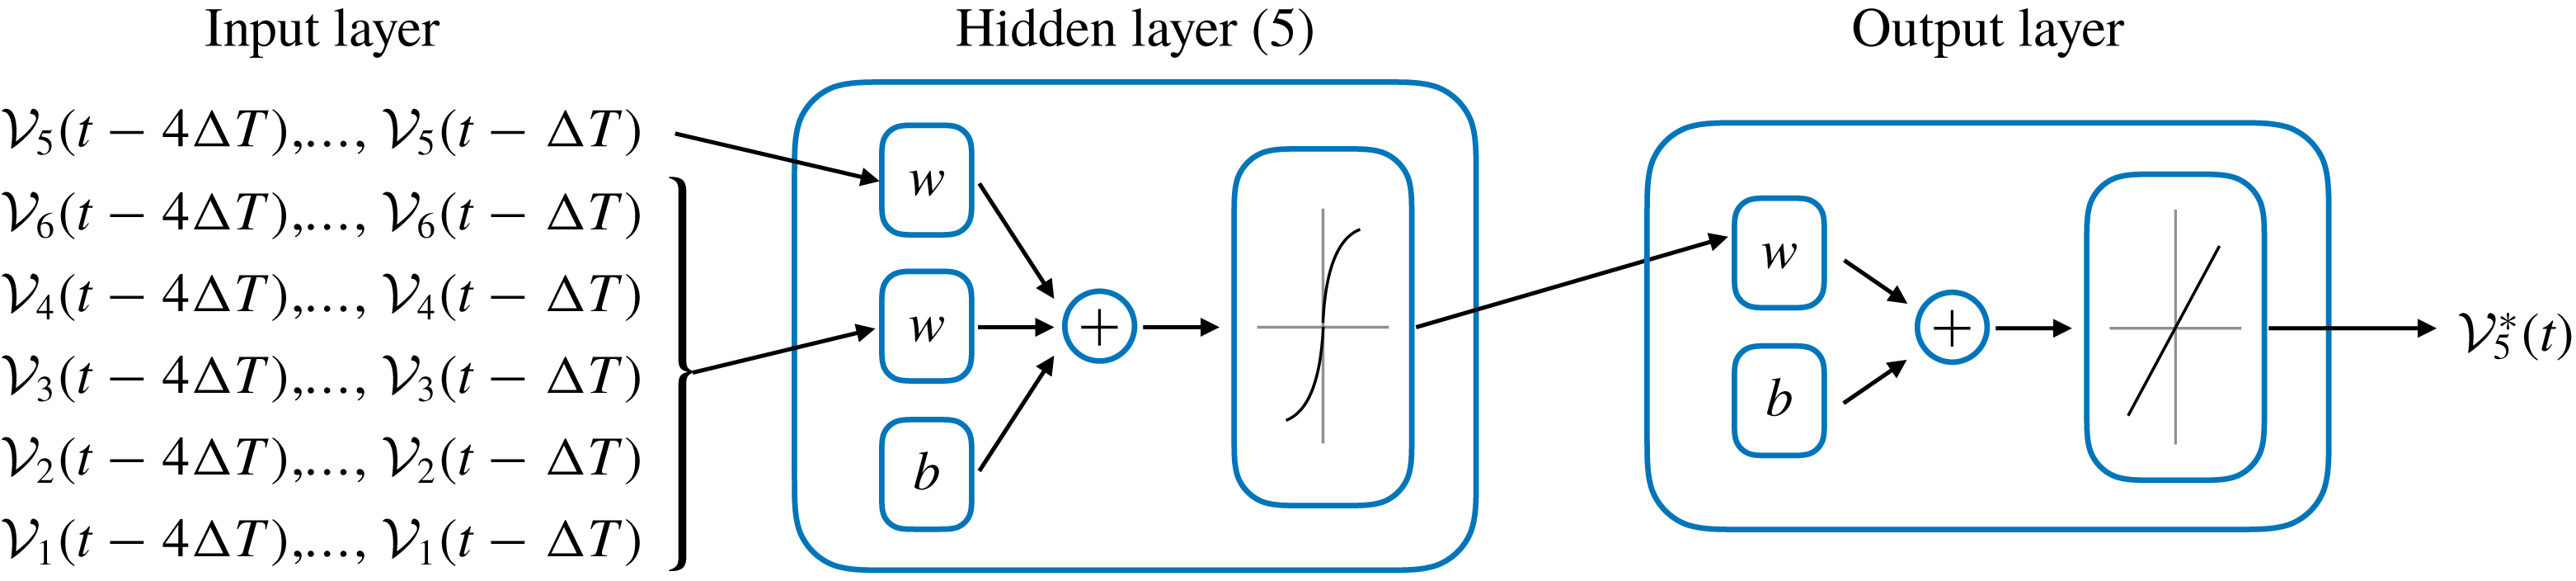
Schematics of the nonlinear autoregressive exogenous neural network. The input layer comprises the variables
 $\boldsymbol{{\mathcal{V}}}$
at past the times
 $t-\unicode[STIX]{x0394}T$
,
 $t-2\unicode[STIX]{x0394}T$
,
 $t-3\unicode[STIX]{x0394}T$
and
 $t-4\unicode[STIX]{x0394}T$
. The five hidden layers consist of weights (
 $\boldsymbol{w}$
) and bias (
 $b$
). The output layer returns an estimation at time
 $t$
of the variable of interest
 ${\mathcal{V}}_{5}^{\ast }=|\hat{v}_{1,1}^{\ast }|^{2}$
.

3.3 Application to flow modelling: burst prediction in the log layer
The observation of similar causality of energy-eddies at different scales in wall turbulence has striking implications for control and modelling. Our goal in this section is to provide a simple demonstration of how new models can be conceived for the computationally affordable smaller eddies in the buffer layer, to later model eddies at larger scales. This is shown by constructing a model to predict
 $|\hat{v}_{1,1}|^{2}$
in the log layer using information from buffer-layer simulations. Other quantities in
 $\boldsymbol{{\mathcal{V}}}$
are equally amenable to modelling, and the choice of
 $|\hat{v}_{1,1}|^{2}$
constitutes just one possibility. The selection of
 $|\hat{v}_{1,1}|^{2}$
can be motivated as a marker of the bursting phenomena observed in intense wind gusts relevant for buildings and aircraft structural loads (Fujita Reference Fujita1981).
We model
 ${\mathcal{V}}_{5}=|\hat{v}_{1,1}|^{2}$
at time
 $t$
using a nonlinear autoregressive exogenous neural network (NN) (McCulloch & Pitts Reference McCulloch and Pitts1943). The modelling approach is justified by the suitability of NN for time-signal forecasting in nonlinear systems, but the remainder of the section could have been formulated using traditional linear models without altering our conclusions. Our NN model relates the current value of a time series (
 ${\mathcal{V}}_{5}$
) to both past values of the same series and current and past values of the driving (exogenous) series (
 ${\mathcal{V}}_{i},~i=1,\ldots ,6,~i\neq 5$
). Figure 7 shows an schematic of the NN set-up. The input of the network is the known past states of the log-layer signals
 $\boldsymbol{{\mathcal{V}}}$
at times
 $t-\unicode[STIX]{x0394}t,\ldots ,t-4\unicode[STIX]{x0394}t$
, with
 $\unicode[STIX]{x0394}t=0.8S^{-1}$
. In present model,
 ${\mathcal{V}}_{5}=|\hat{v}_{1,1}|^{2}$
at time
 $t$
is estimated as
 $$\begin{eqnarray}{\mathcal{V}}_{5}^{\ast }(t)=F(\boldsymbol{{\mathcal{V}}}(t-\unicode[STIX]{x0394}T),\boldsymbol{{\mathcal{V}}}(t-2\unicode[STIX]{x0394}T),\boldsymbol{{\mathcal{V}}}(t-3\unicode[STIX]{x0394}T),\boldsymbol{{\mathcal{V}}}(t-4\unicode[STIX]{x0394}T))+\unicode[STIX]{x1D716}(t),\end{eqnarray}$$
where the function
 $F$
is a five-layer recursive neural network as detailed in figure 7,
 ${\mathcal{V}}_{5}^{\ast }(t)$
is a prediction of
 ${\mathcal{V}}_{5}(t)$
,
 $\unicode[STIX]{x0394}T$
is the time lag and
 $\unicode[STIX]{x1D716}$
is the model error. The activation function selected for the hidden layers is the hyperbolic tangent sigmoid transfer function. The NN is trained using Bayesian regularisation backpropagation with five hidden layers. The training data are divided randomly into two groups, the training (80 %) and validation (20 %) sets. The training is terminated when the damping factor of the Levenberg–Marquardt algorithm exceeds
 $10^{10}$
. Additional details about the NN can be found in Lin et al. (Reference Lin, Horne, Tino and Giles1996) and Gao & Er (Reference Gao and Er2005).
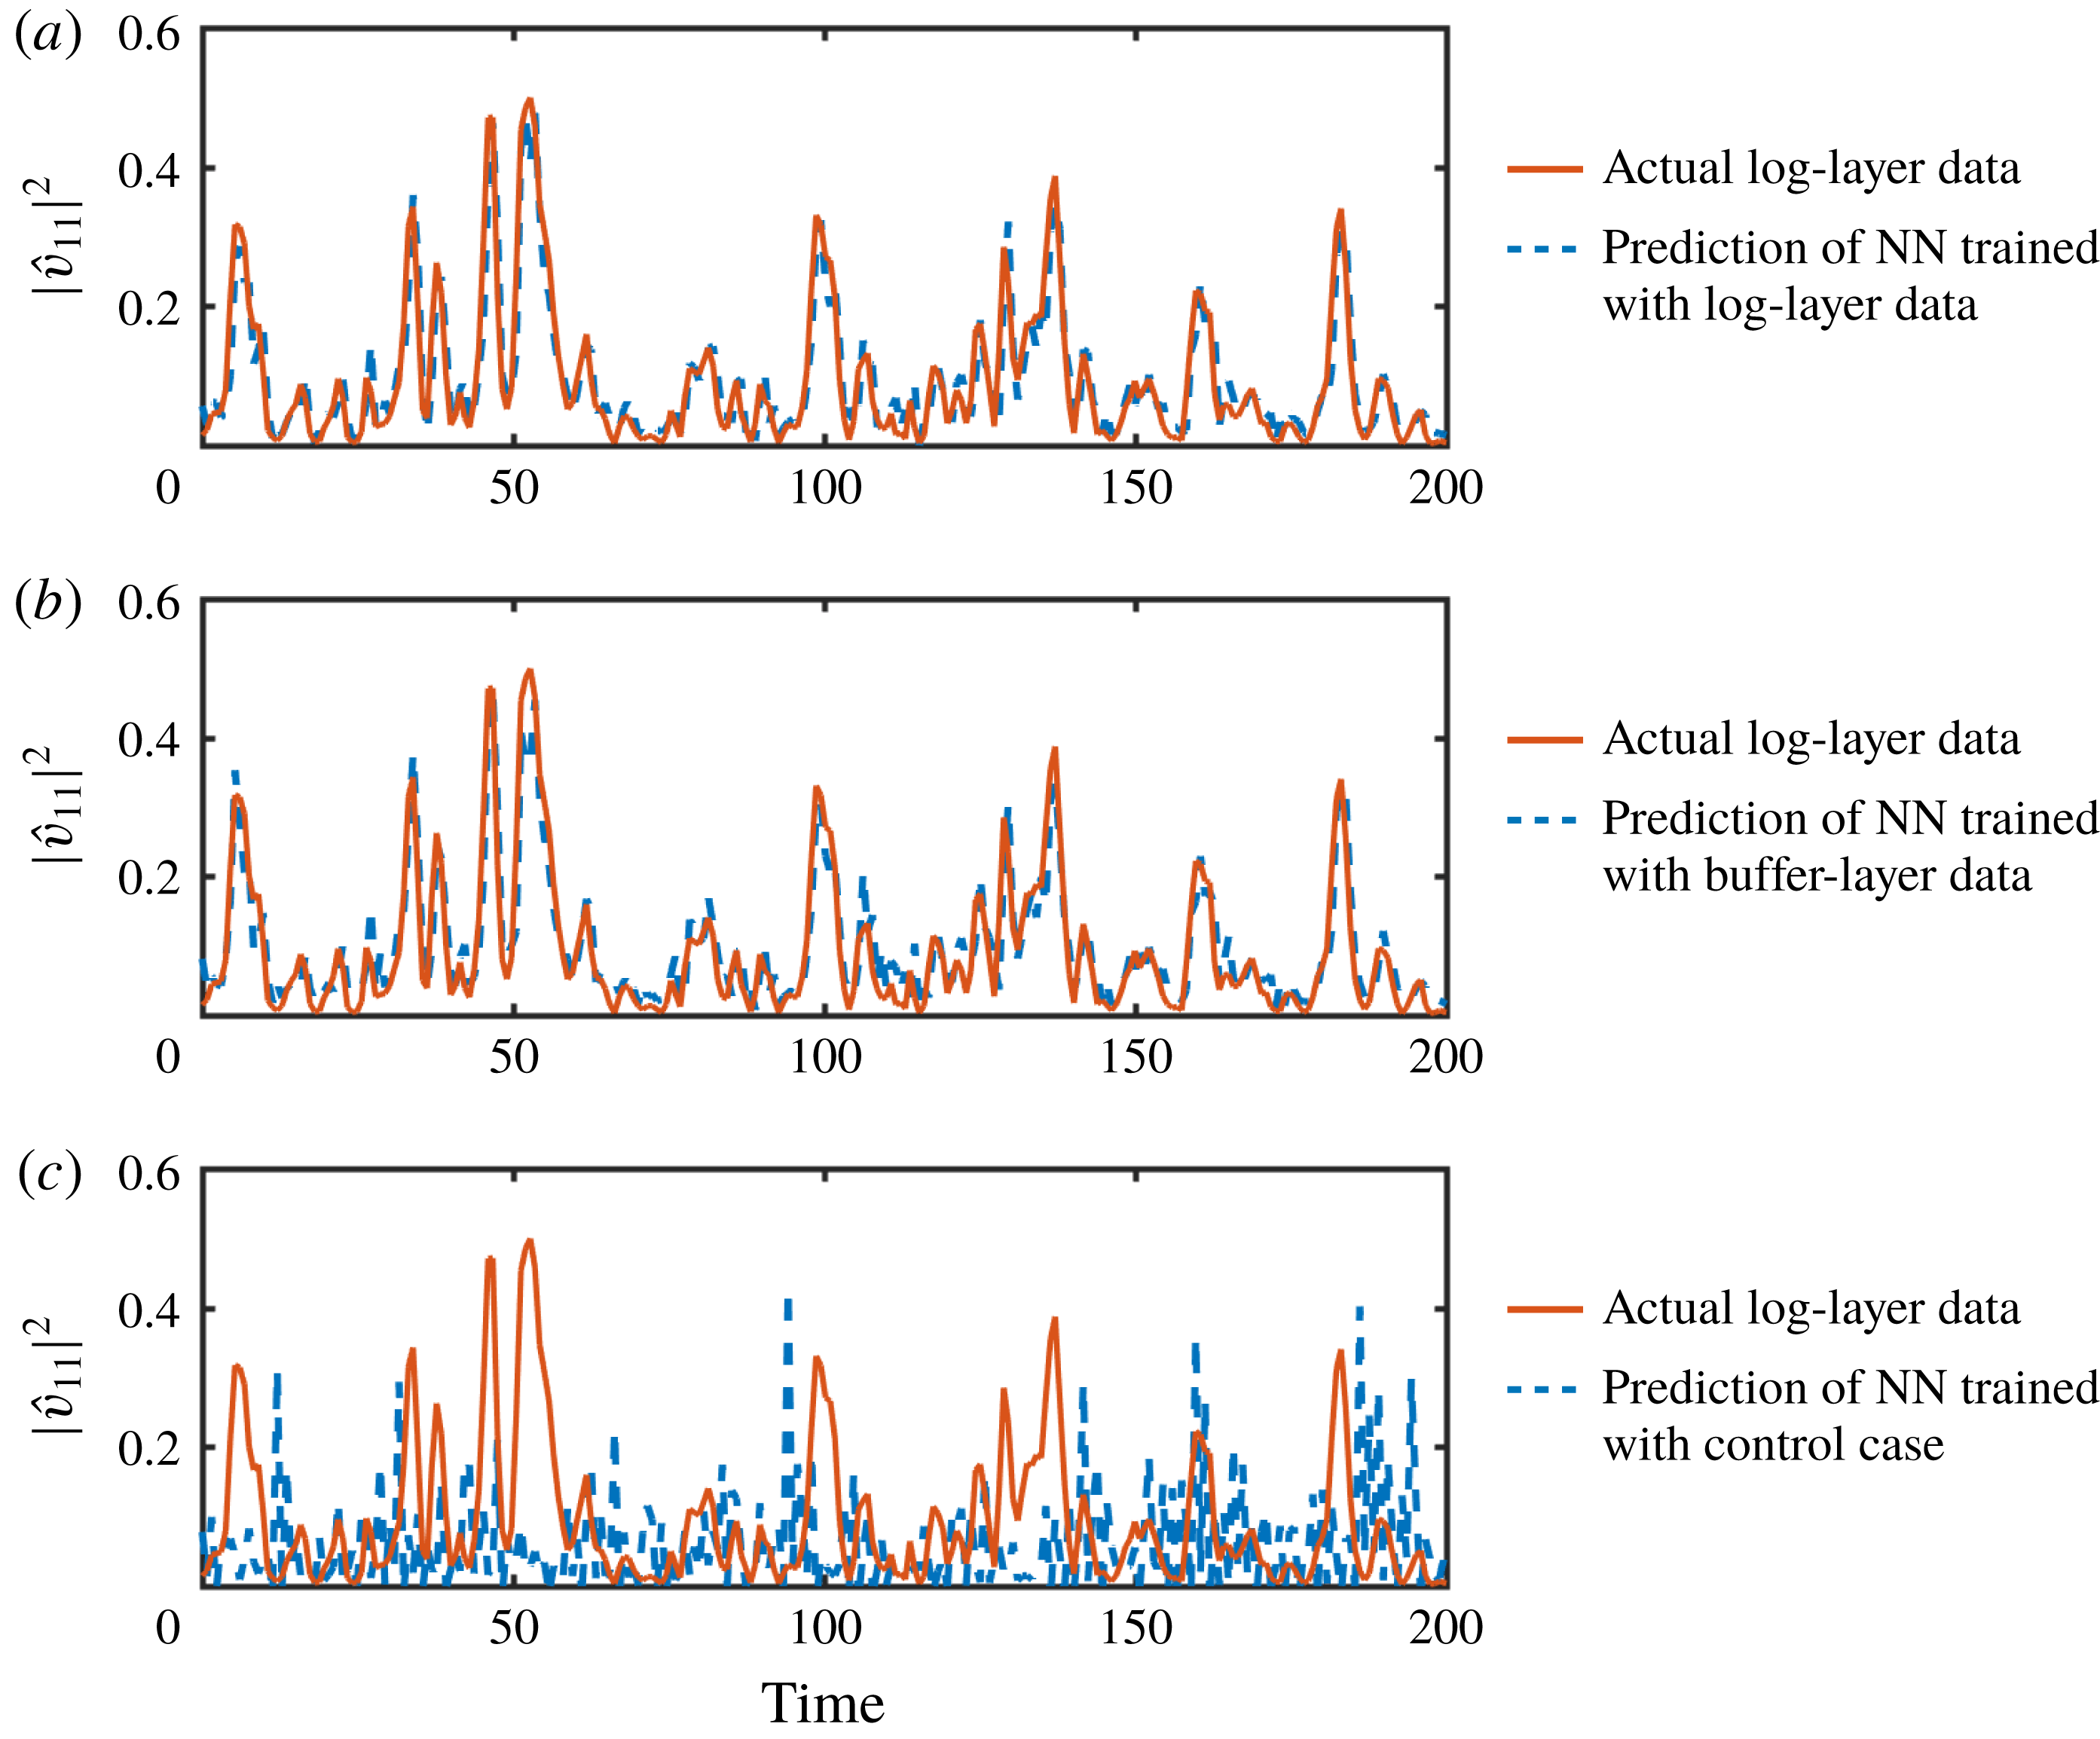
Burst prediction,
 $|\hat{v}_{1,1}|^{2}$
, in the log layer by a neural network trained with (a) log-layer data, (b) buffer-layer data and (c) buffer-layer data with signals randomly permuted in time. Solid red lines are actual data to be predicted, and dashed blue lines are one-step predictions by the neural network with step size equal to
 $\unicode[STIX]{x0394}t=0.8S^{-1}$
starting from the known solution. Time is normalised with the average shear within the band considered for extracting the time signals in the buffer or log layer, respectively. The velocities are normalised in
 $+$
units.

Three datasets are considered to train the NN prior to performing the predictions shown in figure 8:
(i) In the first case, the NN is trained using signals from the log layer that are independent of the dataset we aim to predict. Next, the NN is used to make one-step predictions of unseen log-layer data as shown in figure 8(a). Under these conditions, the NN model provides satisfactory predictions of
 $|\hat{v}_{1,1}|^{2}$
in the log layer. Given that the NN was trained using log-layer data, the high performance demonstrated in figure 8(a) is unsurprising.
(ii) In the second case, the NN is trained exclusively with signals from the buffer layer and then used to predict
$|\hat{v}_{1,1}|^{2}$
in the log layer. The accuracy of the forecast (figure 8
b) is comparable to the first case, consistent with the causal similarity argued in § 3.2. The outcome is remarkable, as the buffer-layer training set is thousands of times computationally more economical than the log-layer set used in (i). The result illustrates how the causal resemblance between the energy-eddies in the buffer and log layers can be advantageous for flow modelling.(iii) The third training set is a control case, in which the NN is fed with signals from the buffer layer randomly permuted in time in order to destroy time-delayed causal links between the signals while maintaining their non-temporal properties. Unsurprisingly, the third case yields completely erroneous predictions of the bursts (figure 8 c). Other control cases can be defined by training the NN with time-reversed signals or signals randomly shifted in time for long periods. In both cases, the performance of the NN degrades, yielding inferior predictions with respect to (i) and (ii).


The primary goal of this section has been to furnish some advantages of causal inference for flow modelling using a simple example. The interdependence between model performance and transfer entropy is not coincidental, and both are bonded by the fact that transfer entropy can be formally expressed in terms of relative errors in autoregressive models when the variables are Gaussian distributed (Barnett, Barrett & Seth Reference Barnett, Barrett and Seth2009). Therefore, even if the correlation between predictee and predictor variables, rather than causality, is the main requirement to strengthen the predictive capabilities of models, the understanding of the causal structure of the system can still inform the model design. Furthermore, the knowledge of the system causal network could be even more beneficial for the development of control strategies, in which the flow must be modified according to a set of prescribed rules. In those cases, actual causation between variables might be preferred to attain an effective control.
4 Conclusions and further discussion
Despite the extensive data provided by simulations of turbulent flows, the causality of coherent flow motions has often been overlooked in turbulence research. In the present work, we have investigated the causal interactions of energy-eddies of different size in wall-bounded turbulence using a novel, non-intrusive technique from information theory that does not rely on direct modification of the equations of motion (see Movie 1).
Our interest is on quantifying the similarities in the dynamics of the energy-eddies in the buffer layer and log layer. To that end, we have performed two time-resolved DNS of minimal turbulent channels, one for each layer. These simple set-ups allow us to isolate the energy-eddies in the buffer and log layers, respectively, without the complications of tracking the flow motions in space, scale and time. We have characterised the energy-eddies in terms of the time signals obtained from the most energetic spatial Fourier coefficients of the velocity. Within a given layer, the causality among energy-eddies is quantified from an information-theoretic perspective by measuring how the knowledge of the past states of eddies reduces the uncertainty of their future states, i.e. by the asymmetric transfer of information between signals. Our analysis establishes that the causal interactions of energy-eddies in the buffer and log layers are similar and essentially independent of the eddy size. In virtue of this similarity, we have further shown that the bursting events in the log layer can be predicted using a model trained exclusively with information from the buffer layer, which is accompanied by significant computational savings. This modest but revealing example illustrates how the self-similar causality between the energy-eddies of various sizes can aid the development of new strategies for turbulence control and modelling.
The causal analysis of time signals presented here emerges as an uncharted approach for turbulence research, and future opportunities include the causal investigation of eddies of distinct nature (temperature, density,…), and the study of key processes in turbulent flows, such as the cascade of energy from large to smaller scales (Cerbus & Goldburg Reference Cerbus and Goldburg2013; Cardesa, Vela-Martín & Jiménez Reference Cardesa, Vela-Martín and Jiménez2017), transition from laminar to turbulent flow (Hof et al. Reference Hof, de Lozar, Avila, Tu and Schneider2010; Wu et al. Reference Wu, Moin, Wallace, Skarda, Lozano-Durán and Hickey2017; Kühnen et al. Reference Kühnen, Song, Scarselli, Budanur, Riedl, Willis, Avila and Hof2018) or the interaction of near-wall turbulence with large-scale motions in the outer boundary layer region (Marusic et al. Reference Marusic, Mathis and Hutchins2010), to name a few.
We conclude this work by discussing some limitations of the approach. First, our conclusions refer to the dynamics of a few Fourier modes in minimal channels, chosen as simplified representations of the energy-containing eddies. The results remain to be confirmed in simulations with larger domains in which unconstrained energy-eddies are localised in space, scale and time. In that case, the Fourier analysis employed here to extract time signals might be unsuited. The extension of the methodology to arbitrary flow configurations comprises the identification and time tracking of energy-eddies at different scales, which poses a non-trivial task. More importantly, the answer to the question of what is the most natural characterisation of energy-eddies to provide a comprehensive view of the flow dynamics, if any, is itself unclear. Finally, the notion of causality adopted here has its origins in the statistical Shannon entropy and, as such, should be interpreted as a probabilistic measure of causality rather than as the quantification of causality of individual events. Although the two descriptions are intimately related, instantiated causality is only unambiguously identified by intrusively perturbing the system and observing the consequences (Pearl Reference Pearl2009). The latter definition coincides with our intuition of causality, and it might be preferred for control and prediction of isolated events. This alternative, but complementary, viewpoint of causality is already the focus of ongoing investigations and will be discussed in future studies.
Acknowledgements
A.L.-D. and H.J.B. acknowledge the support of NASA Transformative Aeronautics Concepts Program (grant no. NNX15AU93A) and the Office of Naval Research (grant no. N00014-16-S-BA10). This work was also supported by the Coturb project of the European Research Council (ERC-2014.AdG-669505) during the 2017 Coturb Turbulence Summer Workshop at the UPM. We thank Dr N. C. Constantinou, Dr J. I. Cardesa, Dr G. Tissot and Professor J. Jiménez, Professor P. J. Ioannou and Professor X. S. Liang for their helpful comments on earlier versions of the work.
Supplementary movies
Supplementary movies are available at https://doi.org/10.1017/jfm.2019.801.
Appendix A. Numerical computation of transfer entropy
Various techniques have been developed to efficiently estimate transfer entropy (Gencaga, Knuth & Rossow Reference Gencaga, Knuth and Rossow2015). Most approaches rely on decomposing the transfer entropy into a sum of mutual information components, which are the actual quantities to estimate. Here, we follow a direct method to compute probability densities by discretising the continuous valued signals in bins. The binning is performed by adaptive partitioning (Darbellay & Vajda Reference Darbellay and Vajda1999) with the number of bins in each spatial dimension equal to ten according to the rule by Paluš (Reference Paluš1995). It was tested that doubling the number of bins did not altered the conclusions presented above.
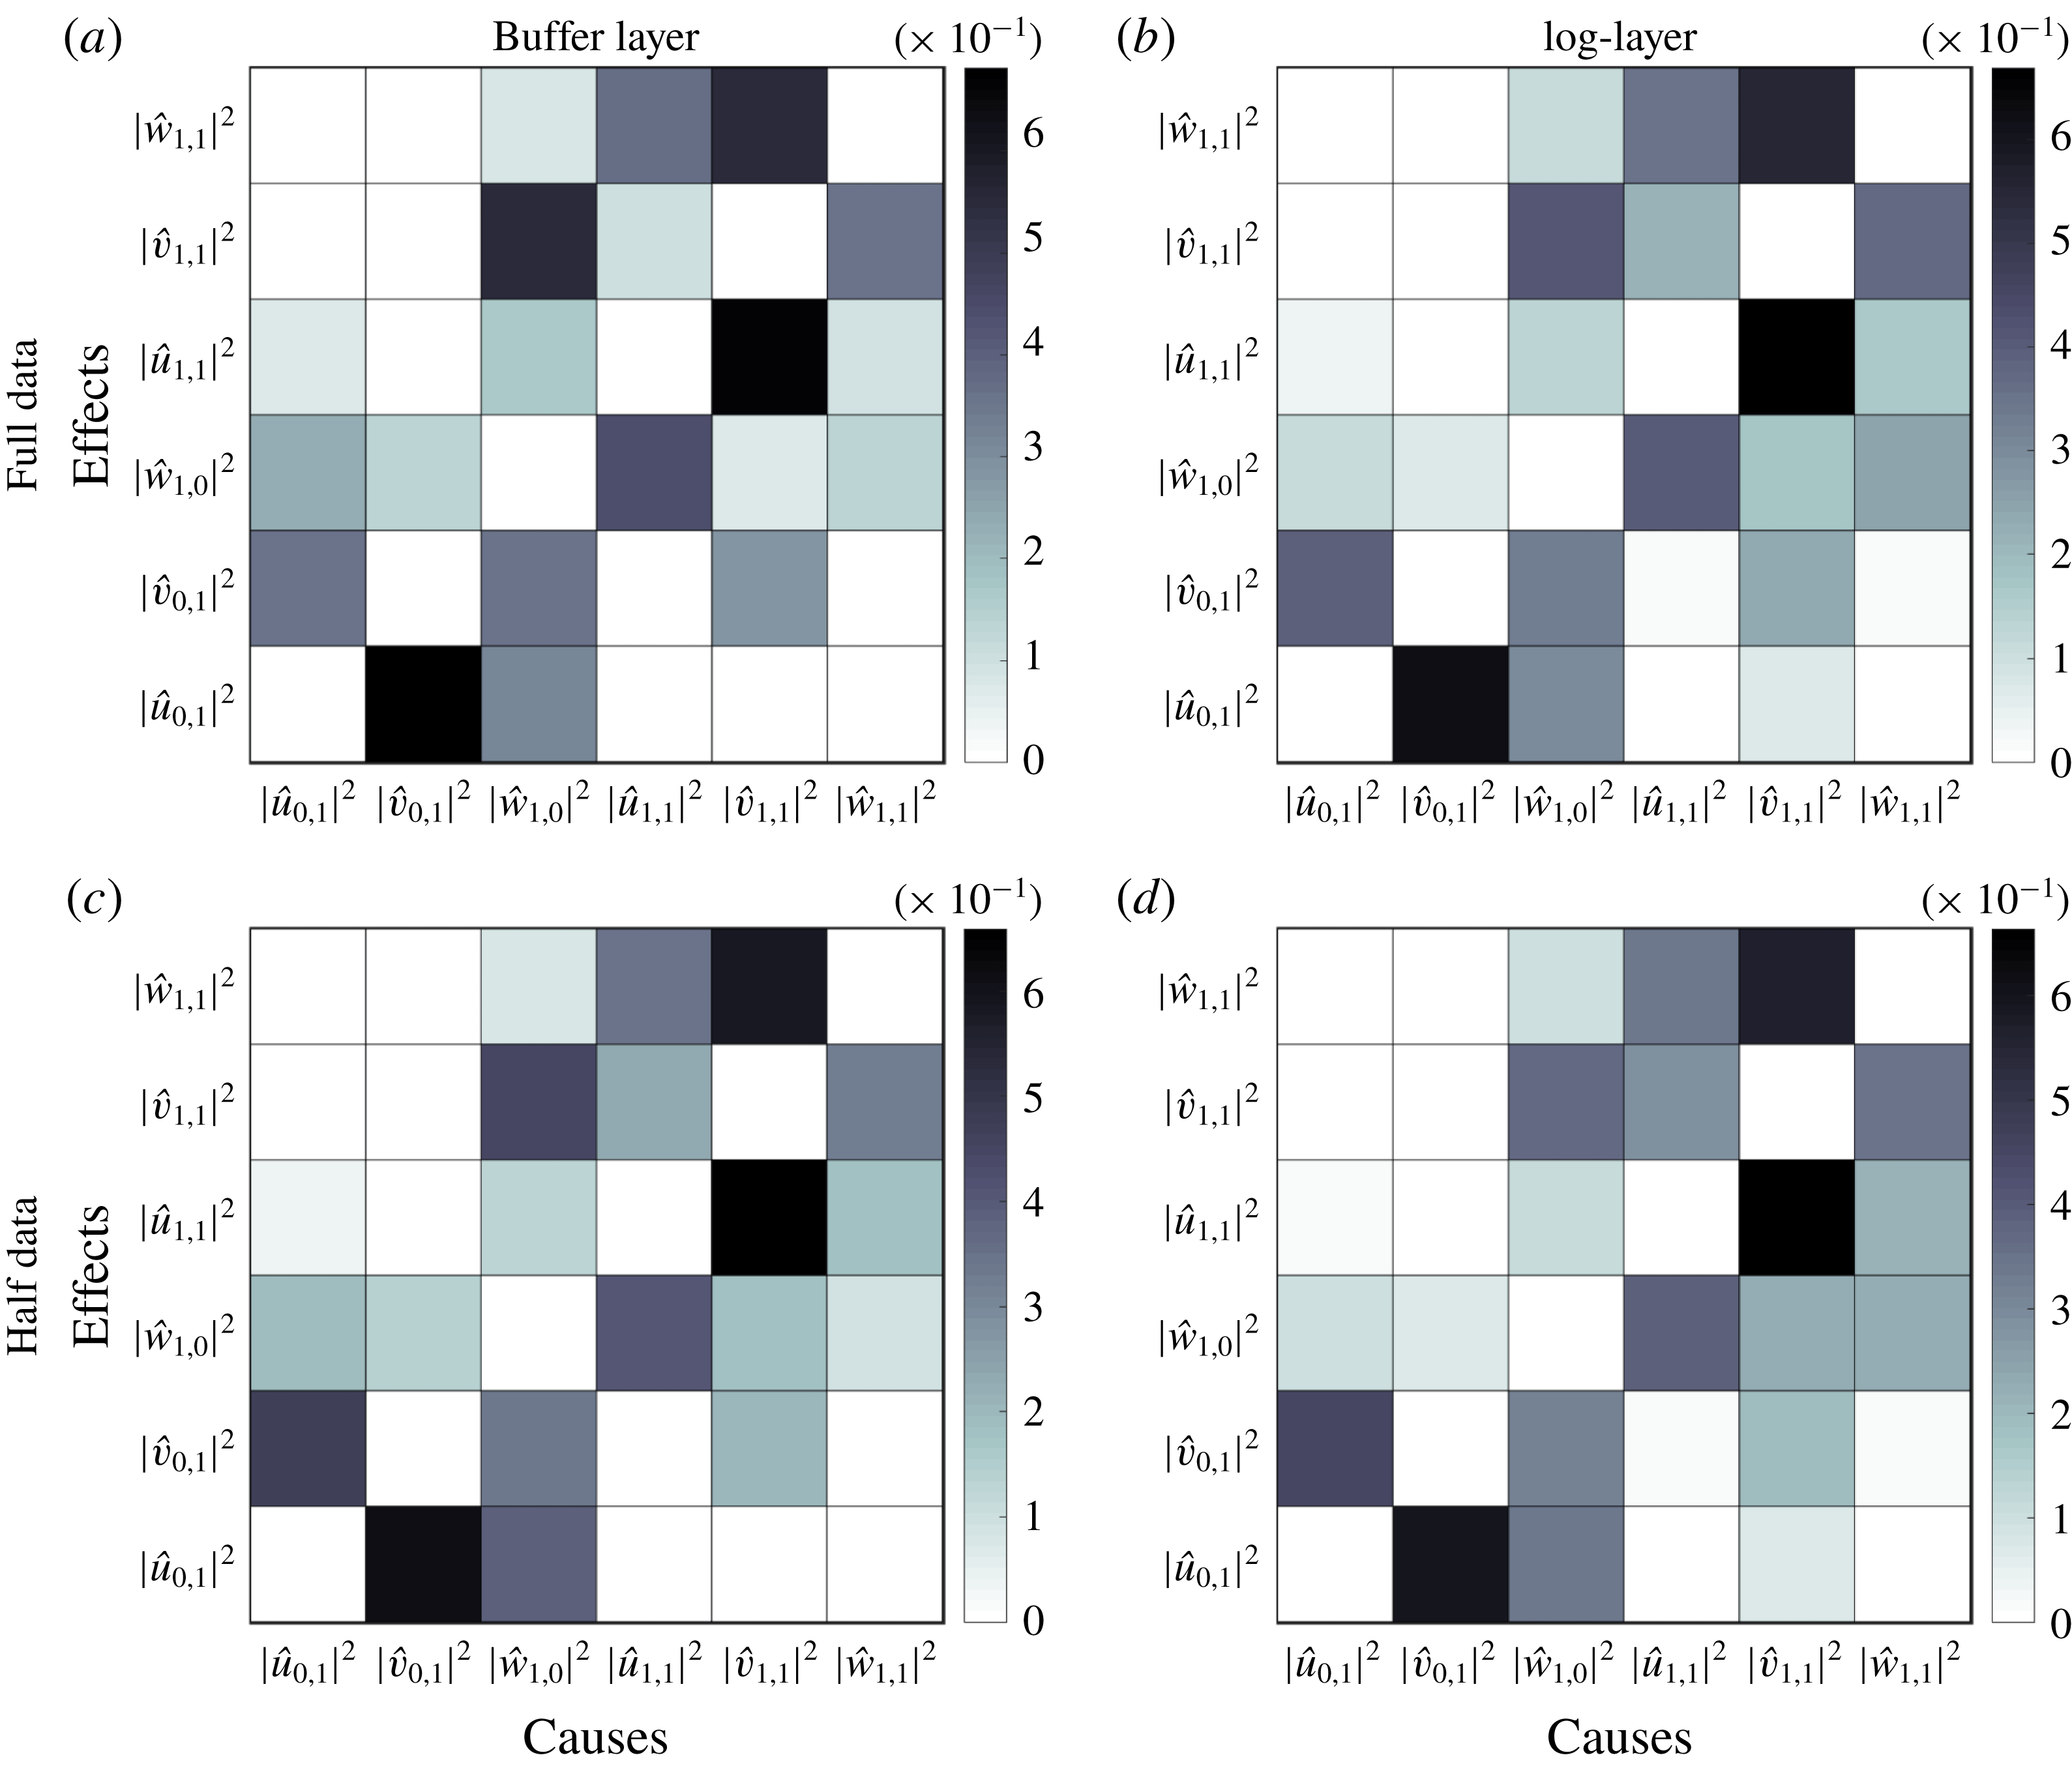
Causal maps computed using the complete temporal dataset (a,b), and half of the time history of the dataset (c,d). Results are for the buffer layer in (a,c), and log layer in (b,d).

The transfer entropy can also be estimated using kernel density estimators (Wand & Jones Reference Wand and Jones1994) and
 $k$
th-nearest-neighbour estimators (Kozachenko & Leonenko Reference Kozachenko and Leonenko1987; Kraskov et al.
Reference Kraskov, Stögbauer and Grassberger2004). Both methodologies alleviate the computational cost associated with the estimation of transfer entropies and offer improvements for high-dimensional datasets (Kraskov et al.
Reference Kraskov, Stögbauer and Grassberger2004). However, the majority of these approaches depend on parameters that must be selected a priori, and there are no definite prescriptions available for selecting these ad hoc values, which may differ according to the specific application. For those reasons, the binning approach above was preferred. Nevertheless, we verified that similar conclusions are drawn by computing the values of
 $T_{j\rightarrow i}$
using the Kozachenko–Leonenko estimator (Kozachenko & Leonenko Reference Kozachenko and Leonenko1987; Kraskov et al.
Reference Kraskov, Stögbauer and Grassberger2004).
Appendix B. Assessment of statistical significance
To provide a visual impression of the statistical convergence of the causal maps in § 3.2, we display in figure 9 the values of
 $\tilde{T}_{j\rightarrow i}$
using the complete dataset (figure 9
a,b, equivalent to § 3.2 in the manuscript), and a reduced dataset by shortening the time signals by half (figures 9
c,d). The results indicate that variations in the most intense transfer entropies are below 10 %.
More quantitatively, the statistical significance of the values of
 $T_{j\rightarrow i}$
associated with
 $\tilde{T}_{j\rightarrow i}>0.3$
are evaluated under null hypothesis (H0) of no transfer entropy among variables. A new transfer entropy
 $T_{j\rightarrow i}^{\text{H0}}$
is estimated replacing
 ${\mathcal{V}}_{j}$
by a surrogate signal
 ${\mathcal{V}}_{j}^{\text{H0}}$
synthetically generated from the transitional probability distribution of the actual sample. The methodology utilised is block bootstrapping preserving the dependencies within each time series (Kreiss & Lahiri Reference Kreiss, Lahiri, Rao, Rao and Rao2012). The procedure is repeated thousand times for each
 $j=1,\ldots ,6$
to produce multiple
 ${\mathcal{V}}_{j}^{\text{H0}}$
, which yield a distribution of transfer entropies under the null hypothesis of no causality. The
 $p$
-value (or probability value) associated with the null hypothesis is then computed by the probability of
 $T_{j\rightarrow i}^{\text{H0}}$
being larger than the probability of the actual estimated value of
 $T_{j\rightarrow i}$
. The details of the procedure are documented in Thomas & Julia (Reference Thomas and Julia2013). The
 $p$
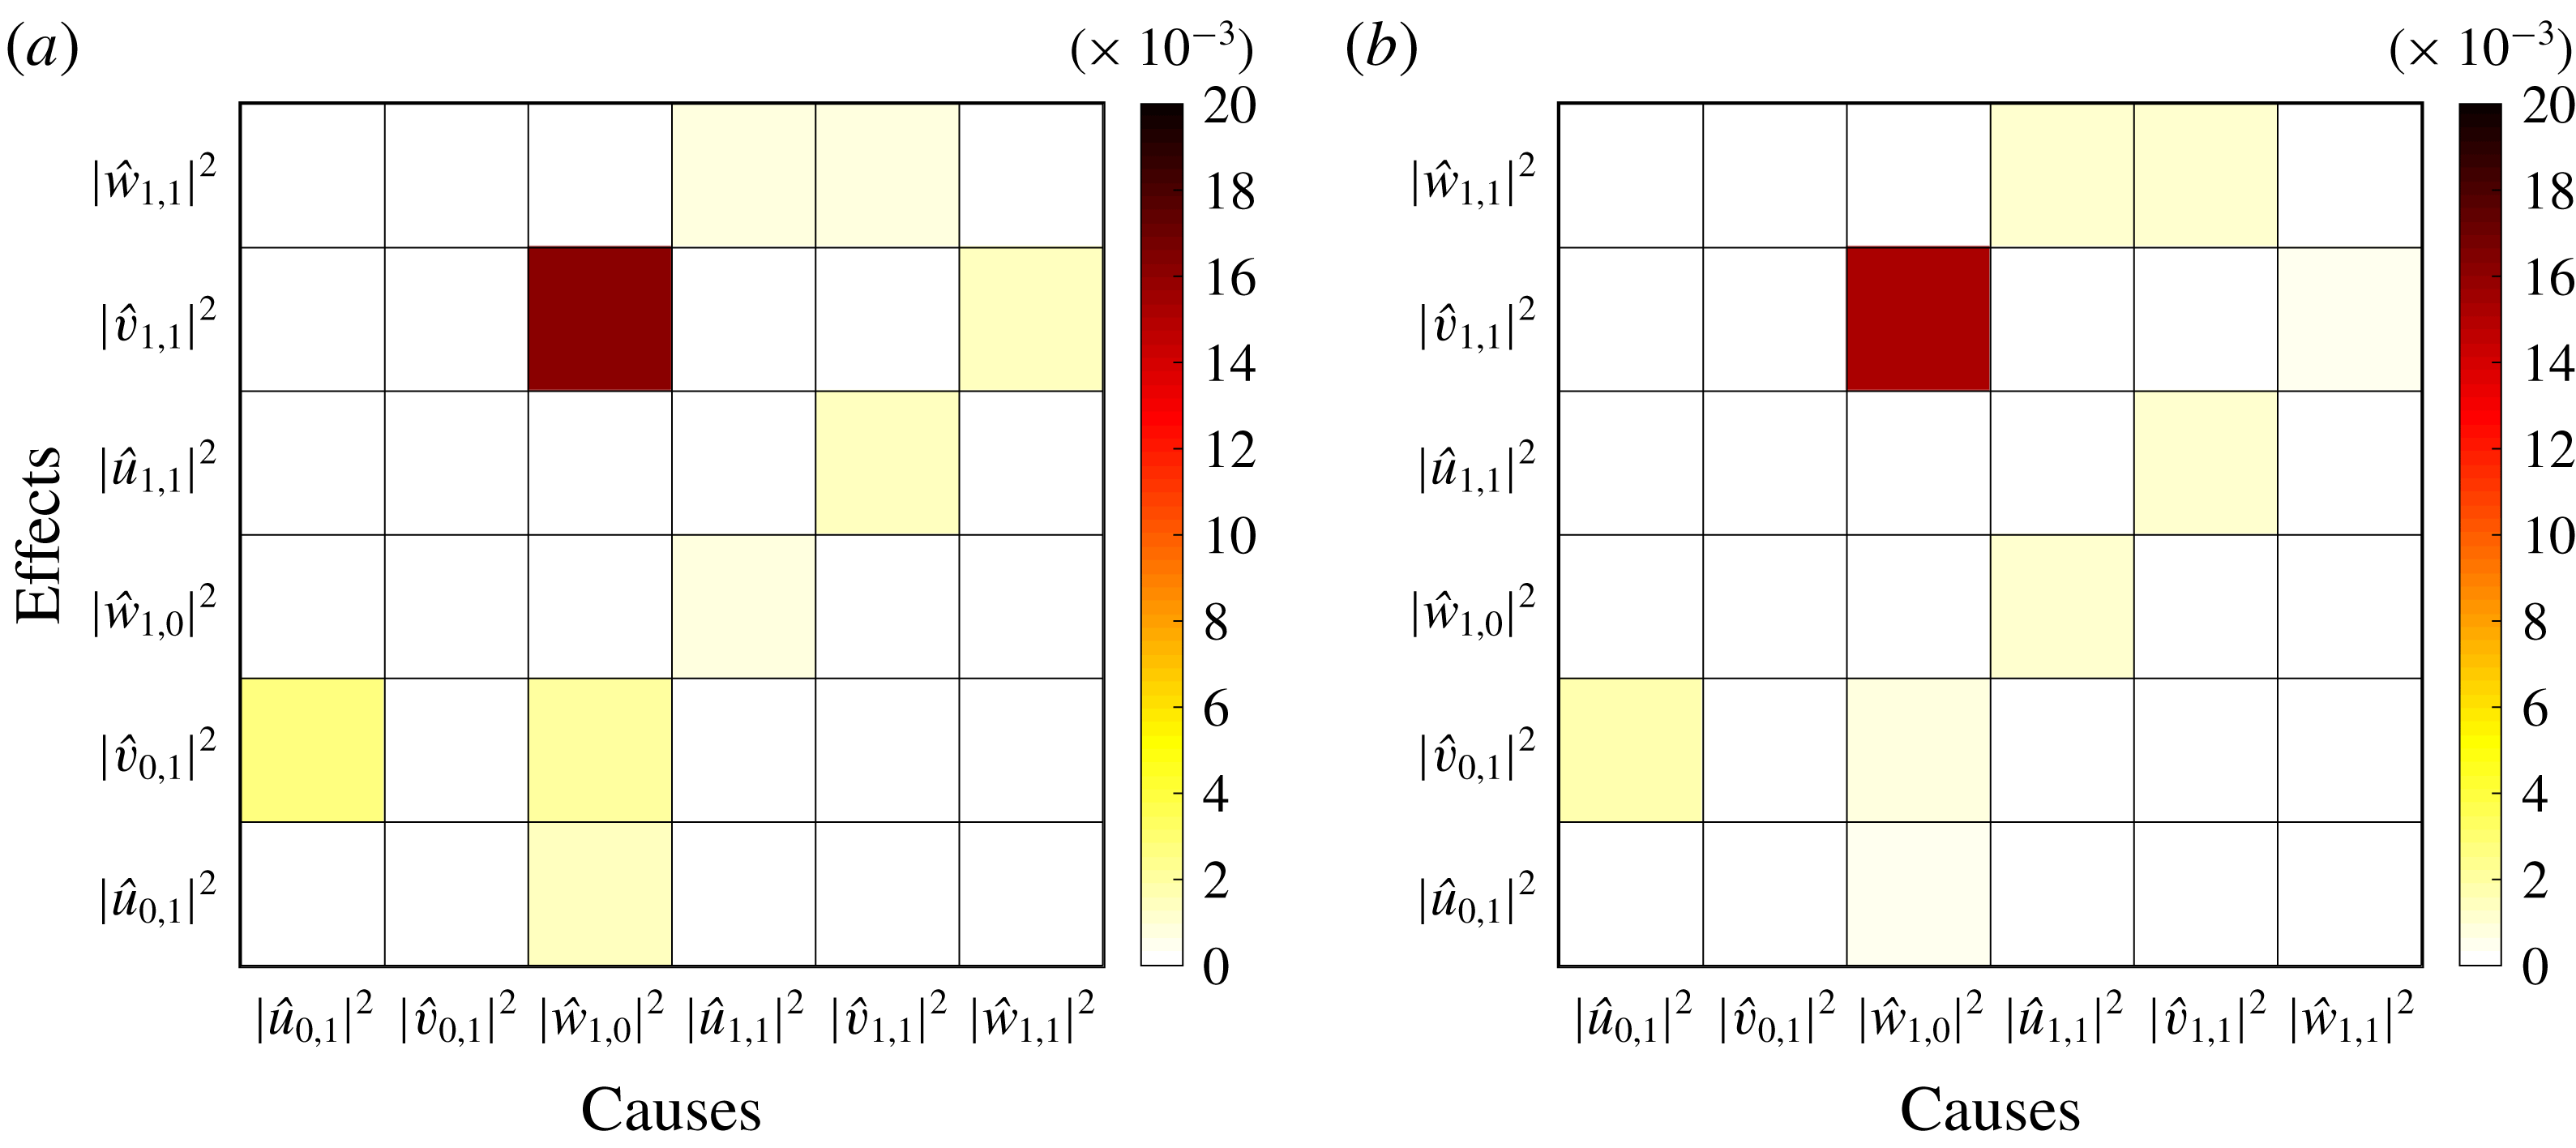
-values, reported in figure 10, are below the level of significance
 $\unicode[STIX]{x1D6FC}=0.05$
and the null hypothesis is rejected.
Statistical significance:
 $p$
-values of
 $T_{j\rightarrow i}$
for (a) the buffer layer and (b) the log layer. The values covered by the colour bar ranges from
 $\unicode[STIX]{x1D6FC}=0.00$
to
 $\unicode[STIX]{x1D6FC}=0.02$
.