I. INTRODUCTION
Photoelectrochemical (PEC) solar energy conversion on semiconductor surface has been extensively studied since the first report of Fujisima in 1972 using titanium dioxide (TiO2) photoanode.Reference Fujishima and Honda1 Titanium dioxide (TiO2) is well known as a candidate for water photocatalyst as it is abundant, stable in aqueous solution under irradiation, and has strong photocatalytic activity. However, due to its large band gap (∼3.2 eV), it is only active in the ultraviolet (UV) region, which contributes less than 5% of the total energy of the solar spectrum. One of the prerequisites of enhancing the solar energy conversion efficiency of titania is to enhance the visible light activity of TiO2, which composes a greater portion of the solar spectrum (45%).Reference Abe2, Reference Kudo and Miseki3 Another requirement of an effective photomaterial is to obtain good electron–hole separation characteristics, which can be improved by reducing recombination centers and increasing charge transfer. TiO2 has a short hole diffusion length (∼10 nm for Rutile).Reference Salvador4 Therefore, it is advantageous to reduce the TiO2 layer thickness to decrease the diffusion pathway of photoholes to the electrode/electrolyte interface. Thus, nanostructured TiO2 has better photocatalytic properties, compared to the bulk. Moreover, in a PEC cell, electrons generated in TiO2 photoanodes have to travel within the TiO2 to the F-doped SnO (FTO) contact and then transfer to the cathode. Therefore, one-dimensional single-crystalline structures on conducting substrate are considered as an optimum morphology to enable electrons to travel to the FTO contact and holes to diffuse to the electrode/electrolyte interface in the easiest manner without any recombination lost at a grain boundary.Reference Hoang, Guo, Hahn, Bard and Mullins5 On the other hand, visible light activity of the TiO2 electrodes has been achieved by several strategies such as doping with impurities and sensitizing with low band gap semiconductors having proper conduction band levels.Reference Park, Choi and Hoffmann6–Reference Chen, Chen, Chang, Tsai, Liu, Hu, Chang and Chen9 Recently, low band gap semiconductors such as CdS, CdSe, and CdTe have been successfully studied as a sensitizer for TiO2 nanostructures using conventional successive ionic layer adsorption and reaction (SILAR) method.Reference Lee, Bang, Park, Kim and Park7, Reference Baker and Kamat10 Chi et al. reportedReference Chi, Liau and Lee11 that additional heat treatment of the TiO2 nanoparticulate film-sensitized CdS or CdSe increased photocurrent response of the electrode due to the better crystalline between TiO2 and CdS and decreased band gap of the CdS particles. In this work, polycrystalline TiO2 nanotubes by anodization of Ti foilReference Varghese, Paulose, Shankar, Gopal and Grimes12, Reference Mor, Varghese, Wilke, Sharma, Shankar, Latempa, Choi and Grimes13 and hydrothermally grown TiO2 nanorods (TNRs, single crystalline) on FTO glass substratesReference Liu and Aydil14–Reference Feng, Shankar, Varghese, Paulose, Latempa and Grimes16 were fabricated in the same length (∼1 μm), respectively, and compared to examine crystalline effects of TiO2 on the photocatalytic performance. Furthermore, to enhance the visible light activity of the TiO2, the photoelectrodes sensitized with CdS and were heat treated subsequently.
II. EXPERIMENTAL DETAILS
The TiO2 nanotubes arrays were fabricated by electrochemical anodization of Ti foils with thickness of 0.1 mm and 99.6% purity (Alfa Aesar, Royston, UK), which were cleaned by sonification in trichloroethylene (TCE), acetone, and methanol, using electrolytes of 0.15 M NH4F in solution with ratio of 19:1 in formamide (FA) and deionized water, and 35 V for 30 min at room temperature. A platinum foil was used as the counter electrode. Anodization techniques using organic electrolytes such as dimethyl sulfoxide, FA, ethylene glycol, and N-methylformamide are feasible for fabricating long TiO2 nanotube arrays as described in Refs. Reference Varghese, Paulose, Shankar, Gopal and Grimes12 and Reference Mor, Varghese, Wilke, Sharma, Shankar, Latempa, Choi and Grimes13. Amorphous TiO2 nanotubes (NT) formed by the anodization processes were annealed for crystallization at 450 °C in air for 1 h. Vertically oriented TNRs were fabricated by a hydrothermal method on the FTO Glass. Briefly, FTO glasses were first ultrasonically cleaned with TCE, acetone, methanol, and finally dried with N2 gas bowing. Then, FTO glasses were put in 30 mL HCl, 30 mL deionized water (DI), and 1 mL titanium butoxide containing autoclave. The hydrothermal reaction was conducted at 150 °C for 5 h. After reaction, the samples were washed in DI water, dried by N2 gas bowing, and subsequently annealed at 450 °C for 1 h. The CdS was sensitized by SILAR method. In typical experiments, TiO2 NT and nanorods (NR) were subsequently immersed in to 0.1 M Cd(NO3)2 and 0.1 M Na2S for 3 min. After each immersion, samples were thoroughly rinsed with DI water. NT and NR after CdS sensitization were heat treated at 300 °C for 30 min.
Observation of nanostructured samples was performed using field emission scanning electron microscope (FESEM) (JSM-6500F) and transmission electron microscopy (TEM) (JEM 2100, JEOL Ltd., Tokyo, Japan). Electrochemical measurements were performed using a three-electrode system (AMT VERSASTAT3, Princeton Applied Research, Oak Ridge, TN) consisting of a Pt wire counter electrode and a saturated Ag/AgCl reference electrode. The potential was swept linearly at a scan rate of 50 mV/s. Water photoelectrolysis tests for 1 cm2 working electrodes, illuminated using a 1 KW xenon lamp from which infrared wave lengths were filtered by water, carried out in a 1 M Na2S electrolyte. Measured light irradiance by a thermopile detector was 100 mW/cm2. For visible light illumination, wave length below 420 nm was cut off by an optical filter. A monochromator (Newport Corporation, Irvine, CA) was used for investigation of monochromatic responses of samples in the wave length range from 300 to 700 nm by applying 0.5 V external bias. Quantitative measurements for hydrogen generation have been performed in H-type glass PEC cell, where anode and cathode were separated by Nafion membrane. In the PEC cell, the hydrogen was evolved from the Pt electrode. Produced gas was taken using glass microsyringes every 20 min and analyzed using a gas chromatograph (GC).
III. RESULTS AND DISCUSSION
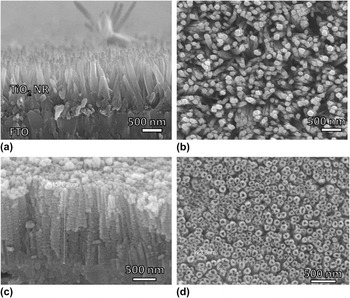
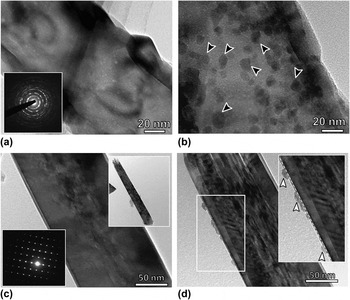
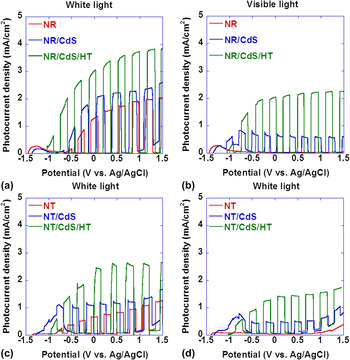
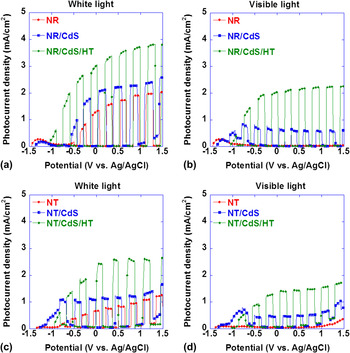
Figure 1 shows FESEM images of nanotube and nanorod arrays. Figures 1(a) and 1(b) show surface and cross-sectional views of the nanotube arrays on Ti substrate, respectively. Figures 1(c) and 1(d) show cross-sectional and surface view of the single-crystalline TNRs on FTO glass substrate, respectively. From the cross-sectional images of both nanotube and nanorods, it is seen that they grow relatively perpendicular to the substrate. To compare systematically the photocatalytic properties of the NTs and NRs, they were grown with same length (∼1 μm). Figures 2(a) and 2(c) show bright field TEM image of TiO2 nanotubes and TNRs before CdS sensitization, respectively. Both tubes and rods show clear surface before the SILAR process. Diameter and wall thickness of the nanotubes are ∼120 and 18 nm, respectively. Insets of Figs. 2(a) and 2(b) show electron diffraction patterns of the nanotubes and nanorods, respectively, which clearly represent the polycrystalline and single-crystalline nature of the tubes and rods, respectively. After CdS sensitization, we can see well-isolated distinct CdS particle with average diameter of 8 ± 3 nm all over the nanotube length. TEM investigations confirmed (images are not shown) that density and size of the nanoparticles can be controlled by changing the SILAR cycle numbers. In nanorod case, CdS nanoparticles are not well distinctly distributed and mainly adsorbed on the outer surface of the nanorods as indicated by white arrowheads in Fig. 2(c); sometimes, they form thin film composed of several layers of CdS particles. Crystallinity and post heat treatment effects of the CdS nanoparticles were examined by photocurrent measurements of the samples under both white and visible light illumination, and results are shown in Fig. 3. Figures 3(a) and 3(b) show chopped photocurrent responses of NRs before and after CdS sensitization under white and visible light illumination. Photocurrent of bare TNRs under white light irradiation measured as ∼1.5 mA at 0.5 V versus Ag/AgCl, and it increases to ∼2.2 mA after CdS sensitization. Photocurrent further increases up to 3.5 mA after additional heat treatment of CdS/TiO2 samples at 300 °C for 30 min. Under the visible light, bare NRs show no photoresponse, and only after CdS sensitization, it shows photoresponse. Sensitization with CdS provides photocurrent increased nearly 2-fold under both white and visible light irradiation. Similar trend can be observed for nanotube arrays photoanode as shown in Figs. 3(c) and 3(d). After CdS sensitization, TiO2 nanotubes/TNRs were subjected to heat treatment at 300 °C in N2 atmosphere, and photocurrent responses are shown in Fig. 3. It is clearly seen that photocurrent densities under both white and visible light irradiation have dramatically increased compared to nonannealed samples. This improvement can be ascribed to improved crystallinity of CdS particles and interface between CdS and TiO2. Another reason of improved photocatalytic activity is the increased crystal size of the CdS nanoparticles as reported by Chi et al.Reference Chi, Liau and Lee11 It was shown that by increasing the annealing temperature (150–400 °C), CdS nanoparticles were increased in size from ∼7 to 9 nm. Increased particle size leads to decreasing the band gap of the particle from 2.3 to 2 eV, which is active in the large portion of the visible light spectrum. From our measurements, it is seen that the photocurrent response of NRs is higher compared to NTs. This difference can be explained by microstructural differences of the photoanodes. After electron and hole generation within the semiconductor, separated charges migrate to semiconductor/electrolyte interface. This process strongly depends on crystal structures and crystallinity of the semiconductor. Defects such as gain boundaries in polycrystalline photocatalysts act as trapping and recombination centers of photogenerated electrons and holes, resulting in a decrease in the photocatalytic activity. Therefore, lower photocurrent in polycrystalline NTs is due to the grain boundaries within the NT.
FESEM images of TiO2 nanotubes and TNRs. (a) and (b) cross-sectional and surface view of TNRs on FTO glass. (c) and (d) cross-sectional and surface view of the TiO2nanotubes on Ti substrate.

(a) and (b) are the TEM bright field images of the TiO2nanotubes before and after CdS nanoparticle sensitization, respectively. (c) and (d) are the TEM images of TNRs before and after CdS nanoparticle sensitization, respectively. Insets of the (a) and (b) show electron diffraction patters of the nanotubes and nanorods, respectively.

Photocurrent measurement results of the TiO2 nanostructured photoanodes. (a) and (b) show photocurrent response of the bare TiO2, CdS/TiO2, and CdS/TiO2 after heat treatment anodes under white (a) and visible light (b). (c) and (d) are photocurrent of TiO2nanotubes under white and visible light irradiation, respectively.

To further quantify the photocatalytic performance of the samples, measurements of incident photon to current conversion efficiency (IPCE) were made to study the photoresponse of bare and CdS-sensitized TiO2 NRs and NTs as a function of incident light wave length (Fig. 4). Bare TiO2 had strong photoresponse in the near-UV region but little photoresponse above 400 nm. However, the sensitized samples show substantial photoactivity in the visible light region from 400 to 550 nm in addition to strong photoresponse in the near UV. These results clearly confirm that CdS sensitization improves visible light absorption, and photogenerated electrons in CdS can be transferred to TiO2 NRs, which significantly increase the IPCE throughout the entire visible region for the CdS/TiO2 photoanode. IPCE results also confirm the superior photocatalytic properties of the NR photoanode over NTs in the UV region of the light spectrum, showing maximum IPCE of ∼65% and 33%, respectively. The electrochemical cells were used for hydrogen generation performed at the 0.5 V corresponding to the IPCE measurement potential. The hydrogen evolved from Pt cathode was collected and analyzed using a GC. Figure 4(c) shows the hydrogen generation rate as a function of time within 2 h. In the first hour, the hydrogen evolution rates for CdS/TiO2 NRs and CdS/TiO2 NTs electrodes are 11 and 5.3 μmol/(cm2 h), respectively. The hydrogen generation rate of the NR-based electrode is much higher than the electrode using NTs. The mean hydrogen generation rate of the CdS/TiO2 NRs and CdS/TiO2 NTs electrodes within 2 h have increased up to 32 and 21 μmol/(cm2h), respectively.
IPCE results of TNRs (a) and nanotubes (b) before and after CdS sensitization. (c) Hydrogen evolution rates for CdS-sensitized nanorods and nanotubes.

IV. SUMMARY
Hydrothermally grown single-crystalline nanorods show superior photocatalytic properties compared to polycrystalline TiO2 nanotubes due to the reduction of structural defects, which lead to the ineffective charge transport of the electrodes. Grain boundaries in the polycrystalline TiO2 nanotubes acted as a recombination centers hindering the charge carries pathway. Enhancement of the visible light activity of the TiO2 photoanodes was achieved by sensitizing with CdS nanoparticles. Subsequent heat treatment of the CdS/TiO2heterostuctures demonstrated nearly two times increased photocurrent density compared to as-sensitized CdS nanoparticles under both white and visible light.
ACKNOWLEDGMENT
This work was supported by Mid-Career Researcher Program through NRF grant funded by the MEST (Grant No. 2011-0017965).