In animal production systems, genetic and environmental factors are the main factors affecting both current phenotypes and the expected phenotypic changes in future generations (Huquet et al., Reference Huquet, Leclerc and Ducrocq2012). However, these factors are usually considered independent in genetic evaluations, and a possible genotype by environment interaction (GEI) is not considered. Genotype-environment interactions are responsible for the difference in the expression of the same genotype in different environments (Falconer, Reference Falconer1990; Hammami et al., Reference Hammami, Rekik, Bastin, Soyeurt, Bormann, Stoll and Gengler2009). As a result of such interactions, a genotype that performs well in a given environment may not perform well in another, resulting in increased or decreased genetic differences between sires. This could result in relevant reranking of sires depending on the environment (van der Laak et al., Reference van der Laak, van Pelt, de Jong and Mulder2016).
Advances in reproductive technologies have enabled the diffusion of a given genotype across a wide variety of environments. Therefore, the effects of GEI have been drawing considerable interest among breeders in order to improve breeding programs for dairy cattle (Streit et al., Reference Streit, Reinhardt, Thaller and Bennewitz2012). This is because the response to selection could differ between the environment in which selection is applied and which genes are expressed. An animal's genetic value may, therefore, depend on the environment (Mota et al., Reference Mota, Silva, Lopes, Tempelman, Sollero, Aguilar and Cardoso2018). Studies aimed at evaluating these interactions, especially those using reaction norm models, can help clarify the genetic responses depending on the breeding environment and characterize these responses (Morrissey and Liefting, Reference Morrissey and Liefting2016).
Reaction norms enable the characterization of animal genetic performance in a given environmental gradient (Hay and Roberts, Reference Hay and Roberts2018). This allows the quantification of interaction under the environmental condition to be analyzed, enabling the identification of genotypes that are more suitable for specific environments (Streit et al., Reference Streit, Wellmann, Reinhardt, Thaller, Piepho and Bennewitz2013), therefore optimizing breeding programs and sire selection.
Different environmental descriptors can be included in GEI analyses to identify the effects of the environment on genotype expression. Environmental factors such as temperature are widely known to have detectable effects on milk production and composition (Komisarek and Kolenda, Reference Komisarek and Kolenda2016; Pragna et al., Reference Pragna, Archana, Aleena, Sejian, Krishnan, Bagath, Manimaran, Beena, Kurien, Varma and Bhatta2017). However, climate variations have not been considered in genetic evaluation studies performed in southern Brazil (Moreira et al., Reference Moreira, Pinto, Valloto and Pedrosa2018). Not considering GEI might lead to a bias in the genetic value of the data resulting in differences in the expected selection response (Streit et al., Reference Streit, Reinhardt, Thaller and Bennewitz2012).
One of the first studies of GEI involved in milk solid production using reaction norm models was that of Kolmodin et al. (Reference Kolmodin, Strandberg, Danell and Jorjani2004), who studied Nordic Red dairy cattle and observed a GEI between protein yield (PY) and environmental effects, such as herd production and fertility levels. Since then, several studies in different environments have been performed. For example, Streit et al. (Reference Streit, Reinhardt, Thaller and Bennewitz2012) studied Holstein cattle in Germany and analyzed how different herd production and health levels affected the genetic behavior of the population with respect to traits such as milk and solid production. Yin and König (Reference Yin and König2018) observed changes in the genetic performance of Holstein cattle in Germany based on changes in the level of the herds studied. Furthermore, Hammami et al. (Reference Hammami, Vandenplas, Vanrobays, Rekik, Bastin and Gengler2015), mentioned the possible impact of the temperature on dairy production traits in Holstein cows, especially in regions in which the hot climate can result in heat stress.
Since Brazil has a high temperature variation, from tropical to temperate climate, it is essential to verify the possible impacts caused by GEI under different temperature gradients. Despite the importance of temperature effects on animal production, no study included this specific effect in genetic performance evaluation of Brazilian Holstein cattle for milk solids yield. Additionally, it is fundamental to mention that the model currently utilized in the genetic evaluation of Holstein cattle in southern Brazil does not consider the genotype by environmental effect, but only the additive and environmental effects as independent factors, not considering the interaction between them. For this reason, the objective of the present study was to evaluate the genetic performance of Holstein cattle population, for solid traits, in southern Brazil, analyzing the genotype by environment interaction under a reaction norm model.
Materials and methods
From the database of official milk records of the Paraná Holstein Breeders Association, Brazil (APCBRH), data on fat yield (FY) and protein yield (PY), adjusted on 305 d yields, from 67 360 primiparous females, born between 1990 and 2015 and daughters of 936 bulls were extracted. The relationship matrix was composed of 95 073 animals, being 406 founders, 8441 animals with some level of inbreeding, average inbreeding of 0.037, and pedigree depth of six generations. The animals belong to 398 herds, from 88 cities of southern Brazil situated between the parallels 22°30′58 ‘north latitude and 26°43′00’ south latitude and between the meridians 48°05′37 ‘east longitude and 54°37′08’ west longitude.
Based on the methodology of Alvares et al. (Reference Alvares, Stape, Sentelhas, De Moraes Gonçalves and Sparovek2013), the average annual temperatures of the studied regions were at 17 °C in the southern region and 19.5 °C in the northern regions of the studied areas. Thus, southern Brazil could be distinguished into six temperature gradients, separated at every 0.5 °C. In this study, these divisions were utilized as control variables, and the genetic responses of the animal population were verified under the various changes through the temperature gradients.
The statistical software SAS (SAS Inc., 2013) was used to perform data editing. Phenotypic information higher or lower than ±3 standard deviation was removed. Records that included errors, insufficient information, animals of unknown parents, bulls with progeny in one herd only, and contemporary groups containing fewer than three animals were also removed. The adjusted data resulted in a file with 3544 contemporary groups, defined as herd-year-season, with four seasons (December to February, March to May, June to August, and September to November). The effects included in the model were the fixed effects of contemporary group and age at first calving (covariate – linear and quadratic) and the additive genetic effect as random effect.
Among the temperature gradients, herd connectivity occurred through bulls being represented by progeny in at least three gradients. As the animals were of unknown parentage, bulls that had been represented in less than three gradients or bulls that featured only once in the herd were removed from the database. Finally, each retained temperature gradient included a minimum of 1000 cows for the analysis.
The random regression model was adopted to analyze the GEI, through reaction norms, adopting the residual variance as heterogeneous. The fourth class was used because it presented the best fit after testing eight classes, under the Legendre polynomials. These polynomials were selected to promote better convergence of the data in the orthogonal regressions, as seen in the work of Schaeffer (Reference Schaeffer2004).
The reaction norm model, via random regression, is described as follows:
 $$y_{ijk} = {\rm AF}{\rm C}_n + {\rm C}{\rm G}_l + {\rm \Sigma }_{m = 0}^M \beta _m\phi _m\lpar T \rpar + {\rm \Sigma }_{m = 0}^M \alpha _{im}\phi _m\lpar T \rpar + \varepsilon _{ijk}$$
where yijk: phenotypic record for animal i (i = 1, 2, …, N), the progeny of sire j (j = 1, 2, …, N); raised in k temperature gradient (k = 1, 2, …, 6), T: average temperature; ϕ m(T): m th Legendre polynomial order; CGl: contemporary group (levels = 1,2,…,3544); AFC: age at first calving (levels = 1,2,..,22); β m average regression coefficient of order m (m = 01,2…M); α im random regression coefficient of order m for the additive genetic effect of animal i; ɛijk: residual effect of animal I, the progeny of sire j, raised in k temperature gradient. The matrix representations are given as follows:
 $${\bi y} = {\bi Xb} + {\bi Zu} + {\bi e}$$
assuming that:
 $${\bi E} = \left[{\matrix{ y \cr b \cr u \cr } } \right] = \left[{\matrix{ {Xb} \cr 0 \cr 0 \cr } } \right]\;\,{\rm and}\,\,{\bi V}\left[{\matrix{ u \cr e \cr } } \right] = \left[{{\rm \;\;}\matrix{ {K_{rn}\otimes A} & 0 \cr 0 & R \cr } } \right]$$
where y is the vector of observations; b is the vector of the fixed effects attributed to the contemporary group; u is the vector of random effects; e is the vector of the residual effects; X and Z are the incidence matrices for the fixed and random effects, respectively; K rn is the covariance matrix linked to the random effects for the model parameters of the reaction norms; A is the additive numerator relationship matrix; and R is the residual variance matrix.
Mixed models of analysis using the restricted maximum likelihood method (REML) were applied using WOMBAT® software (Meyer, Reference Meyer2007), in order to estimate the heritabilities, the genetic correlations between gradients and breeding values. A subset of data, with information from the bulls present in all temperature gradients, was formed to present a more reliable representation of the breeding values in each gradient. For these analyses, 15 of the most representative bulls in the population (≥300 daughters) were considered, by noting the genetic responses of these daughters throughout the temperature gradient changes. These 15 bulls represented 53% of the sires classified as the main representatives, presented in all evaluated environmental gradients.
Results
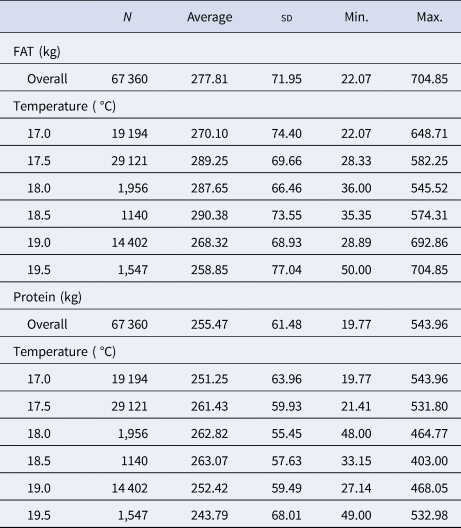
The descriptive statistics for FY and PY are presented in Table 1. The coefficient of variation for the temperature gradients varied between 23% for regions with 18 °C and 30% for those of approximately 19 °C. Protein production, like FY, was highest at 18.5 °C and lowest at 19.5 °C. The difference in PY between temperature gradients was up to 7.90%, corresponding to a difference of up to 19.28 kg protein/lactation/animal. The coefficient of variation for the temperature gradients varied between 21% for the regions with 18 °C and 28% for those with approximately 19.5 °C.
Descriptive statistics for fat and protein yield at different temperature levels among Holstein cattle in southern Brazil

N, number of bulls included in the analysis; sd, standard deviation; Min., minimum yield; Max., maximum yield.
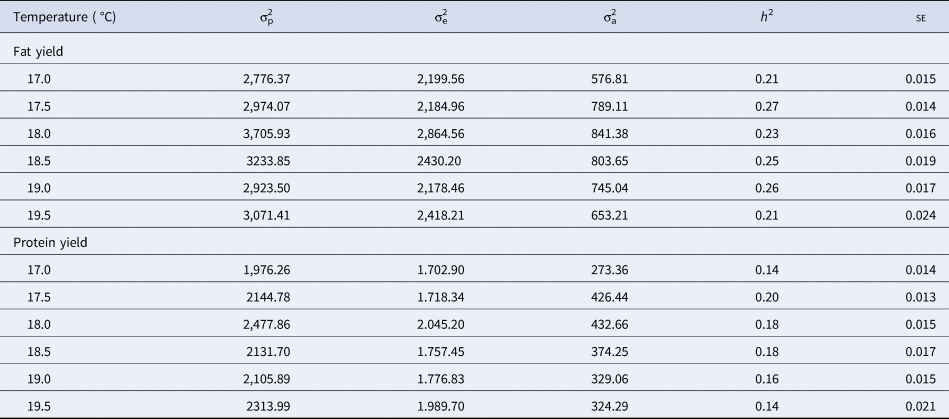
The genetic, environmental and phenotypic variances as well as heritabilities for FY and PY are presented in Table 2. For FY, the genetic variance was highest at 18 °C and lowest at 17 °C. Heritability was more than 0.20 at all temperature gradients, with the highest value for regions with 17.5 °C. For PY, unlike FY, heritability was less than 0.20 at all temperature gradients, except at 17.5 °C. The genetic variance was highest at 18.5 °C and lowest at 17 °C. For FY, a slight increase in heritability was observed with increased temperature, with two peaks at approximately 17.5 °C and 19 °C. For PY, there was an apparent decrease in heritability with temperature increase.
Phenotypic variance (σ2p), environmental variance (σ2e), genetic variance (σ2a), heritability (h 2), and their standard error (se) at different temperature gradients for FY and PY of Holstein cattle in southern Brazil

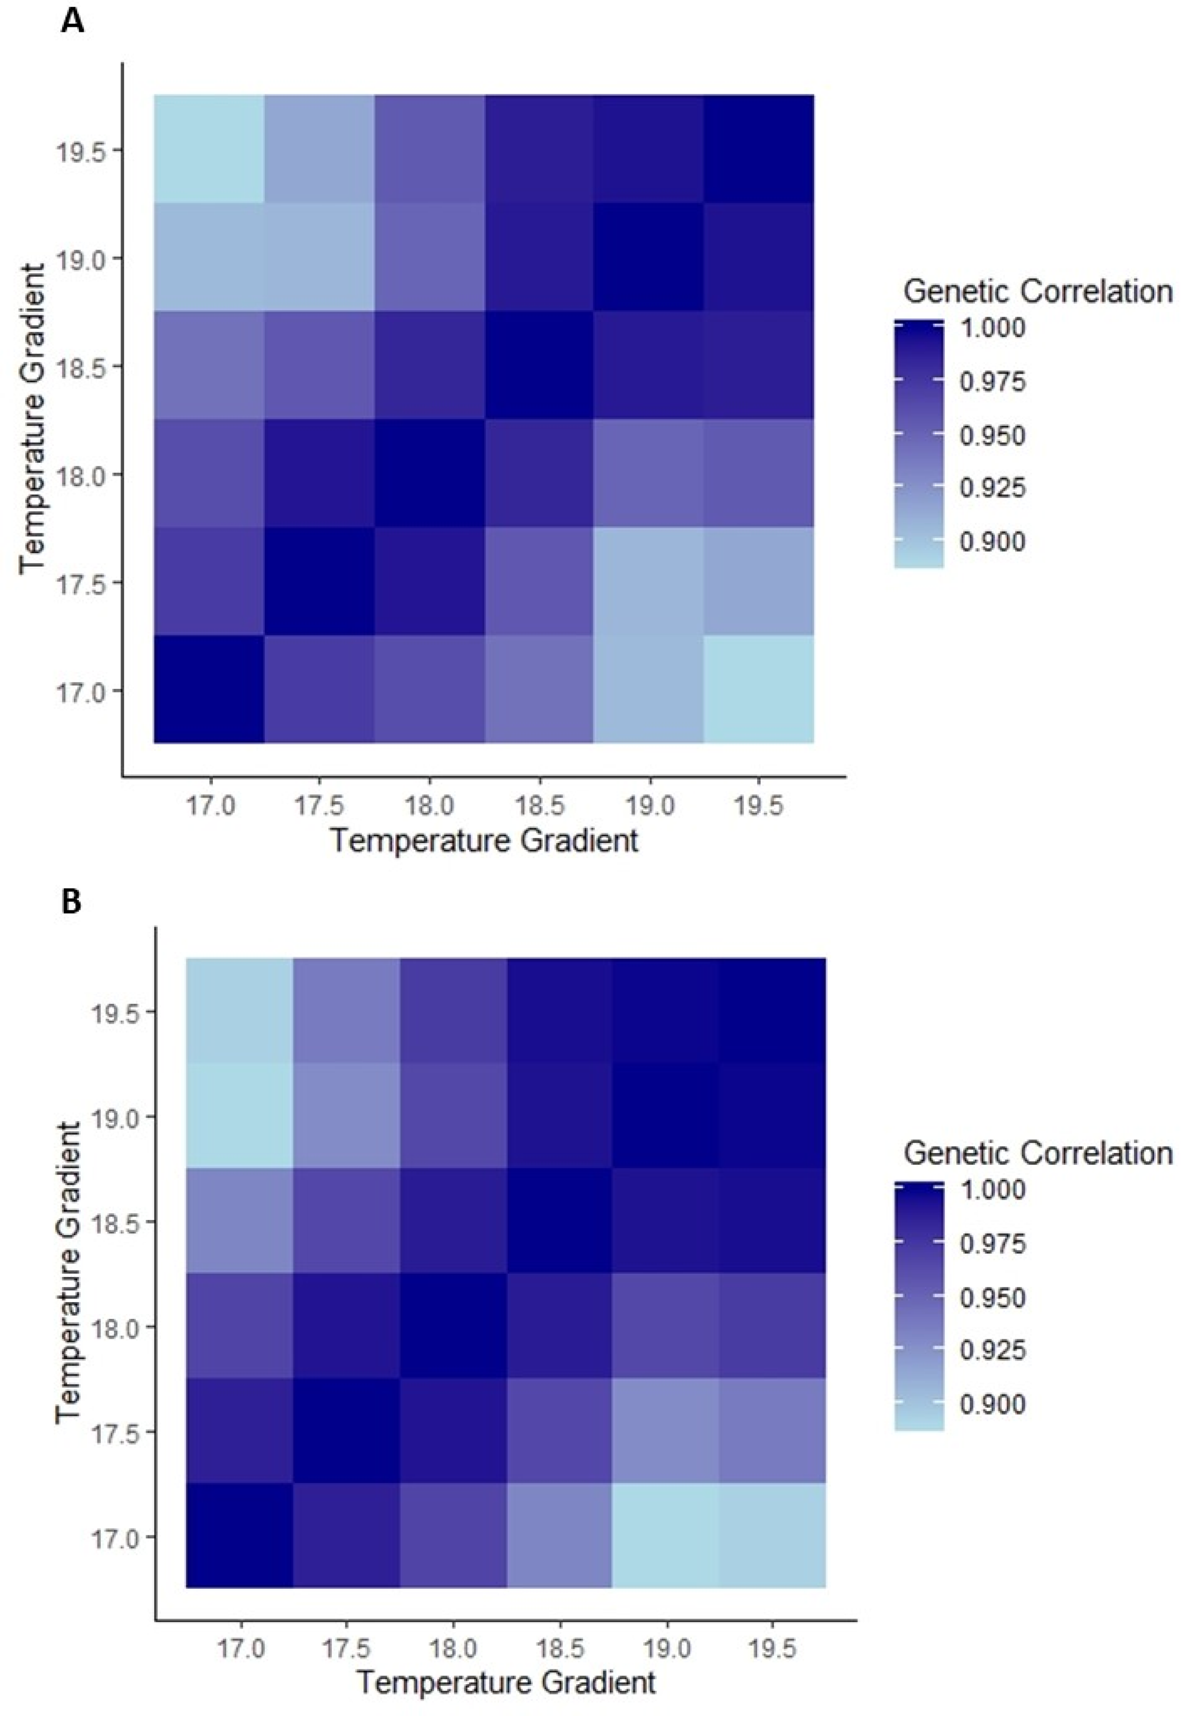
The correlations between temperature gradients, used to verify the existence of a GEI for FY and PY, are presented in Fig. 1. All correlations between temperature gradients were high for FY, with the lowest (0.89) being observed between gradients 17 °C and 19.5 °C. The remaining correlations between gradients were higher than 0.90. The correlations between temperature gradients for PY are presented in Fig. 1. For PY, high correlations between temperature gradients were observed mainly from 17.0 °C to 18.0 °C. Correlations between 17.0 °C and 18.5 °C, 17.0 °C and 19.0 °C, and 17.0 °C and 19.5 °C were lower than 0.90.
Genetic correlations between temperature gradients for fat yield (A) and protein yield (B) in the Holstein cattle of Southern Brazil.

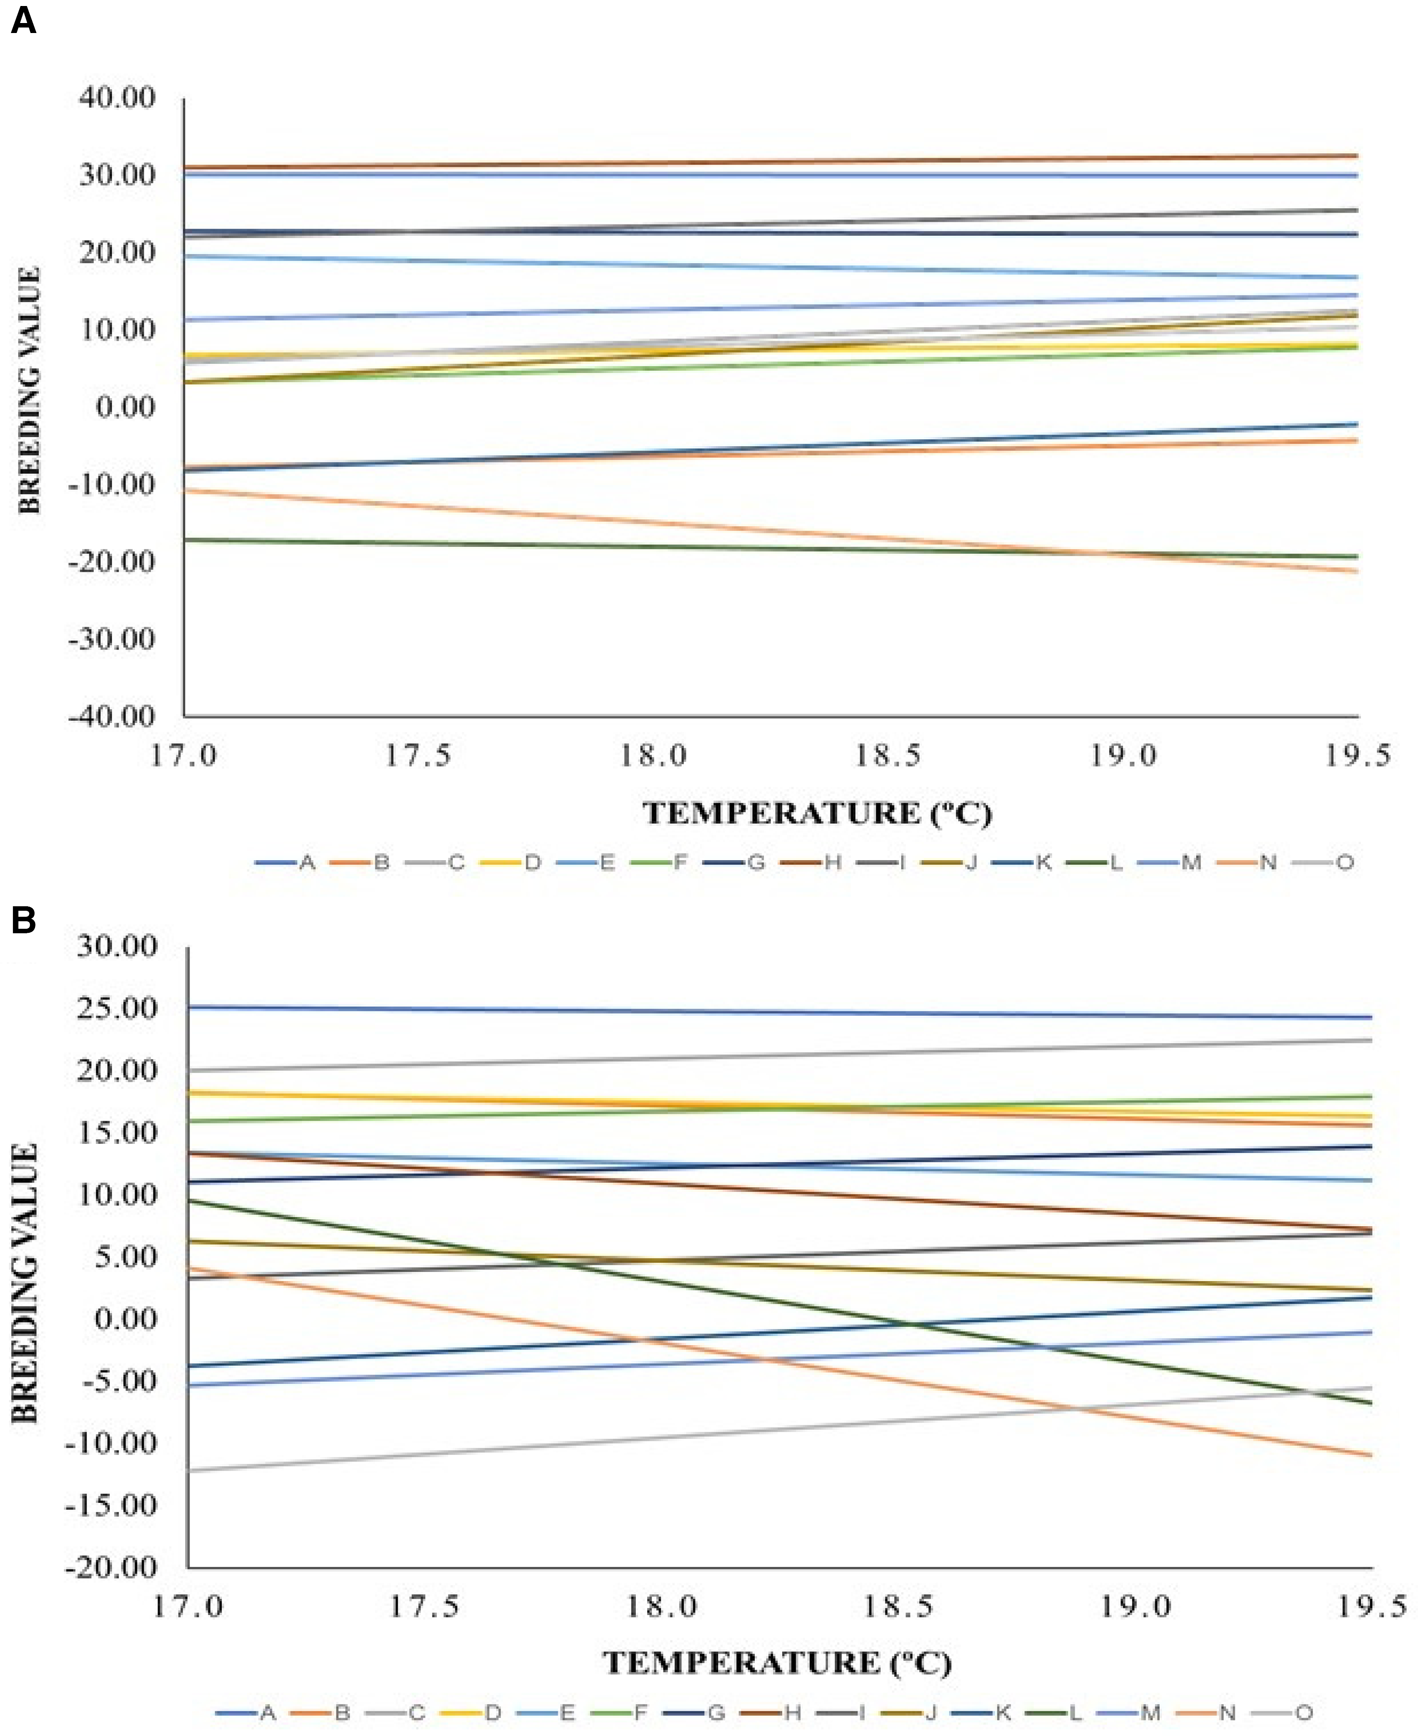
The range in breeding value for FY and PY of the 15 most representative bulls across the range of ambient temperatures are presented in Fig. 2. For some bulls, a decrease in the breeding value of up to 10.12 kg fat was observed between 17 °C and 19.5 °C, whereas, for others, an increase in breeding value of up to 10.69 kg fat with increase in temperature was observed. Reranking between temperature gradients was observed for some bulls, especially at 18.5 °C.
Reaction norms for fat yield (A) and protein yield (B) of the 15 most representative bulls utilized in Southern Brazil region.

For PY, the breeding value increased up to 9.47 kg protein with increase in ambient temperature. However, for some bulls, it decreased up to 7.17 kg protein. The breeding values for different bulls became closer with increase in temperature gradient. Reranking was observed for six bulls, which presented an increase in breeding value with increase in temperature.
Discussion
Relevant FY (277.81 kg/lactation/year) and PY (255.47 kg/lactation/year) were observed among the studied herds. Similar values have been reported by Moreira et al. (Reference Moreira, Pinto, Valloto and Pedrosa2018) for herds in southern Brazil. High volumes of milk solids from Holstein cattle are delivered to milk processing plants to produce milk derivatives in southern Brazil. However, the production capacity could potentially be increased to levels similar to those reported by Dekleva et al. (Reference Dekleva, Dechow, Daubert, Liu, Varga, Bauck and Woodward2012) for herds in the USA and Do et al. (Reference Do, Fleming, Schenkel, Miglior, Zhao and Ibeagha-Awemu2018) for herds in Canada, which are higher than those observed here.
For both traits, the production and the number of bulls included in the analyses were higher for more southern regions of the state (Table 1). This is related to more concentrated dairy farming in those regions (Paula et al., Reference Paula, Martins, Otávio, Antonio, Oliveira, Valotto and Ribas2009) and to the presence of cooperatives that promote research to increase milk solid production via incentives. This stimulates yield increase, as there is a monetary reward for this, which is not common in other regions in Brazil.
We observed that FY heritability was always moderate, varying from 0.21 to 0.27, reinforcing the absence of GEI. Similar heritability estimates have been reported by Moreira et al. (Reference Moreira, Pinto, Valloto and Pedrosa2018) and Paula et al. (Reference Paula, Martins, Otávio, Antonio, Oliveira, Valotto and Gasparino2008) for Holstein herds in Brazil and by van der Laak et al. (Reference van der Laak, van Pelt, de Jong and Mulder2016) for herds in Netherlands. However, higher FY heritability has been reported elsewhere for Holstein cattle. For instance, Do et al. (Reference Do, Fleming, Schenkel, Miglior, Zhao and Ibeagha-Awemu2018) reported FY heritability of up to 0.39 for Holstein herds in Canada.
Regions with 17.5 °C and 19 °C presented lower environmental variance, which may contribute to higher heritability (Table 2). In these regions, there are several dairy farms with similar breeding systems, higher investment and higher breeding control, which might lead to lower environmental variance when compared with those in the remaining regions, which have higher diversity in terms of production. Another observation was an increase, although marginal, in heritability with increase in temperature.
PY heritability was mostly low-moderate, varying between 0.14 and 0.20, indicating a high influence of environmental factors on its expression. The difference between the heritability magnitudes could reflect differences in selection response, since low heritabilities result in greater environmental effects on the trait of interest. In the genetic selection process, this trait could have slower genetics gain in the region with low heritability than in regions of moderate heritability. Similar values have been reported by Montaldo et al. (Reference Montaldo, Pelcastre-Cruz, Castillo-Juárez, Ruiz-López and Miglior2017) and Tullo et al. (Reference Tullo, Frigo, Rossoni, Finocchiaro, Serra, Rizzi, Samorè, Canavesi, Strillacci, Prinsen and Bagnato2014) for herds of Holstein cattle in Mexico and Italy, respectively. This indicates that temperature has a negative effect on PY heritability, which is consistent with that reported by Carabaño et al. (Reference Carabaño, Bachagha, Ramón and Díaz2014) for herds in Spain. This reflects a decrease in genetic variance, indicating that superior bulls are found in more southern regions in the state, where there are higher incentives for PY by cooperatives.
No relevant GEI were observed for both traits, following Robertson (Reference Robertson1959) criteria. This indicates that both traits are being similarly expressed across the environments with no pertinent genetic differences in genotype expression. Large differences in latitude (Ismael et al., Reference Ismael, Strandberg, Berglund, Kargo, Fogh and Løvendahl2016) and higher temperature variations for longer periods (Bohmanova et al., Reference Bohmanova, Misztal, Tsuruta, Norman and Lawlor2008) might significantly affect the GEI, but these factors were not common in southern Brazil, in spite of its climatic variations (Moreira et al., Reference Moreira, Pinto, Valloto and Pedrosa2018). However, even in the absence of relevant GEI, small changes in breeding values between bulls were observed with increase in temperature for both traits. These are considered adaptive systemic responses, through enzymatic and hormonal mechanisms, of the animals to the environment, resulting in changes in the genetic behavior with increase in temperature (Dingemanse and Wolf, Reference Dingemanse and Wolf2013).
For FY, the breeding values tended to become closer and to increase with at higher temperatures, with greater differences between bulls being observed in regions with approximately 17 °C (Fig. 2A). This indicates that the average difference between the daughters of a given bull tended to be higher in regions with approximately 17 °C than in regions with approximately 19.5 °C, where the genetic divergence between bulls was relatively lower. Robust and plastic behaviors were observed among the animals, showing different adaptations of the animals to temperature, and that different genotypes respond differently to the same conditions (Aubin-Horth and Renn, Reference Aubin-Horth and Renn2009). Cases of robust bulls for FY were bulls B, D, and O, which presented lower breeding value variation with increase in temperature, and plastic bulls for FY were bulls C, E, I, and N, which presented higher breeding value variation than that of the remaining bulls evaluated. Plastic animals should be used with greater care due to higher variation in genotype expression among different environments.
Regarding the ranking of bulls for FY, there were few changes in ranking within the evaluation. The most relevant reranking was that of bull I, which was ranked the 10th best sire at 17 °C and 8th at 19.5 °C, a difference of two ranking positions between environments. Changes in ranking between bulls due to different responses to increasing regional temperature were observed, especially for those with similar breeding value at 17 °C. For example, between bulls C and D, and bulls L and M. FY expression was more affected by temperature in bulls C and M, leading to their rank switching at 19.5 °C with bulls D and L, respectively, which were less affected by the increase in regional temperature. Rank switching between bulls G, H, I, J, and K, which responded differently to temperature variations, was also highlighted. Bulls H and K were more robust for this trait, presenting smaller changes in their performance than bulls G, I, and J, which were more affected by the increase in temperature. It is noteworthy that the case of bull N, whose breeding value was strongly affected, was ranked lowest at 19.5 °C.
Similar to FY, an overall approximation of breeding values with increase in regional temperature was also observed for PY, resulting in lower genetic differences between bulls at 19.5 °C than at 17 °C (Fig. 2B). However, unlike that observed for FY, there was considerable reranking for some bulls with increase in temperature. Bull F, which was ranked fifth for PY breeding value at 17 °C was ranked third at 19.5 °C, and bull L ranked 10th at 17 °C and was reranked 14th at 19.5 °C. These changes are associated with plastic responses of the individuals to increase in temperature. The large variation in genetic response to the effect of temperature affected the ranking of bulls and their ranking as sires.
In spite of these cases, the reranking of bulls for both traits can be considered minimal. Considerable changes could be expected if the effects of the GEI were significant (Pegolo et al., Reference Pegolo, Albuquerque, Lôbo and de Oliveira2011), but this was not observed for any of the traits evaluated in the present study. In addition, environmental factors with significant effects on the genetics of dairy cattle, within a given region, are rarely quantified (Kolmodin and Bijma, Reference Kolmodin and Bijma2004), even when there is relative difference in temperatures and climates, as observed in the present study in southern Brazil.
In conclusion, no relevant GEI were observed for FY and PY of milk from Holstein cattle in response to increasing regional temperature in southern Brazil. Heritability of both traits varied marginally with increase in regional temperature, with no pertinent differences. No inclusion of the temperature effect in the model of genetic evaluation of fat and protein yields is required, considering the present model adopted adequate for the estimation of genetic parameters and breeding values of the Holstein breed in southern Brazil.
Acknowledgments
The authors thank the Paraná Holstein Breeders Association (APCBRH) for providing the pedigree and phenotypic data. National Council for Scientific and Technological Development (CNPq), National Council for the Improvement of Higher Education (CAPES) and Araucária Foundation (Fundação Araucária) are acknowledged for granting the scholarships and the funds to develop this research.