Introduction
The terms auditory neuropathy and auditory dys-synchrony refer to a hearing disorder in which cochlear amplification function (involving the outer hair cells) is normal but neural conduction in the auditory pathway is disordered.Reference Starr, Picton, Sininger, Hood and Berlin1 Clinically, individuals with auditory dys-synchrony show absent or severely abnormal auditory brainstem responses in conjunction with normal results for otoacoustic emissions and/or cochlear microphonics. The prevalence of auditory dys-synchrony has been estimated at approximately 0.54 per cent in individuals with sensory hearing loss.Reference Kumar and Jayaram2 Advances in the accurate measurement of outer hair cell functioning have made it easier to identify this disorder. Persons with auditory dys-synchrony generally show poor speech perception and derive only limited benefit from hearing aids.
In a series of experiments, we have investigated speech perception in individuals with auditory dys-synchrony by lengthening several short duration temporal events such as transition duration, voice onset time and burst duration for stop consonants. The present paper reports the effect of modification of voice onset time, burst duration and combined modification of all three temporal parameters (voice on set time, burst and transition). The effects of lengthened transition duration upon speech perception have been previously presented.Reference Kumar and Jayaram3
Individuals with auditory dys-synchrony show marked deficits in processing temporal (i.e. time-based) auditory information, but have relatively good processing of auditory intensity and frequency information.Reference Rance, McKay and Grayden4 It is now well established that the speech identification problems of individuals with auditory dys-synchrony are disproportionate to their degree of hearing loss.Reference Starr, Picton, Sininger, Hood and Berlin1 Previous studies on the speech perception and psychophysical abilities of individuals with auditory dys-synchrony have suggested that processing of temporal events is markedly affected. In fact, there is reasonable evidence to suggest that individuals with auditory dys-synchrony find it more difficult to perceive short duration dynamic sounds than long duration steady sounds.Reference Kumar and Jayaram3, Reference Kraus, Bradlow, Cheatham, Cunningham, King and Koch5, Reference Zeng, Kong, Michalewski and Starr6
Persons with cochlear hearing loss derive significant benefit from hearing aids which employ nonlinear compression circuits. All such hearing aids assume abnormal functioning of the outer hair cells. These hearing aids do not change the temporal parameters of speech sound (using linear amplification) or reduce fluctuations when a non-linear amplitude-compression circuit is employed.Reference Plomp7 Hence, these aids are seldom of benefit to individuals with auditory dys-synchrony, who have normal outer hair cell functioning.Reference Berlin, Hood, Hurely and Wen8 More comprehensive information on the perception of short duration temporal information in speech in individuals with auditory dys-synchrony may assist the development of hearing aids that facilitate processing of time-based events.
Speech contains many short-duration temporal elements which are important for its perception. Zeng et al. reported a strong relationship between gap detection threshold and speech perception abilities in individuals with auditory dys-synchrony.Reference Zeng, Oba, Garde, Sininger and Starr9 Gap detection ability has been associated with the discrimination of syllables that vary in voice onset time.Reference Dreschler and Plomp10, Reference Tyler, Summerfield, Wood and Farnandes11 It can be inferred from these observations that some of the speech perception difficulties faced by individuals are due to their inability to perceive cues such as voice onset time, consonantal burst and transition. Furthermore, individuals with auditory dys-synchrony have difficulty in processing short duration signals, more so in the presence of noise. Zeng et al. demonstrated forward and backward masking effects that are three to four times larger in subjects with auditory dys-synchrony than in normal listeners.Reference Zeng, Kong, Michalewski and Starr6 These observations together suggest that the vowel portion following and preceding the voice onset time or consonantal burst might mask (forward or backward as the case may be) short durational cues such as voice onset time and burst. It is plausible that increasing the duration of voice onset time and burst would reduce such masking effects, which in turn may facilitate better processing of speech in persons with auditory dys-synchrony.
Keeping this logic in mind, as a part of a larger research project, the present authors investigated the influence of short duration temporal parameters on speech perception in individuals with auditory dys-synchrony. A previous paperReference Kumar and Jayaram3 reported the effects of lengthening of transition duration of stop consonants on speech perception. The purpose of the present study was to assess the effect of voice onset time and burst duration modification on speech perception in individuals with auditory dys-synchrony. The specific aims of the present study were: (1) to measure the ‘just-noticeable difference' in speech segment voice onset time and burst duration, using stop consonants, in individuals with auditory dys-synchrony, (2) to investigate the effect of lengthened speech segment voice onset time and burst duration upon the speech perception of such individuals, and (3) to analyse the effect of combined modification of voice onset time, burst duration and transition duration on speech perception.
Methods
Participants
Participants from our earlier study also participated in the present series of experiments. Briefly, two groups of individuals participated.Reference Kumar and Jayaram3
The experimental group consisted of 30 participants (19 males and 11 females) with auditory dys-synchrony, aged between 16 and 30 years (mean age, 22.4 years). All individuals in this group were recruited from the audiology department of the All India Institute of Speech and Hearing, Mysore, India, and had an audiological profile typical of auditory dys-synchrony.Reference Starr, Picton, Sininger, Hood and Berlin1 All these individuals had absent auditory brainstem responses, middle-ear muscle reflexes and contralateral inhibition of otoacoustic emissions. However, otoacoustic emissions and/or cochlear microphonics were present in all the participants. Of the 30 participants, 25 had developed symptoms of auditory dys-synchrony between 16 and 20 years of age, 3 between 22 and 24 years, and the remaining 2 at 25 years. No specific aetiology could be identified in most of these participants. Two participants reported that the problem had started after they gave birth to their first child. Prior to study selection, all the auditory dys-synchrony group subjects underwent an ENT examination in order to exclude any external or middle-ear problems. Similarly, all these participants underwent a neurological examination performed by a qualified neurologist to exclude any peripheral neuropathy or space-occupying lesion. In addition, all these individuals had observed, clinically normal speech and language.
The second, control group consisted of 30 age- and gender-matched normally hearing participants.
Experiment I: ‘just-noticeable difference' for voice onset time and burst duration
In the present study, the short-duration speech cues of voice onset time and burst were lengthened by intervals equating to the just-noticeable difference, i.e. the minimum change in stimulus that could be detected. It was hypothesised that lengthening short duration cues such as voice onset time or burst, within a consonant-vowel syllable, by multiples of their just-noticeable difference would change subjects' perception of these consonant-vowel syllables.
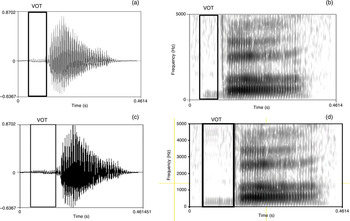
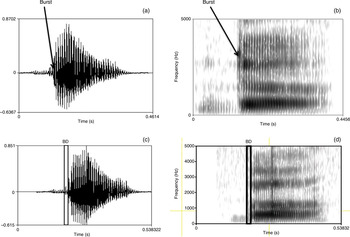
The method of the current study was the same as that of our previously published study, including the speech material used and the digital recording of consonant-vowel syllables.Reference Kumar and Jayaram3 The study used consonant-vowel syllables comprising voiceless stop consonants (i.e. velar /k/, alveolar /t/, retroflex /t/ and bilabial /p/) and their voiced cognates. These consonants were paired with the vowel /a/ to obtain consonant-vowel syllables. A 25-year-old, male, native Kannada speaker spoke each of these syllables in turn. The spoken syllables were digitally recorded on a data acquisition system with a 32-bit analogue to digital converter, at a sampling frequency of 44.1 kHz. The syllables thus recorded were edited using Praat software (version 4.2.31; University of Amsterdam, Amsterdam, The Netherlands). Both waveform and spectrogram analysis of speech syllables were used to identify the voice onset time and the burst. Voice onset time and burst duration were lengthened in 5-millisecond steps by means of the ‘Pitch Synchronised Overlap and Add' technique. This technique allows lengthening and shortening of the stimulus duration without affecting its physical characteristics such as spectral shape, amplitude distribution and periodicity.Reference Moulines and Lorche12 It was difficult to accurately segment natural speech. Identification of voice onset time was confirmed as follows: voice onset time, in voiced consonants, was identified as voicing pulses on the spectrogram or periodic pitch pulses on the waveform before the short duration broadband burst. In voiceless consonants, voice onset time was defined as the silent or low energy region between the release of the burst and the start of voicing pulses. Burst, in voiced consonants, was identified as the short, broad-frequency pulse appearing soon after the cessation of the voicing pulses of voice onset time. In voiceless consonants, burst was identified as the first spike in the stimulus waveform or the broad band frequency pulse in the spectrogram. Figure 1 shows waveform and spectrogram outputs for the stimulus /ba/, both unmodified and with voice onset time lengthened. Figure 2 shows the waveform and spectrogram of the unmodified and modified syllable /ba/ (burst duration lengthened).
Outputs for the stimulus /ba/, showing (a) waveform and (b) spectrogram of natural speech, with voice onset time identified (dark rectangle), and (c) waveform and (d) spectrogram of the same stimulus with lengthened voice onset time (dark rectangle).

Outputs for the stimulus /ba/, showing (a) waveform and (b) spectrogram of natural speech, with burst duration identified (arrow), and (c) waveform and (d) spectrogram of the same stimulus with lengthened burst duration (dark rectangle).

Procedure
Our previous publication gives details of the measurement of just-noticeable differences, including the instruments used, presentation levels and calibration procedures.Reference Kumar and Jayaram3 Briefly, both the unmodified (natural) and the modified speech syllables were presented in turn through a loudspeaker placed at an angle of 0° azimuth to and 1 m away from the participant. The presentation level of the signals was kept constant at 40 dB SL (reference: average of thresholds at 0.5, 1 and 2 kHz). Participants were tested individually in a sound-attenuated room. Signals were fed through a personal computer, at a sampling frequency of 44.1 kHz, to a clinical audiometer (Maico MA-53; Maico, Berlin, Germany). Participants received the signals through a loudspeaker connected to the audiometer. The just-noticeable difference was determined using Parameter Estimation through Sequential Testing (PEST), an adaptive tracking technique, utilising the AX same-difference discrimination paradigm. The subject's just-noticeable difference was calculated from the difference in voice onset time (or burst duration) between the anchor and the variable stimulus which was required to achieve 69 per cent correct response. Test trials included an equal number of catch trials. Catch trials consisted of either two identical anchor or two identical non-anchor stimuli. Both participant groups (auditory dys-synchrony and normally hearing) participated in this experiment.
Experiment II: speech identification testing
Speech identification scores were obtained for unedited natural stimuli, for both individuals with auditory dys-synchrony and normally hearing participants. The procedure for measurement of speech identification was as previously described.Reference Kumar and Jayaram3 Ten repetitions of each of the eight unmodified experimental stimuli were randomly presented and speech identification scores noted. Stimuli were presented at a sampling frequency of 44.1 kHz by a personal computer connected to a calibrated clinical audiometer (Maico MA-53). Participants received the stimuli through a loudspeaker connected to the audiometer. The loudspeaker was positioned at a distance of 1 m and at 0° azimuth. The presentation level was kept constant at 40 dB SL (reference: average threshold at 0.5, 1 and 2 kHz) for all participants.
Speech identification scores for speech syllables with modified voice onset time and burst duration were obtained for participants with auditory dys-synchrony. The voice onset time was lengthened by intervals equivalent to one, two, three or four just-noticeable differences, as required (using Praat software). Speech identification scores for modified stimuli were obtained only for those sounds which had not been identified in their natural (unedited) condition. The procedure for testing speech identification using stimuli with lengthened voice onset time and burst duration was as previously described for stimuli with modified transition duration.Reference Kumar and Jayaram3 Briefly, the procedure was as follows. Four tokens were generated. The first token was a /pa/ stimulus in which the voice onset time had been lengthened by one just-noticeable difference, as per normally hearing listeners. Similarly, three more tokens were generated with voice onset time lengthened by two, three or four just-noticeable differences. Each token was presented 10 times. The presentation stopped at the level at which the subject identified the correct sound or the sound which elicited the closest response as determined by a feature analysis. Feature analysis to determine the closest response to the target sound considered voicing and place of articulation information. A similar procedure was followed for speech stimuli with modified burst duration. The order of presentation of speech sounds was randomised to minimise any practice effect.
Speech identification scores for speech syllables containing modifications to all three temporal parameters (i.e. voice onset time, burst duration and transition duration) were obtained for all participants with auditory dys-synchrony.Reference Kumar and Jayaram3 The purpose of this experiment was to determine speech identification scores for stimuli which had the optimal values for voice onset time, burst duration and transition duration, as determined from previous experiments. A synthetic token was generated for each of the eight consonant-vowel syllables, wherein the voice onset time, burst duration and transition duration corresponded to the values which resulted in the best identification of the target stimulus in each case. The procedure, test environment, instrumentation and presentation level were the same as in Experiment I.
Results
Experiment I
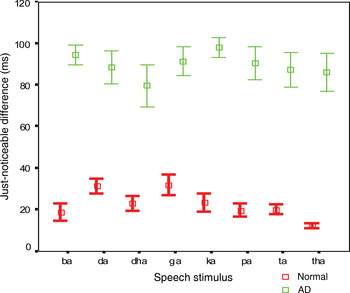
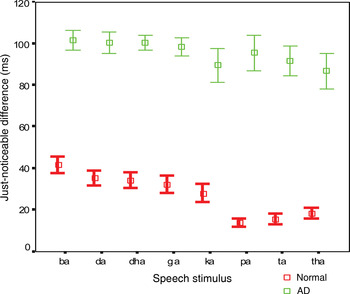
Repeated measures analysis of variance (ANOVA) revealed a highly significant difference between the just-noticeable differences of normal hearing participants and participants with auditory dys-synchrony, both for unmodified voice onset time (ANOVA F ratio (1, 63) = 2191; p < 0.01) and unmodified burst duration (ANOVA F ratio (1, 63) = 1389; p < 0.01). The independent sample t-test was carried out separately to assess the significance of differences between the just-noticeable difference for each speech sound, comparing the two study groups. Results revealed a significant difference between the two groups as regards just-noticeable differences, for all speech sounds. Figure 3 shows the means and 95 per cent confidence intervals of just-noticeable differences for burst duration, while Figure 4 shows the same information for voice onset time.
Just-noticeable differences for unmodified burst duration in the two study groups, for each of the eight consonant-vowel syllables. Error bars show 95% confidence intervals. AD = auditory dys-synchrony

Just-noticeable differences for unmodified voice onset time for the two study groups, for each of the eight consonant-vowel syllables. Error bars show 95% confidence intervals. AD = auditory dys-synchrony

Experiment II: modified speech stimuli in isolation
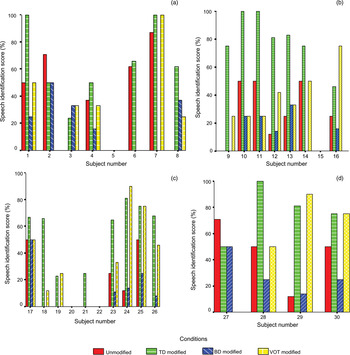
Figure 5 shows speech identification scores for consonant-vowel syllables with modified burst duration or modified voice onset time. Speech identification scores for speech syllables presented unmodified or with lengthened transition duration (previously published results) are given for comparison.Reference Kumar and Jayaram3 Speech identification scores ranged between 0 and 100 per cent for syllables with lengthened voice onset time and between 0 and 50 per cent for syllables with lengthened burst duration. Voice onset time modification enabled a speech identification score of 100 per cent in one participant, and a score of more than 50 per cent in a total of six participants. Two participants in the auditory dys-synchrony group (numbers 2 and 27) had better speech identification scores for unmodified stimuli than for modified stimuli.
Speech identification scores for consonant-vowel syllables presented unmodified or with modified transition duration (TD), modified burst duration (BD) or modified voice onset time (VOT), for individually numbered subjects with auditory dys-synchrony: (a) subjects 1 to 8; (b) 9 to 16; (c) 17 to 26; and (d) 27 to 30.

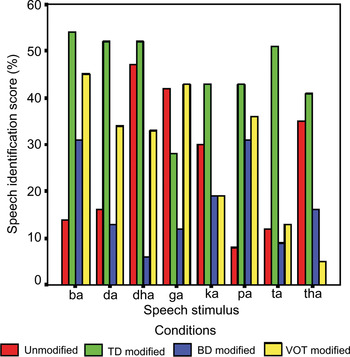
Figure 6 shows mean speech identification scores for the eight test consonant-vowel syllables, presented unmodified or with modified burst duration, modified voice onset duration or modified transition duration (results for unmodified and transition duration modified syllables are as previously published).Reference Kumar and Jayaram3 It can be seen that lengthening the transition duration resulted in the best speech identification score for all syllables except for /ga/. Lengthening of voice onset time resulted in the best speech identification score for the syllable /ga/. Lengthening of transition duration resulted in speech identification scores of greater than 50 per cent for all other speech sounds except for /ka/, /pa/ and /tha/.
Mean speech identification scores for the eight consonant-vowel syllables presented unmodified or with modified transition duration (TD), modified burst duration (BD) or modified voice onset time (VOT), for subjects with auditory dys-synchrony.

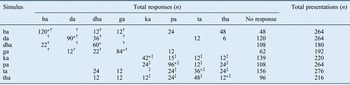
Table I shows a group stimulus-response matrix for lengthened voice onset time stimuli. Only data from the modification that resulted in near-normal perception of the consonant-vowel syllable are given. Lengthening of voice onset time resulted in a decrease in ‘across-category’ (voicing) confusions, compared with ‘within-category’ confusions. For example, /ka/ was confused with other unvoiced sounds such as /pa/, /ta/ and /tha/, but never with any voiced sound. In Table I, regions of within-category confusion for voiced and for unvoiced sounds are indicated by dagger and double-dagger citation symbols, respectively. It was also observed that: (1) there were some instances of voiced sounds being identified as unvoiced sounds, and (2) correct identification of the syllables /ta/, /tha/ and /ka/ was poorer than identification of other consonant-vowel syllables.
Stimulus-response matrix for speech stimuli with modified voice onset time

*Correct responses. †‘Within category' confusion for voiced sounds; ‡‘within category' confusion for unvoiced sounds. Lengthening of voice onset time decreased ‘across category’ (voicing) confusion, compared with ‘within category’ confusion.
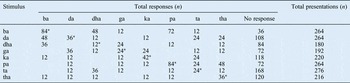
Table II shows a group stimulus-response matrix for lengthened burst duration stimuli. Lengthening of the burst duration improved participants' identification only for the syllables /ba/ and /pa/, compared with unmodified stimuli. However, the frequency of correct identification did not exceed 50 per cent for even these two syllables.
Stimulus-response matrix for speech stimuli with modified burst duration

*Correct responses.
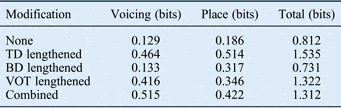
A sequential information transfer analysis was performed on group data for each experimental condition, in order to assess the amount of information transfer from stimulus to response for a set of phonetic features.Reference Wang and Bilger13 This analysis was performed using the Feature Information Xfer software developed by the linguistics department of the University College of London, UK. In this procedure, features go through a number of iterations. There were two iterations in the present study. The first iteration followed the procedure for information transmission analysis described by Miller and Nicely, wherein information transmitted for each feature is calculated.Reference Miller and Nicely14 In subsequent iterations, the feature with the highest percentage of information transmitted in the previous iteration is held constant and is partialled out. Thus, sequential information transfer analysis helps to estimate the redundancy of a specific feature as regards its contribution to the perception of monosyllables. This analysis was carried out on the group confusion matrices shown in Tables I and II. Results showed that modification of voice onset time resulted in better transmission of voicing information, compared with place information. The total information transmitted with modification of voice onset time equated to 1.322 bits; for modification of burst duration, this parameter was 0.731 bits (Table III).
Speech information transmitted for each modification

TD = transition duration; BD = burst duration; VOT = voice onset time
Experiment II: combined modification of speech stimuli
In this part of experiment II, speech identification testing was done with consonant-vowel syllables which had been modified to incorporate the just-noticeable differences for transition duration, burst duration and voice onset time which had individually elicited the highest speech identification score in the previous part of the experiment.
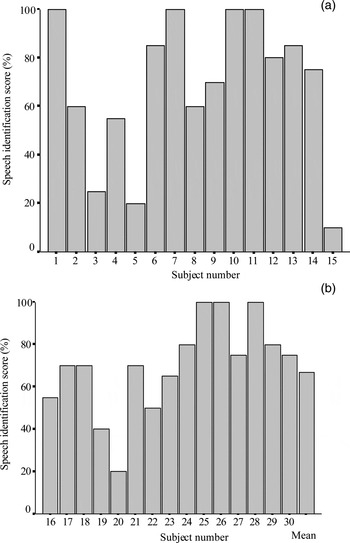
Figure 7(a) and 7(b) show each participant's speech identification score for these combined modification stimuli. Scores ranged from 0 to 100 per cent. Generally, lengthening of all the three temporal parameters improved participants' speech identification scores. However, one participant (participant two of the auditory dys-synchrony group) obtained a poorer score for combined modification stimuli than for unmodified stimuli. In 16 participants, speech identification scores for the combined modification stimuli were the same as those obtained for stimuli with lengthening of only the transition duration. Nine participants obtained a higher speech identification score for the combined modification stimuli than for the transition duration lengthened stimuli.
Speech identification scores of individual subjects for combined modification stimuli: (a) subjects 1 to 15; and (b) subjects 16 to 30 plus mean group score.

A repeated measure ANOVA test was performed to assess the statistical significance of the differences in mean speech identification scores across the five speech stimuli states (i.e. unmodified, transition duration modified, burst duration modified, voice onset time modified and combined modification). Results indicated that the main effect of stimulus modification on speech identification scores was statistically significant (ANOVA F ratio (4, 132) = 33.89; p < 0.05). Application of Bonferroni's post hoc test indicated that transition duration modified stimuli and combined modification stimuli were associated with significantly higher speech identification scores than stimuli with other modifications. In many participants, combined modification stimuli resulted in higher speech identification scores than transition duration modified stimuli, but the group effect was not statistically significant.
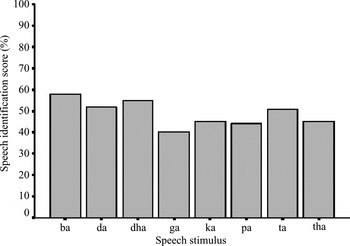
Figure 8 shows participants' mean speech identification score for each consonant-vowel syllable containing combined modifications, namely, lengthening of the transition duration, burst duration and voice onset time. It can be seen that the syllables /ba/, /da/, /dha/ and /ta/ were correctly identified more than 50 per cent of the time. The mean identification score for the syllable /ga/ was the lowest of all the syllables.
Subjects' mean speech identification scores for combined modification stimuli.

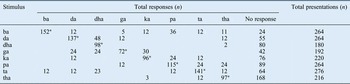
A group stimulus-response matrix for participants' total responses to combined modification stimuli (Table IV) indicated that such modification increased the total number of correct responses, compared with transition duration alone. However, confusion between syllables remained at the same level as when stimuli were modified for transition duration alone.
Stimulus-response matrix for optimally modified speech stimuli

*Correct responses.
Sequential information transfer functional analysis was carried out on the stimulus response-matrix shown in Table IV, and the results are shown in Table III. Values obtained for unmodified stimuli, transition duration modified stimuli (from our previous study), burst duration modified stimuli and voice onset time modified stimuli are also given for comparison. Results indicate that speech stimuli incorporating combined modification (i.e. modification of all three temporal parameters) did not lead to better speech information transfer than stimuli incorporating modified transition duration alone. Furthermore, the information transfer resulting from combined modification stimuli was almost identical to that from stimuli incorporating modified voice onset time alone. Thus, modification of transition duration resulted in the best speech identification, compared with the other three modification states tested. However, Figure 5 suggests that the combined modification stimuli resulted in higher speech identification scores, compared with stimuli in which only one temporal event had been modified.
Discussion
The main findings of this study were as follows. (1) Participants with auditory dys-synchrony showed deficits in processing temporal information, as evident in large just-noticeable differences for voice onset time and burst duration. (2) Lengthening of voice onset time resulted in improved perception of voicing features. (3) Lengthening of burst duration did not significantly improve speech perception. (4) The use of combined modification stimuli (i.e. stimuli modified to incorporate the optimal just-noticeable differences for transition duration, burst duration and voice onset time) improved speech perception, but not as much as stimuli incorporating lengthened transition duration alone (comparator results obtained from our previous study).Reference Kumar and Jayaram3
Presentation of data in a response-matrix matrix, together with sequential information transfer functional analysis, showed that lengthening of transition duration resulted in maximum speech information transfer. However, the results of the latter analysis should be interpreted with caution. Sequential information transfer functional analysis is a robust technique when stimuli occur with equal frequency. However, in the present study, the number of stimuli was slightly different for different speech sounds, depending on whether or not they were identified in the unmodified condition. Obviously, speech syllables which were identified in the unmodified condition were not included in subsequent experiments. This limitation should be kept in mind while interpreting the sequential information transfer functional analysis results.
It has been shown that individuals with auditory dys-synchrony have difficulty in processing short duration sounds.Reference Kraus, Bradlow, Cheatham, Cunningham, King and Koch5, Reference Zeng, Kong, Michalewski and Starr6 In our previous study, lengthening of transition duration improved participants' perception of both place and voicing information.Reference Kumar and Jayaram3 Lengthening of voice onset time appears to be a better cue for voicing than place of articulation. One of the prominent psycho-acoustic characteristics of individuals with auditory dys-synchrony is an elevated gap detection threshold, which is known to contribute to poor speech perception in such persons.Reference Zeng, Oba, Garde, Sininger and Starr9 Gap detection ability is also known to be associated with discrimination of syllables that vary in voice onset time.Reference Dreschler and Plomp10, Reference Tyler, Summerfield, Wood and Farnandes11 It may be inferred from these observations that some of the voicing perception difficulties experienced by individuals with auditory dys-synchrony may be due to their inability to perceive short duration voice onset time. In such individuals, lengthening of voice onset time may make this acoustic cue more salient, facilitating voicing perception.
Furthermore, individuals with auditory dys-synchrony have difficulty in processing short duration signals, more so in the presence of noise. The observed improvement in speech stimuli identification with lengthening of voice onset time may also be due to a reduction in the forward or backward masking effects (as previously noted, although not tested in the present study).Reference Zeng, Kong, Michalewski and Starr6 In the current study, we hypothesised that as voicing (i.e. voice onset time) was a distinct physical phenomenon, lengthening it would enhance speech perception considerably. Although lengthening of the voice onset time did improve identification of voicing and thus speech perception, there were other short speech elements, such as transition duration, the lengthening of which promoted better transfer of speech information (with better speech identification scores). Therefore, the observed result for voice onset time did not support our initial hypothesis.
• Patients with auditory dys-synchrony have longer ‘just-noticeable difference' times for voice onset time, burst duration and transition duration
• In this study, speech stimuli with longer transition durations were better identified by such patients
• This information may facilitate better hearing aid design for such patients
Lengthening of all the three temporal events (transition duration, burst duration and voice onset time) improved perception of all the speech syllables tested, by a proportion ranging from 40 to 58 per cent. However, lengthening transition duration alone had a greater effect on speech identification score than modification of any other temporal event. This information should significantly assist hearing aid designers in deciding on amplification strategies for individuals with auditory dys-synchrony.
Lengthening of burst did not significantly improve speech identification scores in the present study. The results of past research on the contribution of burst information to speech identification are equivocal. Dorman et al. reported that burst and transitions are equivalent and complementary in their contribution to the perception of consonant-vowel-consonant syllables involving labial, apical and velar consonants, but such contribution depends on the vowel following the consonant.Reference Dorman, Studdert-Kennedy and Raphael15 In general, these authors found that burst occurring before a central vowel was less effective as a cue, compared with burst before back-rounded vowels (with labial consonants), and that transition was more effective as a cue before all vowels in a similar consonant-vowel-consonant environment. Perhaps these findings explain the relatively poorer contribution of burst information (and the relatively greater contribution of transition duration) in the identification of consonant-vowel syllables, as we combined consonants with a central vowel in the present study. As burst is a poor cue in the context of central vowels, lengthening it did not have any significant effect on speech identification.
The results of our present study and previous research consistently indicate that individuals with auditory dys-synchrony have higher just-noticeable differences for transition duration as well as for voice onset time and burst.Reference Kumar and Jayaram3 The diagnostic utility of these observations in identifying individuals with auditory dys-synchrony needs to be established by obtaining similar information from individuals with cochlear hearing loss.