I. INTRODUCTION
The Ag–Cu eutectic alloy with 28Cu (wt%) is frequently used in the conventional brazing of Ti alloys and other materials at temperatures higher than 800 °C. Reference Dezellus, Andrieux, Bosslet, Sacerdote-Peronnet, Baffie, Hodaj, Eustathopoulos and Viala1 The brazed assembly exhibits good bonding strength, resulting from the formation of Ti–Cu compounds that enhance the wettability of the solid/liquid interface. Reference Shiue, Wu, Chen and Yang2,Reference Liu, Ou and Shiue3 However, Sn, Ag, Cu, Ni, Co, and Fe exhibit very poor wettability on the surface of ceramics. Reference Sotiropoulou and Nikolopoulos4 The wettability can be significantly improved by adding active metals, such as Ti, Zr, and Hf, to the brazing filler. These metals can effectively reduce the interfacial energy by their strong chemical attraction to the oxide ceramic and can enhance the wetting behavior, Reference Kingery, Bowen and Uhlmann5 which even enables the surface of the ceramic to be wetted by the formation of the intermediate layer during brazing and provides a good joint. Reference Guedes, Pinto, Vieira and Viana6,Reference Hanson, Ironside and Fernie7
Hanson et al. Reference Hanson, Ironside and Fernie7 observed that a small percentage of Ti addition (∼4.5Ti wt%) to the braze alloy led to a significant increase in the four-point bend strength of a PSZ–PSZ (PSZ, partially stabilized zirconia) joint. In comparison with PSZ–PSZ or PSZ-stainless steel joints, the 3Y–ZrO2/Ti brazing couple using a Cusil ABA [63Ag–35.25Cu–1.75Ti (wt%)] had a superior joint strength due to the suitable reaction layers at the interface. The microstructural evolution at the interface between the Ti alloy (or ZrO2) and braze alloy has been previously explored based on microstructural characterization using scanning electron microscopy (SEM)/energy dispersive spectroscopy (EDS). Reference Dezellus, Andrieux, Bosslet, Sacerdote-Peronnet, Baffie, Hodaj, Eustathopoulos and Viala1–Reference Liu, Ou and Shiue3,Reference Guedes, Pinto, Vieira and Viana6,Reference Chan, Liaw and Shiue8 However, the SEM/EDS spatial resolution was limited to the micro range (<2 μm) and unable to analyze the crystal structures. In this study, the braze filler of Ticusil [68.8Ag–26.7Cu–4.5Ti (wt%)] was selected to join the 3Y–ZrO2 and Ti at 900 °C for various brazing periods. The objective was to elucidate the microstructural evolution and bonding mechanisms of the sandwiched Ti/Ticusil/3Y–ZrO2 joints based on the microstructural characterization using SEM/EDS and transmission electron microscopy (TEM)/EDS.
II. EXPERIMENTAL
Hot pressed 3 mol% Y2O3-stabilized ZrO2 bulks [3Y–ZrO2, 3 mm thickness on average, with an apparent density of 5.9 g/cm3, mainly >94ZrO2 + HfO2, <5.4Y2O3 (wt%), Toyo Soda Mfg. Co., Tokyo, Japan] and commercially pure titanium billets [cp-Ti, 5 mm thickness on average, mainly 99.31Ti–0.30Fe–0.25O (wt%), Kobe Steel, Ltd., Tokyo, Japan] were used as starting materials. The 3Y–ZrO2 and Ti were brazed by a Ticusil interlayer [50 µm thick, 68.8Ag–26.7Cu–4.5Ti (wt%), Wesgo, Inc., Belmont, CA] under 0.1 MPa at 900 °C for 0.1, 1, and 6 h in a tube furnace (Model STF54434C, Lindberg/Blue, Thermo Elec. Inc., TX). The process temperature (900 °C) was selected to be 70 °C above the eutectic point of the filler. To prevent the sample from being oxidized, the working chamber was preevacuated to 1 × 10⁻⁴ Pa and purged with Ar (99.99% pure) to 1 atm for at least four cycles. The heating and cooling rates were 5 and 3° C/min, respectively.
Cross-sectional SEM specimens were cut, ground, and finally polished using conventional standard procedures. Then the microstructures of various reaction zones were characterized using a SEM (Model JSM 6500F, JEOL Ltd., Tokyo, Japan) operating at 15 kV, which was equipped with an EDS (Model ISIS 300, Oxford Instrument Inc., London, U.K.). Cross-sectional TEM specimens were prepared using a focused ion beam (FIB, Model Nova 200, FEI Co., Hillsboro, OR) and the lift-out technique. Reference Wang, Kato, Sasaki, Hirayama and Saka9 Typical TEM specimens had dimensions of approximately 17 μm in width and 2 μm in depth. FIB milling was performed with a Ga+ ion beam at 30 keV. Before the FIB milling, a Pt layer approximately 1 μm thick was deposited by ion beam chemical deposition using C9H16Pt as the precursor gas. The Pt layer served two main purposes: being a marker illustrating the location and protecting the sample from being directly exposed to Ga+ ion beam implantation. After rough milling (7–1 nA), polishing (0.5–0.1 nA), and final polishing (50–10 pA), a thin foil (17 × 2 × 0.05 μm) was cut off, and then, a micromanipulator was used to transfer the foil from the sample to a TEM grid (Formvar/carbon coated-copper 200 mesh) for subsequent TEM analyses.
The interfacial microstructures of the jointed samples were then observed using an analytical TEM (Model JEM 2000 FX, JEOL Ltd, Tokyo, Japan). The Cliff–Lorimer standardless technique was performed to analyze the chemical compositions of various phases using an ultra-thin window energy dispersive spectrometer (EDS, ISIS 300, Oxford Instrument Inc., London, U.K.) attached to the TEM. Reference Cliff and Lorimer10,Reference Goldstein, Williams, Cliff, Joy, Romig and Goldstein11 Based on the thin-film criterion, assuming that the effects of absorption and fluorescence could be neglected, all the measurements were conducted on the K α lines of corresponding elements from the very thin regions of the TEM specimens. The standardless k factors in the Cliff–Lorimer equation had the same precision as the ones measured by the standard approach if the thin-film criterion of K α lines was fulfilled. Reference Goldstein, Williams, Cliff, Joy, Romig and Goldstein11 The crystal structures and lattice parameters were determined from analysis of the selected area diffraction patterns (SADPs) using the computer-simulation software of crystallography (CaRIne Crystallography 3.1, DIVERGENT S. A., Compiègne, France).
III. RESULTS AND DISCUSSION
A. SEM/EDS analyses
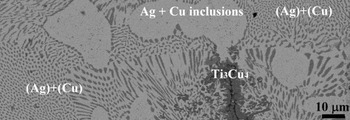
Figure 1 presents a backscattering electron image (BEI) of the as-received Ticusil foil after annealing at 900 °C for 1 h. The clumpy Ag-rich phase was observed in addition to the lamellar eutectic structure of (Ag) + (Cu) within the Ticusil foil. In addition, the Ti3Cu4 phase [42.5Ti–56.7Cu–0.8Ag (at.%)] was also observed. It was believed that the reactions between Ti and Cu pushed the Ag–Cu composition into the hypoeutectic region, resulting in the formation of a clumpy proeutectic Ag-rich phase and the lamellar eutectic. The eutectic lamellae consisted of the bright Ag-rich phase and the dark Cu-rich phase. Furthermore, because the solubility of Cu in Ag was limited, Reference Murray12 small spherical Cu-rich particles were precipitated from the Ag phase during subsequent cooling, which was consistent with the observations by Lin et al. Reference Lin, Singh and Asthana13
SEM BEI microstructure of the as-received Ticusil foil before joining and after annealing at 900 °C for 1 h, showing the Ag–Cu eutectic, Ti3Cu4 phase, and Ag solid phase with Cu inclusions.

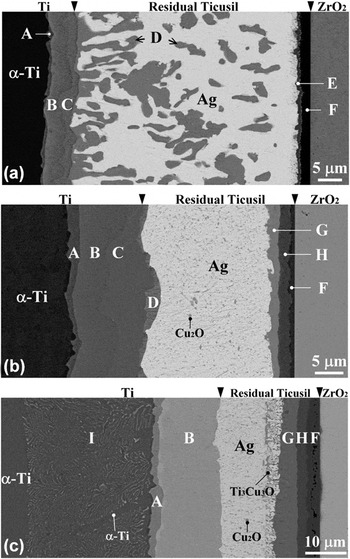
Figure 2 presents the BEIs of the interfacial microstructure in between Ti and Ticusil (or Ticusil and 3Y–ZrO2) after brazing at 900 °C for various brazing periods. The original Ti/Ticusil and Ticusil/3Y–ZrO2 interfaces were marked by arrows. The dissolution of the Ti substrate into the liquid interlayer was thought to be much more prominent compared with that of the 3Y–ZrO2 substrate. Figure 2(a) reveals the BEI of the Ti/Ticusil/3Y–ZrO2 joint after brazing at 900 °C for 0.1 h. Four distinct interfacial layers (marked A, B, C, and D) existed between Ti and Ticusil. The relative contrast of the interfacial layers reflected a decreasing Ti/Cu ratio from the left to right sides because of the atomic number effect on the BEI. The thinner layer A was tentatively identified as a Ti2Cu layer. Layer B consisted of 47.7Ti–48.6Cu–3.7Ag (at.%), indicating that layer B was TiCu. Layer C contained 41.4Ti–57.0Cu–1.6Ag (at.%) adjacent to the original interface between Ti and Ticusil, corresponding to the Ti3Cu4 phase. A dendritic TiCu4 phase (marked D), consisting of 21.3Ti–77.2Cu–1.5Ag (at.%), tended to grow into the residual interlayer. A clumpy phase (marked D, TiCu4) was observed together with the Ag solid phase within the residual interlayer. In addition, the reduction of 3Y–ZrO2 by the Ticusil interlayer Reference Hanson, Ironside and Fernie7,Reference Liu, Li, Qiao, Wang, Yang and Lu14 led to the formation of a dark layer (F), consisting of 49.3Ti–48.9O–1.8Cu (at.%), which corresponds to the TiO phase. The dissolved Ti reacted with Cu to form a relatively gray layer (marked E), corresponding to the TiCu phase, near the TiO layer in the residual interlayer. The TiO layer existed as a diffusion barrier layer that limited the migration of Zr into the residual interlayer. Reference Chang and Lin15 The consumption of Cu atoms due to the formation of various Ti–Cu compounds in the molten interlayer resulted in the deviation of the residual interlayer from the Ag–Cu eutectic toward the Ag-rich region. Reference Lee, Hong, Lee and Rhee16 Therefore, the Ag solid phase was observed throughout the residual interlayer after cooling. The Ag solid phase in the residual interlayer consisted of 94.4Ag–2.0Ti–3.6Cu (at.%) based on the EDS analyses. In this case, the yttrium (the stabilizer of ZrO2) was not detected in TiO, indicating that the original interface was located between TiO and 3Y–ZrO2. Figure 2(b) displays the reaction layer sequence of α-Ti/Ti2Cu(A)/TiCu(B)/Ti3Cu4(C)/TiCu4(D)/residual interlayer/Ti3Cu3O(G)/Ti2O(H)/TiO(F)/ZrO2−x in the Ti/Ticusil/3Y–ZrO2 joint after brazing at 900 °C for 1 h. The fact that layer Ti2Cu3 was missing between Ti3Cu4 and TiCu4 could be explained by kinetics considerations. Reference Andrieux, Dezellus, Bosselet, Sacerdote-Peronnet, Sigala, Chiriac and Viala17 The residual interlayer contained the Ag solid phase, with fine Cu2O precipitates replacing the clumpy TiCu4 phase. Two oxide layers (G and H) were observed to abut the TiO layer, indicating that an extensive reduction of ZrO2 to oxygen-deficient zirconia occurred due to the dissolved Ti in the molten interlayer. Furthermore, O exhibited a higher reactivity with Cu than Ag such that the Cu2O phase was formed in the Ag solid phase during cooling. According to the Ti–Cu–O ternary phase diagram, Reference Kelkar, Spear and Carim18 the Ti–Cu–O compound would be formed while exceeding the maximum solubility of O (∼2 at.%) in the TiCu. For comparison, the reaction zone between the Ag–Cu–Sn–Ti filler metal and Al2O3 was comprised of two sublayers after brazing at 900 °C for 20 min: an fcc γ-TiO layer and another sublayer of Ti3Cu3O with a diamond cubic structure, which provided a more reliable joint than TiO alone. Reference Santella, Horton and Pak19 Figure 2(c) illustrates the reaction layer sequence of α-Ti/α-Ti + Ti2Cu(I)/Ti2Cu(A)/TiCu(B)/residual interlayer/Ti3Cu3O(G)/Ti2O(H)/TiO(F)/ZrO2−x in the sandwiched joint after brazing at 900 °C for 6 h, where the Cu2O, Ti3Cu3O, and Ag phases were present in the residual interlayer. Cu diffusion from the interlayer to the Ti substrate led to the hypoeutectoid transformation of a two-phase layer (α-Ti + Ti2Cu), designated as I, during a long-term brazing period. Reference Lee and Aaronson20 The elongated α phase in the (α-Ti + Ti2Cu) region corresponded to a proeutectoid phase. The transformation could be written by two steps of the hypoeutectoid reaction: β-Ti → β1-Ti + α-Ti (proeutectoid α-Ti) and β1-Ti → Ti2Cu + α-Ti (eutectoid α-Ti). The formation Gibbs free energies (∆G 0) of Ti2Cu and TiCu were more negative than those of Ti3Cu4 and TiCu4. Reference Liang, Wang, Yang, Wang and Jiang21 Therefore, it was believed that a further reaction could occur between Ti3Cu4 (or TiCu4) and Ti to produce the more stable TiCu phase.
SEM BEI microstructure of the Ti/Ticusil/3Y–ZrO2 joint after brazing at 900 °C for (a) 0.1 h, (b) 1 h, and (c) 6 h, showing the reaction layers at the Ti/Ticusil interface [Ti2Cu (A), TiCu (B), Ti3Cu4 (C), TiCu4 (D), and α-Ti + Ti2Cu (I)], the reaction layers at the Ticusil/3Y–ZrO2 interface [TiCu (E), TiO (F), Ti3Cu3O (G), and Ti2O (H)], and the residual Ticusil interlayer [TiCu4 (D), Cu2O, Ti3Cu3O, and Ag-rich phase].

B. TEM/EDS analyses
1. Microstructure at the Ticusil/3Y–ZrO2 interface
Figure 3(a) presents a bright field image (BFI) of two suboxide layers, corresponding to TiO and Ti2O (labeled F and H) in the Ti/Ticusil/3Y–ZrO2 joint after brazing at 900 °C/1 h. Figures 3(b) and 3(c) display the SADPs of the β-TiO with the incident electron beam along the zone axes of
 $\left[ {001} \right]$
and
 $\left[ {111} \right]$
, respectively, indicating that the material had a cubic structure similar to the NaCl structure, with the measured lattice parameter a = 0.4234 nm (β-TiO, Fm3m, a = 0.4185 nm in JCPDS No. 772170).
Reference Hammerl, Renner, Rauschenbach and Assmann22
Note that the reflections should be absent due to the zero structure factor for such planes as (0
 $\bar 1$
0), (100), (10
 $\bar 1$
), and (1
 $\bar 1$
0) but appeared in the pattern due to double diffraction and the nonstoichiometric composition. Figures 3(d) and 3(e) present the SADPs of Ti2O on the zone axes of
 $\left[ {\bar 12\bar 10} \right]{\rm{ }}$
and
 $\left[ {\bar 24\bar 2\bar 3} \right]$
, respectively, identified as a hexagonal structure with the measured lattice parameters a = 0.2898 nm and c = 0.48765 nm (Ti2O, P
 $\bar 3$
m1, a = 0.2953 nm, c = 0.48454 nm in JCPDS No. 731582).
Reference Holmberg23
Figure 3(f) demonstrates that the β-TiO consisted of 49.65Ti–47.33O–1.76Zr–1.26Cu (at.%). Figure 3(g) presents the EDS results of Ti2O, indicating that the material consisted of 65.46Ti–30.3O–3.12Zr–1.12Cu (at.%).
TEM results of the microstructure: (a) morphology of β-TiO and Ti2O at the Ticusil/3Y–ZrO2 interface of the Ti/Ticusil/3Y–ZrO2 joint after brazing at 900 °C for 1 h; (b and c) electron diffraction patterns of β-TiO with the
 $\left[ {001} \right]$
and
 $\left[ {111} \right]$
zone axes, respectively; (d and e) electron diffraction patterns of Ti2O with the
 $\left[ {\bar 12\bar 10} \right]$
and
 $\left[ {\bar 24\bar 2\bar 3} \right]$
zone axes, respectively; (f) EDS spectrum of β-TiO; and (g) EDS spectrum of Ti2O.

ZrO2 tends to be reduced to an oxygen-deficient zirconia (ZrO2−x ) in a reducing environment. Reference Lin and Lin24 Because Ti has a high affinity for O, it can act as a reducing agent of ZrO2. When Ti is in contact with ZrO2, oxygen can diffuse out of ZrO2 and be dissolved in Ti, leading to the formation of ZrO2−x , even though the Ellingham diagram indicates that ZrO2 is more thermodynamically stable than TiO2. Thus, ZrO2 is not completely reduced into the metallic Zr, while Ti is not oxidized as TiO2 in the partial reduction and dissolution process mentioned above. However, certain titanium oxides are likely formed as the amount of dissolved oxygen increases in Ti. In this study, ZrO2 was partially reduced by Ti to become ZrO2−x , while oxygen was dissolved into the residual interlayer to form the intermediate compounds TiO, Ti2O, and Ti3Cu3O. The liquid Ticusil exhibited good wettability on the 3Y–ZrO2 surface due to the formation of TiO (metallic characteristics). Reference Pimenta, Buschinelli, do Nascimento, Martinelli and Remmel25
2. Microstructure at the residual Ticusil interlayer
Figure 4(a) presents a BFI of the Cu2O precipitate in the Ag-rich matrix within the residual interlayer after brazing at 900 °C for 1 h. The Ag-rich matrix was accompanied by dislocations because of the CTE (coefficient of thermal expansion) mismatch between Ticusil and 3Y–ZrO2. Figure 4(b) displays the SADPs of the Cu2O and Ag-rich phase with its schematic diagram redrawn in Fig. 4(c). From their superimposed SADPs, the orientation relations of Cu2O and Ag were identified as follows:
 $\left[ {111} \right]_{{\rm{Cu}}_{\rm{2}} {\rm{O}}} //\left[ {111} \right]_{{\rm{Ag}}}$
and
 $\left( {20\bar 2} \right)_{{\rm{Cu}}_{\rm{2}} {\rm{O}}} {\rm{//}}\left( {20\bar 2} \right)_{{\rm{Ag}}}$
. The lattice parameter of Cu2O was measured to be 0.4264 nm (Cu2O, Pn3m, a = 0.4267 nm in JCPDS No. 782076). Furthermore, the lattice parameter of fcc Ag was measured to be 0.4198 nm (Ag, Fm3m, a = 0.4086 nm in JCPDS No. 040783). The orientation relationship between these two phases was cube-on-cube. Because Cu2O is an antifluorite derivative with 4 Cu atoms at 0, 0, 0 + face-centering translations and 2 O atoms at 1/4, 1/4, 1/4 + body-centering translations,
Reference Soon, Todorova, Delley and Stampfl26
the (hkl) reflection spots were absent for two even and one odd integer.
TEM results of the microstructure: (a) morphology of the Cu2O precipitates in the Ag-rich matrix of the residual Ticusil interlayer after brazing at 900 °C for 1 h and (b and c) electron diffraction patterns of Cu2O and Ag with their schematic diagram (●, Cu2O and ×, Ag) showing
 $z = \left[ {111} \right]_{{\rm{Cu}}_{\rm{2}} {\rm{O}}} //\left[ {111} \right]_{{\rm{Ag}}}$
and
 $\left( {20\bar 2} \right)_{{\rm{Cu}}_{\rm{2}} {\rm{O}}} {\rm{//}}\left( {20\bar 2} \right)_{{\rm{Ag}}}$
.

3. Microstructure at the cp-Ti/Ticusil interlayer
Figures 5(a) and 5(b) display BFIs of the Ti/Ticusil interfacial microstructure after brazing at 900 °C/1 h, revealing several phases, such as α-Ti, Ti2Cu, TiCu, TiCu4, and the Ag-rich matrix. Figure 5(c) shows the SADP of Ti2Cu along the zone axis of
 $\left[ {010} \right]$
, corresponding to a tetragonal structure with the measured lattice parameters a = 0.2941 nm and c = 1.0779 nm (Ti2Cu, I4/mmm, a = 0.29438 nm, c = 1.07861 nm in JCPDS No. 720441). Figure 5(d) presents the SADP of TiCu along the zone axis of
 $\left[ {0\bar 21} \right]$
, identified as a tetragonal structure with the measured lattice parameters a = 0.323 nm and c = 0.6132 nm (TiCu, P4/mmm, a = 0.3108 nm, c = 0.5887 nm in JCPDS No. 070114). Figure 5(e) presents the EDS results of Ti2Cu, consisting of 67.62Ti–31.25Cu–1.13Ag (at.%). Figure 5(f) presents the EDS results of TiCu, which consisted of 48.13Ti–47.59Cu–4.28Ag (at.%). Figure 5(g) shows that the TiCu4 contained 20.05Ti–78.60Cu–1.35Ag (at.%).
TEM results of the microstructure: (a and b) morphologies of the α-Ti, Ti2Cu, TiCu, TiCu4, and Ag-rich phases at the Ti/Ticusil interface of the Ti/Ticusil/3Y–ZrO2 joint after brazing at 900 °C for 1 h; (c) electron diffraction patterns of Ti2Cu with the
 $\left[ {010} \right]$
zone axis; (d) electron diffraction patterns of TiCu with the
 $\left[ {0\bar 21} \right]$
zone axis; (e) EDS spectrum of Ti2Cu; (f) EDS spectrum of TiCu; and (g) EDS spectrum of TiCu4.

Figure 6(a) demonstrates that acicular Ti2Cu was precipitated on the titanium side of the Ti/Ticusil/3Y–ZrO2 joint after brazing at 900 °C/6 h. Figure 6(b) displays the SADPs, with their patterns redrawn in Fig. 6(c), of α-Ti and Ti2Cu with the following orientation relationship:
 $\left[ {2\bar 1\bar 10} \right]_{{\rm{\alpha - Ti}}} //\left[ {100} \right]_{{\rm{Ti}}_{\rm{2}} {\rm{Cu}}}$
and
 $\left( {0002} \right)_{{\rm{\alpha - Ti}}} {\rm{//}}\left( {0\bar 13} \right)_{{\rm{Ti}}_{\rm{2}} {\rm{Cu}}}$
. The Ti2Cu had a tetragonal structure with the measured lattice parameters a = 0.297 nm and c = 1.071 nm (Ti2Cu, I4/mmm, a = 0.29438 nm, c = 1.07861 nm in JCPDS No. 720441), while the matrix was identified as α-Ti with the measured lattice parameters a = 0.299 nm and c = 0.474 nm (α-Ti, P6
3
/mmc, a = 0.295 nm, c = 0.4682 nm in JCPDS No. 441294).
TEM results of the microstructure: (a) morphology of acicular Ti2Cu precipitates in the α-Ti matrix on the Ti side of the Ti/Ticusil/3Y–ZrO2 joint after brazing at 900 °C for 6 h and (b and c) electron diffraction patterns of α-Ti and Ti2Cu with their schematic diagram (●, α-Ti and ×, Ti2Cu) showing
 $z = \left[ {2\bar 1\bar 10} \right]_{{\rm{\alpha - Ti}}} //\left[ {100} \right]_{{\rm{Ti}}_{\rm{2}} {\rm{Cu}}}$
and
 $\left( {0002} \right)_{{\rm{\alpha - Ti}}} //\left( {0\bar 13} \right)_{{\rm{Ti}}_{\rm{2}} {\rm{Cu}}}$
.

C. Microstructure development and diffusion path
1. Diffusion path for the Ag–Cu–Ti phase diagram
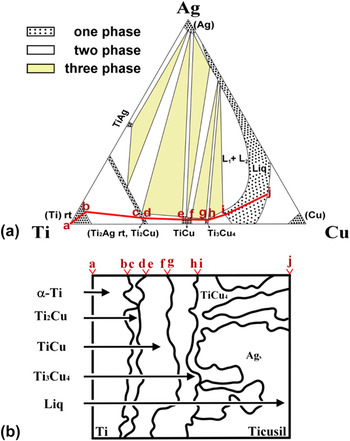
Figure 7(a) presents an isothermal section of the Ag–Cu–Ti ternary phase diagram at 900 °C. Reference Eremenko, Buyanov and Panchenko27 The diffusion path (solid line), indicative of the compositions along the longitudinal direction perpendicular to the interface, was proposed to be a–b–c–d–e–f–g–h–i–j for the Ti/Ticusil interface after brazing at 900 °C/0.1 h. The diffusion path crossed the fields of α-Ti, α-Ti + Ti2Cu, Ti2Cu, Ti2Cu + TiCu, TiCu, TiCu + Ti3Cu4, Ti3Cu4, Ti3Cu4 + L, and L. The diffusion path did not pass through Ti2Cu3 from the viewpoint of kinetics. Reference Andrieux, Dezellus, Bosselet, Sacerdote-Peronnet, Sigala, Chiriac and Viala17 The three-phase regions and crossing parallel tie lines (not shown) in the two-phase regions of the ternary phase diagram were simply in correspondence to the layer interface. Figure 7(b) presents the microstructures that developed in the Ti/Ticusil joint upon brazing at 900 °C/0.1 h. The connecting letters indicate the relationship between the microstructure of the Ti/Ticusil interface and the isothermal section of the Ag–Cu–Ti phase diagram. As illustrated in Fig. 7(b), the regions of α-Ti + Ti2Cu (b to c), Ti2Cu + TiCu (d to e), TiCu + Ti3Cu4 (f to g), and Ti3Cu4 + L (h to i) correspond to the interfaces between α-Ti and Ti2Cu, Ti2Cu and TiCu, TiCu and Ti3Cu4, and Ti3Cu4 and L, respectively. Thus, the layers of α-Ti, Ti2Cu, TiCu, Ti3Cu4, and L (Ag (major) + TiCu4 (minor)) were formed in sequence from Ti to Ticusil upon cooling.
(a) An isothermal section of the Ag–Cu–Ti system at 900 °C and the schematic diffusion path: a–b–c–d–e–f–g–h–i–j and (b) the correlation between the ternary phase diagram and the microstructural evolution at the Ti/Ticusil interface of the Ti/Ticusil/3Y–ZrO2 joint after brazing at 900 °C for 0.1 h. L1 and L2 are represented as an Ag–Cu rich liquid and a Ti–Cu rich liquid, respectively.

2. Diffusion path for the Ag–Cu–Ti phase diagram
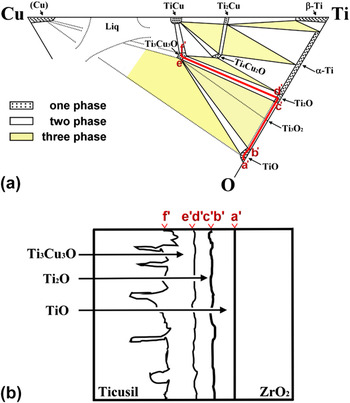
Figure 8(a) illustrates the correlation between the microstructure of the Ticusil/3Y–ZrO2 interface and the Ti–Cu–O ternary phase diagram. Reference Kelkar, Spear and Carim18 The diffusion path lying upon the solid line was designated as follows: a′–b′–c′–d′–e′–f′. The crossed fields were TiO, TiO + Ti2O, Ti2O, Ti2O + Ti3Cu3O, and Ti3Cu3O. The interfaces of various reaction layers were illustrated by these regions, such as TiO + Ti2O (b′ to c′) and Ti2O + Ti3Cu3O (d′ to e′). The reaction layers of TiO, Ti2O, and Ti3Cu3O, as illustrated in Fig. 8(b), were formed between Ticusil and 3Y–ZrO2 after brazing at 900 °C/1 h. No Ti3O2 phase appeared because the peritectoid reaction (α-Ti + α-TiO → Ti3O2) occurred at 920 °C.
(a) An isothermal section of the Ti–Cu–O system at 945 °C and the schematic diffusion path: a′–b′–c′–d′–e′–f′ and (b) the correlation between the diffusion path and the ternary phase diagram showing the microstructural evolution at the Ticusil/3Y–ZrO2 interface of the Ti/Ticusil/3Y–ZrO2 joint after brazing at 900 °C for 1 h.

D. Proposed model of microstructural evolution
1. Melting and solidification of Ticusil
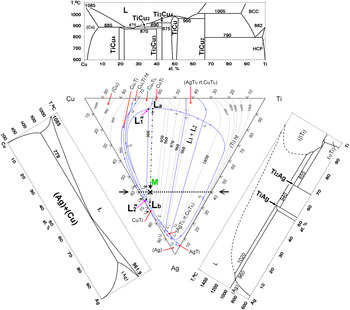
Figure 9 shows the liquidus surface projection of the ternary Ag–Cu–Ti diagram (middle) Reference Eremenko, Buyanov and Panchenko28 and the relevant binary phase diagrams (Ti–Cu, Ag–Cu, and Ag–Ti). Reference Murray12,Reference Murray and Bhansali29,Reference Murray30 While there are two intermetallics (Ti2Ag and TiAg) in the Ag–Ti phase diagram, Reference Murray and Bhansali29 six intermetallics (Ti2Cu, TiCu, Ti3Cu4, Ti2Cu3, TiCu2, and TiCu4) exist in the Ti–Cu phase diagram Reference Murray30 due to the high negative values for the heat of mixing. Thus, Ti has a greater affinity for Cu than for Ag. The Ticusil alloy has a composition of 55.4Ag–36.5Cu–8.1Ti (at.%), which might be considered as a eutectic Ag60Cu40 modified with 8.1Ti (at.%). Its composition (labeled M) fell inside a wide miscibility loop in the ternary Ag–Cu–Ti liquidus projection. Two arrows pointed to the compositions of L a and L b upon reaching the miscibility boundary line, indicating that the Ticusil was divided into two immiscible liquids: M → L a + L b at 900 °C. Estimated from the miscibility loop, the liquid Ticusil was separated into 20% L a [7.1Ag–59.3Cu–33.6Ti (at.%)] and 80% L b [67.7Ag–31Cu–1.3Ti (at.%)]. L a was approximate to the apparent ratio Ti:Cu = 1:2, while the chemistry of L b was close to the Ag–Cu eutectic composition [60Ag–40Cu (at.%)] at 780 °C.
Liquidus surface projection onto the Ag–Cu–Ti compositional triangle (middle), Ti–Cu binary phase diagram (top), Ag–Cu phase diagram (left), and Ag–Ti phase diagram (right). Designations: ― (boundary of miscibility loop); →…← [vertical Cu–Ti–(60% Ag)]; ←★→ (composition of Ticusil and liquid phase separation path); M, nominal composition of Ticusil (Ag55.4–Cu36.5–Ti8.1); and ×, composition of Ag60–Cu35–Ti5.

Although the concentrations of Ti were quite different in both the Cu–Ti rich (L a ) and Ag–Cu rich (L b ) liquids at 33.6 and 1.3 (at.%), respectively, the two separated liquids had the same activities of Ti and Cu, respectively. Thus, Ag could enhance the activity of Ti, while Cu suppressed the activity of Ti in the liquid. Reference Hirnyj and Indacochea31 Because Ticusil was regarded as a modified eutectic 60Ag–40Cu (at.%) with a low content of Ti, a vertical Cu–Ti section of the Ag–Cu–Ti system [fixed 60Ag (at.%)] would be useful to analyze the solidification of the interlayer. Reference Eremenko, Buyanov and Panchenko27
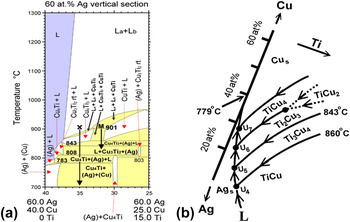
The compositions of these two separated liquid phases were fixed with a small variation in their relative amounts as the point M was projected to the point X, in which the composition X was located at 60Ag–35Cu–5Ti (at.%). Figure 10(a) indicates that the cooling path of the point X would pass through several domains upon cooling from 900 °C as follows: (i) L
a
+ L
b
(two liquid phases separated at 900 °C); (ii) L
a
+ L
b
+ Ti3Cu4 (L
a
exhausted and transformed into Ti3Cu4 with all the Ag (L
a
) and excess Cu (L
a
) diffusing from L
a
to L
b
at 889–879 °C); (iii) L + Ti3Cu4 (L
b
transformed into L at 879–854 °C); (iv) L + (Ag) + Ti3Cu4 (a solid Ag phase precipitated from L at 854–843 °C); (v) L + Ti2Cu3 + (Ag) (all the Ti3Cu4 transformed into Ti2Cu3 and more Ag precipitated at 843–808 °C); (vi) L + (Ag) + TiCu4 (all the Ti2Cu3 transformed into TiCu4, and more Ag precipitated at 808–783 °C); and (vii) (Ag) + (Cu) + TiCu4 (L consumed completely and transformed into Ag and Cu below 783 °C). If this description was true, the final microstructures of the Ticusil interlayer should have consisted of Ag and Cu solid solutions and TiCu4 precipitates. However, primary Ag with Cu inclusions, eutectic (Ag) + (Cu), and Ti3Cu4 were observed in the as-received Ticusil interlayer. The vertical Cu–Ti sections of the Ag–Cu–Ti system for fixed 55.4 and 60 at.% Ag were significantly different such that the relevant cooling path should be somewhere between M and X. Therefore, the cooling path could first enter the (L + TiCu + Ti3Cu4) domain, resulting in the isothermal reaction at 900 °C in the Ag–Cu–Ti triangle, as illustrated in Fig. 9:
 ${\rm{L}}_{1}}^" + {\rm{TiCu}} \leftrightarrow {\rm{L}}_{2}}^" + {\rm{Ti}}_{\rm{3}} {\rm{Cu}}_{\rm{4}}$
(
 ${\rm{L}}_{1}}^"$
and
 ${\rm{L}}_{\rm{2}}^"$
were close to L
a
and L
b
, respectively).
Reference Eremenko, Buyanov and Panchenko28
Thus, not only two separated liquids (L
a
+ L
b
) but also two Ti–Cu phases (TiCu + Ti3Cu4) existed at 900 °C. In brief, the amount of L
a
was consumed with the decreasing temperature, and the remaining L
b
(designated L hereafter) would follow the cooling paths from U4 toward U5, as shown in Fig. 10(b), in the temperature range from 900 to 843 °C as follows
Reference Andrieux, Dezellus, Bosselet, Sacerdote-Peronnet, Sigala, Chiriac and Viala17
:
 ${\rm{U}}_{4}} :{\rm{L}} + {\rm{TiCu}} \to {\rm{Ag}} + {\rm{Ti}}_3 {\rm{Cu}}_4$
and
 ${\rm{U}}_{5}} :{\rm{L}} + {\rm{Ti}}_{\rm{3}} {\rm{Cu}}_{\rm{4}} \to {\rm{Ag}} + {\rm{Ti}}_{\rm{2}} {\rm{Cu}}_{\rm{3}}$
. The solidus point of Ticusil (830 °C) corresponded to the transformation of Ti3Cu4 to Ti2Cu3. The solidification of the liquid phase would be completed at U5. The Ti3Cu4 phase was retained at room temperature after cooling from 900 °C because the formation of Ti2Cu3 had very slow kinetics.
Reference Andrieux, Dezellus, Bosselet, Sacerdote-Peronnet, Sigala, Chiriac and Viala17
Thus, most of the Ti in the as-received Ticusil interlayer was associated with the Cu-rich phase (Ti3Cu4) at 900 °C.
(a) A vertical Cu–Ti–(60% Ag) section of the Ag–Cu–Ti system between 700 and 1300 °C and (b) the cooling paths (U4–U7) in the partial liquidus projection of the Ag–Cu–Ti phase diagram between 779 and 860 °C. Different colors are used for the one-phase region (purple), two-phase region (white), and three-phase region (yellow).

2. Microstructural evolutions at the Ti/Ticusil/3Y–ZrO2 interface
The model of melting and solidification mentioned above could not be applied to brazing because the reactive wetting and interdiffusion between the Ticusil interlayer melt and base materials caused the formation of Ti–Cu compounds and a dramatic compositional variation in the liquid interlayer. Based on the activity distributions of Ti and Cu, the microstructural development and bonding mechanisms of the Ti/Ticusil/3Y–ZrO2 joint were described as follows.
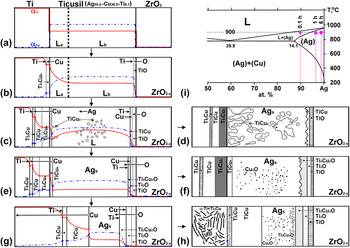
In stage 1, the Ticusil interlayer was melted at 900 °C, resulting in the phase separation of L a [7.1Ag–59.3Cu–33.6Ti (at.%)] and L b [67.7Ag–31Cu–1.3Ti (at.%)]. These two phases were in equilibrium such that the activities of the Ti and Cu in them were fixed, respectively, through the interlayer, as shown in Fig. 11(a). Because the Ti–Cu affinity was stronger than the Ag–Ti affinity, the near Ti:Cu = 1:2 stoichiometry liquid (L a ) tended to approach the Ti side, while the near Ag–Cu eutectic liquid (L b ) moved to the 3Y–ZrO2 side. In stage 2, the Ticusil melt had a good wettability on the Ti surface because Ti was a very active metal. Good wettability could enhance the dissolution and reaction of Ti and 3Y–ZrO2 into the Ticusil liquid. After the Ti substrate was significantly dissolved in the Ticusil interlayer, the Ti activity increased, and a gradient was established between the Ti and 3Y–ZrO2. When the Ti activity was sufficiently high in the liquid (L a ) adjacent to the Ti surface, Ti3Cu4 began to nucleate and grow as a thin outer layer on the Ti surface. Once Ti3Cu4 was formed, the concentration of Cu adjacent to the Ti substrate was reduced, leading to a Cu activity gradient in the liquid phase abutting the Ti, as shown in Fig. 11(b). In stage 3, the predominant mechanisms were interdiffusion and a chemical reaction between Ti and the Ticusil melt. It was believed that Cu diffused across the Ti3Cu4 layer and reacted with Ti to produce TiCu and Ti2Cu at the Ti/Ti3Cu4 interface because the Cu atoms diffused faster than the Ti atoms. Figure 11(c) shows that the activities of Ti and Cu descended in opposite directions through the three Ti–Cu layers. As the Ti–Cu layers increased in thickness, the increasing distance over which the Cu and Ti needed to diffuse hindered the transportation of Ti through the Ti–Cu layers. Thus, the further supply of Ti atoms to the interface was frequently negligible and insufficient, resulting in a Ti-depleted zone in liquid L a abutting the Ti substrate after the nucleation of TiCu4 occurred at the solid/liquid interface with a reduced relative Ti/Cu ratio (3/4 → 1/4). This result indicated that Ti was sharply consumed and that concentration inversion occurred. In stage 4, all the Ti in the liquid L a was nearly consumed. Meanwhile, the TiCu4 tended to grow into the liquid with more concentrated Ti and Cu (L b ) such that dendritic TiCu4 would nucleate and grow into the liquid phase. The clumpy TiCu4 was also formed far away from the original Ti/Ticusil interface before the complete solidification of the interlayer. The residual interlayer hereafter could be considered an Ag–Cu binary alloy (L) with a small amount of Ti in solution. However, the Cu content in the L was gradually reduced due to the formation of Cu–Ti intermetallic compounds as the composition of the liquid phase varied along the liquidus. Thus, the melting temperature would be increased somewhere in the Ag–Cu binary phase diagram. Reference Murray12 It was believed that the composition of the residual Ag–Cu alloy (L) should be below the hypoeutectic limit (14 at.%) because no eutectic (Ag) + (Cu) structure was observed after cooling. Furthermore, the liquidus temperature should have been increased above 900 °C such that its composition and temperature (marked as ★) were located in the (L + Ag) region, as shown in Fig. 11(i). It was inferred that the clumpy TiCu4 was formed together with the Ag solid solution in the residual interlayer after cooling from 900 °C. As Ti was dissolved in the Ticusil melt, the Ti activity in the vicinity of the 3Y–ZrO2 interface also increased beyond a threshold value such that a thinner layer of TiO was formed at 900 °C. The near Ag–Cu eutectic liquid (L b ) spread on the 3Y–ZrO2 substrate by reactive wetting: xTidiss + ZrO2 → xTiO + ZrO2−x , as shown in Fig. 11(b). Then, Cu atoms in the Ag–Cu liquid (L) reacted with Tidiss to form a thinner layer of TiCu over the TiO layer, as observed in Fig. 11(c). Figure 11(d) demonstrates that the interfacial layer sequence of Ti2Cu/TiCu/Ti3Cu4/residual interlayer (Ag + TiCu4)/TiCu/TiO existed after brazing at 900 °C/0.1 h.
Microstructural evolution of the Ti/Ticusil/3Y–ZrO2 joint at 900 °C for various brazing periods: (a) → (b) → (c) → (d) for 0.1 h, (a) → (b) → (e) → (f) for 1 h, and (a) → (b) → (g) → (h) for 6 h. The activity profiles of Ti and Cu are depicted on an arbitrary scale for simplicity. (i) the Ag-Cu phase diagram showing the corresponding compositions for various brazing periods.

Figure 11(e) demonstrates that four continuous and thicker Ti–Cu layers (Ti2Cu/TiCu/Ti3Cu4/TiCu4) were formed sequentially from the Ti side to the interlayer upon brazing at 900 °C/1 h, which means that dramatic Cu consumption would cause complete solidification with the composition of the residual Ag–Cu alloy (L) being located in the α-Ag solid solution of the Ag–Cu phase diagram (marked by ▲). Reference Murray12 Neither the clumpy TiCu4 nor the dendritic TiCu4 was observed because no liquid phase remained at this stage. After cooling, supersaturated Cu and O were precipitated as Cu2O in the matrix of Ag. In addition to the TiO layer, two oxide layers of Ti2O and Ti3Cu3O were observed on the 3Y–ZrO2 side, which indicated that significant O atoms (from the ZrO2−x ) diffused across the TiO layer to react with the Cu and Ti atoms of the residual interlayer such that the residual interlayer should be considered an Ag alloy with Ti, Cu, and O in solid solutions. The formation of Ti3Cu3O could be described by the following reaction: 3TiCu + Odiss → Ti3Cu3O. Thermodynamic calculations of the Gibbs free energy (∆G) for Ti3Cu3O (−502.5 kJ/mol) confirmed that it was more stable than TiCu (−14.7 kJ/mol) at 900 °C. Reference Liang, Wang, Yang, Wang and Jiang21,Reference Yang, Lin and He32 Finally, the interfacial layers [Ti2Cu/TiCu/Ti3Cu4/TiCu4/residual interlayer (Ag + Cu2O)/Ti3Cu3O/Ti2O/TiO] were observed after brazing at 900 °C/1 h, as shown in Fig. 11(f).
Figure 11(g) shows the microstructure expected before cooling for brazing at 900 °C/6 h. The TiCu phase grew at the expense of Ti3Cu4 and TiCu4 at the Ti/Ticusil interface, indicating that TiCu was much more stable than both Ti3Cu4 and TiCu4. Reference Liang, Wang, Yang, Wang and Jiang21,Reference Shiue and Wu33 While three interfacial oxide layers (Ti3Cu3O, Ti2O, and TiO) became thicker, no new phase was formed in the vicinity of the 3Y–ZrO2. However, a two-phase region of α-Ti + Ti2Cu appeared on the Ti side due to a hypoeutectoid reaction during cooling, implying that the extensive diffusion of Cu occurred on the Ti side. The composition of the residual interlayer went further into the (Ag) region and was located at the position marked by a dot (●) in the Ag–Cu phase diagram in Fig. 11(i). Fine Cu2O and Ti3Cu3O phases were precipitated in the Ag solid solution of the residual interlayer during cooling. Finally, the interfacial layers of α-Ti + Ti2Cu/Ti2Cu/TiCu/residual interlayer (Ag + Cu2O + Ti3Cu3O)/Ti3Cu3O/Ti2O/TiO in sequence were observed after brazing at 900 °C/6 h, as shown in Fig. 11(h).
IV. CONCLUSIONS
In this study, 3 mol% Y2O3-stabilized zirconia (3Y–ZrO2) and commercially pure titanium (cp-Ti) joints were fabricated with an Ag68.8Cu26.7Ti4.5 interlayer at 900 °C for various brazing periods. After brazing at 900 °C/0.1 h, Ti2Cu, TiCu, Ti3Cu4, and TiCu4 layers were present at the Ti/Ticusil interface, while TiCu and TiO layers were observed at the Ticusil/3Y–ZrO2 interface. After brazing at 900 °C/1 h, Ti3Cu3O and Ti2O layers were formed at the interlayer/ZrO2 interface. After brazing at 900 °C/6 h, the TiCu layer grew at the expense of Ti3Cu4 and TiCu4 at the Ti/interlayer interface, and a two-phase (α-Ti + Ti2Cu) region was observed on the Ti side. While clumpy TiCu4 was formed in the melt interlayer, the liquid phase disappeared due to the extensive chemical reaction between Ti and Cu, leading to the formation of an Ag solid solution with fine Cu2O precipitates. The bonding mechanisms could be categorized into various stages. In stage 1, melting and liquid phase separation were the predominant mechanisms. In stage 2, dissolution and reactive wetting were the predominant mechanisms. In stage 3, interdiffusion and/or chemical reactions between Ti and Cu were the predominant mechanisms. In stage 4, solidification was the predominant mechanism after Ti and Cu were consumed due to the formation of various Ti–Cu intermetallic compounds, increasing the liquidus of residual Ag–Cu above the brazing temperature. In the cooling stage, fine Cu2O and/or Ti3Cu3O phases were precipitated in the residual interlayer, while a eutectoid reaction (α-Ti + Ti2Cu) occurred on the Ti side for long-term brazing.
ACKNOWLEDGMENT
This research was supported by the National Science Council (Taiwan) under Contract No. NSC98-2221-E-009-039-MY2.