Implications
The presented gene-flow method enables calculation of the relative economic importance of traits considering the whole population structure of pig crossbreeding systems and the time delay between selection in purebred parental populations and trait expressions in several purebred and crossbred progeny generations. The results of our study indicated that this gene-flow method could be foregone when estimating the relative economic importance of pig traits. However, this statement is only valid for pig crossbreeding systems that apply artificial insemination at all production levels and cannot be generalised for other pig breeding systems without further studies.
Introduction
Economic values for traits expressed in sows and growing pigs are typically calculated without considering the number of discounted gene expressions (NDEs) for these traits in different breeds involved in specific breeding or crossbreeding systems (Quinton et al., Reference Quinton, Wilton, Robinson and Mathur2006; Dube et al., Reference Dube, Mulugeta and Dzama2013). The discounted expressions of a genotype in different traits as a consequence of one mating or insemination were generally defined by Danell et al. (Reference Danell, Rönningen, Ström, Andersson and Sundgren1976) as accumulations over generations and years of the products of: (i) the probable number of individuals in each generation and year, expressing the genotype transferred in the initial mating; (ii) a generation discount factor describing the relationship of the parent in the initial mating to its descendants; and (iii) a time discount factor that depends on the financial discount rate and on time elapsed between initial mating and trait expression. However, in the literature, the definition of NDEs deviates somewhat from this description. For example, the NDEs for pig traits expressed by females (maternal traits), which were calculated by Amer et al. (Reference Amer, Ludemann and Hermesch2014), accounted for the average number of parities per replacement gilt and for the time delay between trait expressions in each parity and gilt birth. These trait NDEs were expressed per replacement gilt. The NDEs for traits expressed in growing animals (direct traits), and presented by Hermesch et al. (Reference Hermesch, Ludemann and Amer2014) for the same population, accounted for the number of piglets per farrowing and for the time delay between piglet birth and trait expression. In these studies, the economic weights (EWs) of maternal and direct traits were then calculated as the product of the marginal economic values (MEVs) of traits and the corresponding NDEs. Using this approach, the NDEs included only one generation of replacement females in commercial pig herds producing terminal hybrids.
Wolfová and Nitter (Reference Wolfová and Nitter2004) showed that by applying a crossbreeding system in pigs, the time delay between selection of purebred parents of the next pig generation and gene expression of these parents for specific trait in all links of a crossbreeding system during a specific investment period should also be considered. This can be performed by applying a gene flow procedure with a generation discount factor next to discounting the number of trait expressions within one progeny generation (Elsen and Mocquot, Reference Elsen and Mocquot1974; McClintock and Cunningham, Reference McClintock and Cunningham1974).
To the best of our knowledge, a program that would combine the calculation of trait MEVs with the calculation of trait NDEs, in order to obtain EWs for maternal and direct traits in pigs, does not yet exist. Therefore, the objective of this study was to expand the bioeconomic model and corresponding computer program previously described by Wolfová et al. (Reference Wolfová, Wolf, Krupová, Krupa and Žáková2017) using a gene flow procedure. The new program was then applied for the calculation of EWs for maternal and direct traits of pig breeds in a crossbreeding system. To assess the contributions of the gene flow procedure to the correct economic evaluation of maternal and direct traits of pigs, the EWs calculated using gene flow were compared with the approximate EWs calculated for the same crossbreeding system by Krupa et al. (Reference Krupa, Krupová, Wolfová and Žáková2017) without the gene flow procedure.
Material and methods
The bioeconomic model to calculate MEVs for pig traits was described previously by Wolfová et al. (Reference Wolfová, Wolf, Krupová, Krupa and Žáková2017). Thus, a gene flow procedure applied for the conversion of MEVs to the EWs and its application to a three-way crossbreeding system will be described herein.
Calculation of the number of discounted expressions
According to the definition given in the ‘Introduction’ section, discounted gene expressions of the genotypes of selected parents (boars or gilts) as a consequence of one mating can be described as the accumulation of parent genes in the progeny over generations and years at all production levels of a breeding or crossbreeding system. The number of genes expressing a trait in different parities of breeding females and their progeny and in different generations was discounted to the year of parent selection with a discount rate for the appropriate time interval. In pigs, a half-year period was applied as the time unit for the discounting based on the average length of the sow reproductive cycle. A flow diagram, called transition matrix P , was constructed to follow the movement of genes of selected parents through the pig populations over time. Its elements (p ij ) give the probability that genes from the male and female parent sex and age class j are transmitted to the progeny sex and age class i during one time unit. Matrix P is a quadratic matrix that has a block structure containing different numbers of blocks depending on the breeding or crossbreeding system and on the mating type (artificial or natural mating). The general structure of matrix P is:
 $$P{\equals}\left[ {\matrix{ {P_{{11}} } \hfill & {P_{{12}} } \hfill & {...} \hfill & {P_{{1n}} } \hfill \cr {P_{{21}} } \hfill & {P_{{22}} } \hfill & {...} \hfill & {P_{{2n}} } \hfill \cr \vdots \hfill & \vdots \hfill & \ddots \hfill & \vdots \hfill \cr {P_{{n1}} } \hfill & {P_{{n2}} } \hfill & {...} \hfill & {P_{{nn}} } \hfill \cr } } \right]$$
The blocks (submatrices) of matrix P represent the age classes of breeding males, females and slaughter animals in a purebred breeding system or these age classes in all links (with different breeds and crossbreeds) of a crossbreeding system. The submatrices that represent transmission of genes from sires to sires and dams to dams are of structure S 1 (equation (1)). The submatrices representing transmission of genes from sires to dams and from dams to sires are of structure S 2 (see equation (1)). The submatrices showing the transmission of genes from sires to boars that are used for natural mating in different links of a crossbreeding system and that do not produce further generations of sires and the submatrices for the transmission of genes from dams to crossbred females not reproducing themselves have the form S 3 (equation (1)). The submatrices for the transmission of genes from sires and dams to slaughter animals of appropriate genotypes have the structure S 4 with only one row (one age class, see equation (1)).
 $$\eqalignno{ S_{1} {\equals} & \left[ {\matrix{ x & x & x & \cdots & x & x \cr 1 & 0 & 0 & \cdots & 0 & 0 \cr 0 & 1 & 0 & \cdots & 0 & 0 \cr 0 & 0 & 1 & \cdots & 0 & 0 \cr 0 & 0 & 0 & \ddots & 0 & 0 \cr 0 & 0 & 0 & \cdots & 1 & 0 \cr } } \right]\,,\,\,S_{2} {\equals}\left[ {\matrix{ x & x & x & \cdots & x & x \cr 0 & 0 & 0 & \cdots & 0 & 0 \cr 0 & 0 & 0 & \cdots & 0 & 0 \cr 0 & 0 & 0 & \cdots & 0 & 0 \cr 0 & 0 & 0 & \ddots & 0 & 0 \cr 0 & 0 & 0 & \cdots & 0 & 0 \cr } } \right],\,\,\cr & S_{3} {\equals}\left[ {\matrix{ 0 & 0 & 0 & \cdots & 0 & 0 \cr 1 & 0 & 0 & \cdots & 0 & 0 \cr 0 & 1 & 0 & \cdots & 0 & 0 \cr 0 & 0 & 1 & \cdots & 0 & 0 \cr 0 & 0 & 0 & \ddots & 0 & 0 \cr 0 & 0 & 0 & \cdots & 1 & 0 \cr } } \right] \cr\cr & {\;S_{4} {\equals}\left[ {\matrix{ x \hfill & x \hfill & x \hfill & \cdots \hfill & x \hfill & x \hfill \cr } } \right]} $$
Each of the elements in the first row of submatrices S 1 to S 4 (designated x) is the proportion of genes in the sex–age class i at time t, which comes from sex–age class j at time t-1, where i refers to the row number of the matrix, j refers to the column number of the matrix and x assumes values between 0 and 0.5. Thus, the values of x depend on the contribution of each sex–age class of parents to the progeny gene pool. The sign x was used here in the submatrices S 1 to S 4 in light of generality, because which of the x values will have a zero or non-zero value depends on the parent selection strategy, the ages of females and males at the first mating and the number of animal sex–age classes in specific breeds or crossbreeds. The element 1 in the submatrices shows the aging of breeding animals. The concrete form of the transmission matrix P with concrete values of x for the evaluated three-way crossbreeding system, in which artificial insemination is assumed for all levels (in all links) of this system, is given in the Supplementary Material S1 as an example. The number of sex–age classes in the blocks of matrix P for breeding boars (ncS) was calculated as:
 $${\rm ncS}\,{\equals}\,1\,{\plus}\,{\mathop{\rm int}} \left( {{\rm lifeB}\,{\plus}\,0.5} \right)$$
where 1 indicates the first age class of sires, that is, young breeding boars before starting their use for mating, and the next number is the integer from the productive lifetime of breeding boars since their first mating to culling (lifeB), which is given as the number of sow reproductive cycles (i.e. the length of each age class is equal to the average length of the farrowing interval). The number of sex–age classes for dams of a breed or crossbreed (ncD) was calculated as:
 $${\rm ncD}\,{\equals}\,{\mathop{\rm int}} \left( {{{{\rm ageG1}} \over {{\rm fintS}}}} \right)\,{\plus}\,{\rm RR}$$
where the first term in the equation is the integer from the age of gilts of the appropriate breed or crossbreed at first farrowing (ageG1) expressed as the number of sow reproductive cycles (fintS is the average farrowing interval), and RR is the maximum number of reproductive cycles a sow can reach.
The non-zero elements in each row of matrix P must sum to 1. The sum of non-zero elements in the first row of submatrices for sires and dams must be 0.5 because sires and dams contribute to progeny with half of their genes. The values of the elements x in the first rows of submatrices for sires to sires and dams to sires can be established by program users as input parameters for gene flow. This will be the case when sires and dams for the production of the next generation of breeding boars are selected only from specific age classes of sires and dams in the particular breeding programme. Otherwise, these values are calculated in the same way as the elements x in the first rows of the remaining submatrices, namely from the age structure of the boar and sow populations for each breed and crossbreed, as described below.
The first element (p 11 ) in the first row of the submatrices for sires to sires, sires to dams and sires to slaughter animals is always zero because boars are not used for mating when they are younger than 6 months. The value of the second element (p 12 ) is half of the proportion of young boars in the boar population. Further values for the elements higher than two in these submatrices are assumed to be equal and are, therefore, calculated as:
 $$p_{{1(2{\plus}i)}} \,{\equals}\,\left( {{{0.5\,\hbox{-}\,p_{{12}} } \over {{\rm ncS}\,\hbox{-}\,2}}} \right)\quad for\quad i{\equals}1,\,\ldots\,\,,{\rm ncS}\hbox{-}2$$
where ncS has the same meaning as in equation (2). The values for the non-zero elements p ij in the first row of the submatrices for dams to sires (for cases in which there is no selection of age classes for dams of sires), dams to dams and dams to slaughter animals are calculated as follows:
 $$\eqaligno{ P_{1( {\rm{acD}} - {\rm{RR}} +i)} = \left\{ {\matrix{\hskip-0pt{0.5\, \times \,pS_i \hskip 30pt\matrix{{ {\rm{\hskip 110pt dams\hbox{-}to\hbox{-}purebred\,\,animals}} }\hfill { {\rm{in\,\,purebreeding\hskip 15pt}} } \cr } {\rm{ }} } \cr {\matrix{\hskip-2pt{0.5\, \times \,pS_i } { \times \,{\displaystyle{{1\,-\, {\rm{pcross}} S_{\left( {i-1} \right)} } \over {\sum\limits_{i = 1}^{ {\rm{RR}} } {\left( {(1- {\rm{pcross}} S_{\left( {i-1} \right)} )\, \times \,pS_i } \right)} }}}} \cr } \quad\matrix{{ {\rm{dams\hbox{-}to\hbox{-}purebred \quad animals}} } { {\rm{in \quad crossbreeding}} } \cr } {\rm{ }} } \cr {\,\matrix{\hskip0pt{0.5\, \times \,pS_i } { \times {\displaystyle{{ {\rm{pcross}} S_{\left( {i-1} \right)} } \over {\sum\limits_{i = 1}^{ {\rm{RR}} } {\left( { {\rm{pcross}} S_{\left( {i-1} \right)} \, \times \,pS_i } \right)} }}}} \hfill \cr } \quad\matrix{{ \hskip 25pt{\rm{dams\hbox{-}to\hbox{-}crossbred \quad animals}} } { {\rm{in \quad crossbreeding\hskip 0pt}} }\hfill \cr } {\rm{ }} } \cr } } \right. \cr}$$
where pS i is the proportion of sows in parity i (i=1,…RR), RR has the same meaning as in equation (3) and pcrossS i is the fraction of sows crossed on each parity i (pcrossS 0 is the fraction of crossed gilts). The term in the first line of equation (5) is valid in cases in which there are only purebred matings in the particular breed (e.g. all matings in the herds with the dam breed Czech Landrase, which is used in the sire position in the three-way crossbreeding system, are purebred matings). The terms in the second and third lines of equation (5) are valid in cases in which crossbred matings exist for sows of a particular breed. The values calculated according to the second line of equation (5) are the first elements of the first row of the submatrices for dams to purebred animals (sires, dams and slaughter animals), and those calculated according to the third line are the first elements of the first row of the submatrices for dams to crossbred animals (to crossbred dams and crossbred slaughter animals).
To calculate NDEs of a breeding animal selected for mating in the sex–age class n sc , a vector m is defined with the same dimension as the dimension of matrix P . At time t=0 (time of selection of this breeding animal), all elements of vector m are zero, except the element n sc , which has a value of 1. Then, the proportions of genes of the selected animal in each of the sex–age classes for all animal groups defined in matrix P at time t are calculated as:
 $$m^{t} \,{\equals}\,P^{t} \,\,{\times}\,m^{0} $$
Discounting the proportions of genes in each sex–age class of animals at time t to the time of parent selection with a discount rate u and summing these discounted proportions over the defined investment period inv, a vector msum is obtained with elements msum j , which represents the NDEs of the selected animal in each sex–age class j of all animal groups defined in the appropriate breeding (crossbreeding) system:
 $$msum\,{\equals}\,\mathop{\sum}\limits_{t{\equals}1}^{{\rm inv}} {m^{t} \,\,{\times}\,\left( {1{\plus}u} \right)^{{{\minus}t}} } $$
Calculation of the absolute and relative economic weights for maternal and direct pig traits
According to Wolfová and Nitter (Reference Wolfová and Nitter2004), most traits can be considered to belong to one of the two groups in animal breeding. The first group occurs only once in the animal’s life (e.g. growth and carcass traits). The second group is realised by adult females several times in their life (e.g. fertility traits, but also survival rates of sows, determining the average length of the sow productive lifetime). Survival rates of sows are defined as the proportion of sows that survive to the end of the current reproductive cycle. Only some sows die or are culled during each reproductive cycle, and therefore, sow survival rate is realised (expressed) repeatedly during the lives of females. For simplicity, we designated the first group as direct traits and the second group as maternal traits. Some traits (e.g. growth of piglets until weaning, piglet survival) are affected by direct and maternal genetic effects and can be defined as a trait of the piglet (the direct component of a trait realised once by the offspring) as well as a trait of the sow (the maternal component realised several times during the female’s life). Many studies in the literature have estimated genetic parameters for both maternal and direct effects of piglet growth and piglet survival (Lundgren et al., Reference Lundgren, Canario, Grandinson, Lundeheim, Zumbach, Vangen and Rydhmer2010; Roehe et al., Reference Roehe, Shrestha, Mekkawy, Baxter, Knap, Smurthwaite, Jarvis, Lawrence and Edwards2010; Bouwman et al., Reference Bouwman, Bergsma, Duijvesteijn and Bijma2014). However, in some countries, genetic parameters for both effects of a trait are not available yet. For example, in the Czech Republic, piglet survival rates at birth and until weaning are treated as sow reproductive traits, whereas growth of piglets is treated as a piglet trait. Therefore, piglet survival rates were matched to maternal traits, and piglet growth was matched to direct traits in our study; however, we included two possibilities for the allocation of traits to both trait groups in our bioeconomic model and computer program. Each trait could be allocated to the maternal or direct trait group, or maternal and direct components of a trait could be defined. In the last case, separate genetic parameters had to be estimated for both trait components and inserted in the appropriate input parameter files of the program for calculation of the relative trait EWs.
For calculation of NDEs for the group of direct and maternal traits or trait components, we defined so-called realisation vectors hd and hm , respectively. A realisation vector describes the extent of the expression of a trait in the individual sex–age classes of animals, and therefore, both realisation vectors had the same dimensions as matrix P . Because MEVs of all traits (direct and maternal) were calculated per sow in the appropriate link of a breeding system in our bioeconomic model, both trait groups are realised only through sows. The realisation vector for direct traits contains non-zero elements only in columns that belong to the age class of slaughter animals (one age class for each involved breed and crossbreeds). These non-zero elements are equal to the fraction of sows of the appropriate breed and crossbreed from the total number of sows involved in the evaluated breeding (crossbreeding) system. In the realisation vector for maternal traits, the non-zero elements are in age classes of adult females of all involved breeds and crossbreeds according to age structure of sow herds in the appropriate links of the evaluated breeding system. The concrete forms of the vectors hd and hm for the three-way crossbreeding system are given in the Supplementary Material S2.
An additional step was calculation of the matrix hed with the elements hed ij , where i values are rows of the matrix (each row belongs to a direct trait i) and j values are the matrix columns (their number is equal to the dimension of the vector hd ). The elements hed ij were obtained by multiplying each jth elements of vector hd with the sum of the MEVs of the direct trait i expressed in purebred and crossbred progeny in all links of the crossbreeding system, taking into account the ratios of the number of sows in these links. Similarly, the elements hem ij of the matrix hem for maternal trait i were calculated. The EWs for a direct and maternal trait i or for the direct and maternal components of trait i (EWd i and EWm i , respectively) were then calculated as:
 $$\eqalignno{ & {\rm EWd}_{i} {\equals}\,\mathop{\sum}\limits_{j{\equals}1}^{{\rm acm}} {{\rm hed}_{{ij}} \,\,{\times}\,{\rm msum}_{j} } \cr & {\rm EWm}_{i} {\equals}\,\mathop{\sum}\limits_{j{\equals}1}^{{\rm acm}} {{\rm hem}_{{ij}} \,\,{\times}\,{\rm msum}_{j} } $$
where acm is the dimension of matrix P , that is, the total number of sex–age classes of all animal groups involved in the specified breeding (crossbreeding) system, and msum j are the elements of vector msum from equation (7). To compare the EWs of traits measured in different units, standardised EWs for direct (SEWd i ) and maternal (SEWm i ) traits i or trait components were calculated as follows:
 $$\eqalignno{ & {\rm SEWd}_{i} {\equals}\,{\rm EWd}_{i} {\times}{\rm gstdd}_{i} \cr & {\rm SEWm}_{i} {\equals}\,{\rm EWm}_{i} {\times}{\rm gstdm}_{i} $$
where gstdd i and gstdm i are the genetic standard deviations of the direct and maternal traits i or trait components, respectively. Because the standardised EWs have the same unit for all traits, they can be expressed as the percentage of the sum of all standardised EWs. Both positive and negative values can occur; therefore, it is useful to calculate the sum from the absolute values of the standardised EWs. The standardised EW of the direct (maternal) trait i or a direct (maternal) trait component expressed as the percentage of the sum of all standardised EWs for both direct and maternal traits or trait components (ewsum) are called relative EWs and are calculated as follows:
 $$\eqalignno{ & {\rm REWd}_{i} {\equals}\,100{\times}{{{\rm abs}({\rm SEWd}_{i} )} \over {{\rm ewsum}}} \cr & {\rm REWm}_{i} {\equals}\,100{\times}{{{\rm abs}({\rm SEWm}_{i} )} \over {{\rm ewsum}}} $$
where REWd i and REWm i are the relative EWs for direct and maternal trait i, respectively.
Economic weights for traits of breeds involved in the three-way crossbreeding system
The three-way crossbreeding system of the Czech National Programme for Pig Breeding with breeds Czech Large White (CLW), Czech Landrace (CL) and Pietrain (PN) was described in a previous paper by Krupa et al. (Reference Krupa, Krupová, Wolfová and Žáková2017). Therefore, only the parameters needed for the calculation of NDEs for the evaluated traits will be given here. The following traits were assumed to be direct traits: lifetime daily gain of finished animals, age of gilts at first mating, conception rate of gilts, survival rate of piglets in the nursery, survival rate of young animals after nursery, dressing percentage and lean meat content of finished animals and feed conversion of pigs in the nursery and in finishing. To the group of maternal traits, the following traits were assigned: number of piglets born alive, survival rate of piglets at birth and until weaning, conception rate of sows and productive lifetime of sows. For trait definitions, see Wolfová et al. (Reference Wolfová, Wolf, Krupová, Krupa and Žáková2017).
In the Czech National Programme for Pig Breeding, sires and dams to produce the next generation of breeding boars are selected from all age groups of boars and sows according to the estimated breeding values of animals. Therefore, the number of sex–age classes in matrix P was deduced from the age structure of boar and sow populations in each breed and crossbreed, which was calculated by Krupa et al. (Reference Krupa, Krupová, Wolfová and Žáková2017). The numbers of classes with further variables needed for the construction of matrix P and of realisation vectors hm and hd and for the calculation of NDEs for the groups of direct and maternal traits in each breed are given in Table 1. For slaughter animals, five age classes were defined, namely one class for each of the purebred slaughter animals of breeds CLW, CL and PN and one class for each of the crossbred slaughter animals of genotypes CLW×CL and (CLW×CL)×PN. Because artificial insemination is assumed for purebreeding as well as for crossbreeding, insemination doses of a boar can be used for mating in different links of the crossbreeding system. Therefore, only one group of boars in each breed was defined. Four groups of sows were involved: sows of breeds CLW, CL and PN and of the crossbreed CLW×CL. Thus, using the numbers of sire and dam age-classes given in Table 1, the total number of sex–age classes in the evaluated three-way crossbreeding system (i.e. the dimension acm of matrix P ) was 70. An investment period of 8 year was chosen because the relative NDEs for direct and maternal traits in pigs are expected to stabilise at about 8 years (Wolfová and Nitter, Reference Wolfová and Nitter2004).
Parameters used for calculation of the number of discounted gene expressions (NDEs) for maternal and direct traits for specific breeds of pigs

Breeds: CLW=Czech Large White; CL=Czech Landrace; PN=Pietrain.
1 These values represent the double values of variable p 12 in equation (4) for the appropriate breed.
2 These values divided by 100 represent the variables pdA, pdB, pdC and pdAB, respectively, which are used in the Supplementary Material S2.
To determine the importance of using the gene flow procedure for estimation of the EWs of pig traits in crossbreeding systems, the absolute approximate EWs of traits calculated by Krupa et al. (Reference Krupa, Krupová, Wolfová and Žáková2017) for the same three-way crossbreeding system were compared with EWs of traits calculated here. The approximate trait EWs were originally calculated per sow of each breed; therefore, they were first converted to be expressed per the same base as was used in this study, namely per sow in the whole crossbreeding system. Then, the relative approximate EWs were calculated by applying equation (10). Both the approximate absolute and approximate relative EWs were compared with the absolute EWs and relative EWs calculated here.
Results
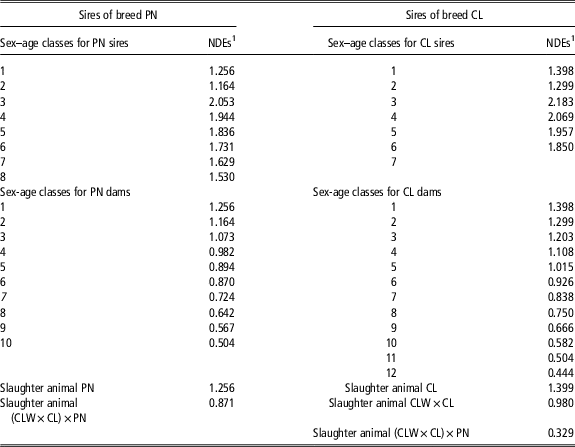
The total NDEs summarised during the investment period of 8 years and discounted with the half-year discount rate of 2% were calculated for breeding males and females in age class 2. Selection of animals in these age classes in nucleus herds according their own growth performance and parental breeding values was only assumed in the analysed breeding system. In Table 2, the vectors msum are given for sires of breeds CL and PN as examples. Czech Landrace boars were used for purebred mating in populations of CL sows and for crossbred mating with sows of breed CLW. Pietrain boars were used for purebred mating in herds with PN sows and for crossbred mating in population with crossbred sows of genotype CLW×CL. The vectors msum show the cumulative NDEs for CL and PN boars in each of the defined sex–age classes of purebred breeding progeny and in purebred and crossbred slaughter progeny in the whole crossbreeding system after the time period of 8 years. The total number of sex–age classes was 70 in our three-way crossbreeding system; in Table 2, only the main groups with non-zero values for NDEs are shown.
Cumulative number of discounted gene expressions (NDEs, half-year discount rate 2%) in all sex–age classes at the end of the 8-year investment period for sires of pig breeds Czech Landrace (CL) and Pietrain (PN) in the second age class

1 The NDEs are given per animal for the given sex–age class for sires and dams and per sow of the appropriate breed for slaughter animals.
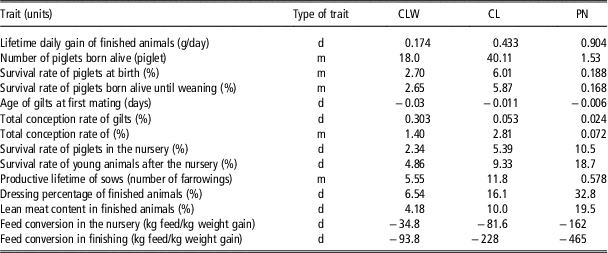
Absolute EWs of traits for the three breeds (CLW, CL and PN) are summarised in Table 3. Increases in the average levels of the same trait in the three breeds caused different changes in the profit per sow in the whole crossbreeding system after 8 years. For example, raising the average number of live-born piglets per litter by one piglet in the breed CLW increased the profit by 18 € per sow, whereas the same increase in the breed CL increased the profit by 40 €; notably, the profit was only increased by 1.50 € in the breed PN. Importantly, changes in feed conversion resulted in the greatest change in profit in the breed PN (465 € v. 228 € in the breed CL and only 94 € in the breed CLW).
Absolute economic weights of direct (d) and maternal (m) traits for the three pig breeds involved in the three-way crossbreeding system (in € per unit of the trait, per sow in the whole crossbreeding system and per investment period of 8 years)

Breeds: CLW=Czech Large White; CL=Czech Landrace; PN=Pietrain.
The high economic impact of improved feed efficiency (and other direct traits) in the PN breed was caused by the observations that most finished pigs were produced in commercial herds and that half of the genes of the finishers came from PN boars. Owing to high production of insemination doses per PN boar, each PN sire had a high number of finished progeny, that is, had higher cumulative NDEs in slaughter animals than sires of dam breeds. In contrast, maternal traits of PN sires were expressed only in replacement daughters in small nucleus PN herds; therefore, these traits had negligible economic importance. Nevertheless, the importance of these traits was not zero.
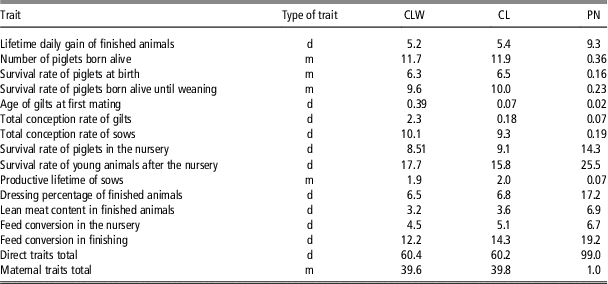
However, for selection within breeds, these absolute values of EWs are not important, and only the relative EWs of traits within a breed are of interest. These REWs are shown in Table 4. Although the absolute EWs of traits in the breed CL were about three times higher than EWs of the same traits in the breed CLW, the REWs were very similar in both breeds. Therefore, the same weighting of traits in an index for both maternal breeds CL and CLW could be applied, as is practiced in the current National Pig Breeding Programme in the Czech Republic. The relative contribution of maternal traits to the total contribution of all included traits was about 40% in both maternal breeds.
Relative economic weights (in %) of direct (d) and maternal (m) traits for the three pig breeds involved in the three-way crossbreeding system

Breeds: CLW=Czech Large White; CL=Czech Landrace; PN=Pietrain.
The economically most important trait in both dam breeds was the survival rate of young animals after the nursery phase. However, this trait has not been evaluated in the common Czech pig breeding programme. Feed conversion in finishing and number of piglets born alive had nearly the same relative economic importance in both maternal breeds CL and CLW. Furthermore, the most important traits in these breeds that reached about 10% of the total economic importance of all traits were sow conception rate, piglet survival until weaning and piglet survival in the nursery phase. As expected, the importance of maternal traits in the sire breed PN was negligible (1%). The most important direct traits in breed PN were survival rate of young animals after the nursery phase (25%), feed conversion in finishing (19%), dressing percentage (17%) and survival rate of piglets in the nursery (14%). Lean meat content reached about half of the importance of named traits (about 7%), which was similar to the importance of feed conversion in piglets in the nursery phase, but less than the importance of lifetime daily gain of finished animals (9%).
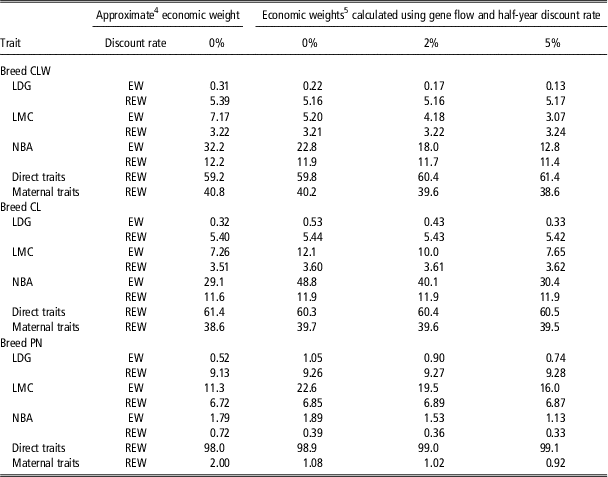
In Table 5, the absolute and the relative EWs, calculated without (approximate EWs) and with gene flow method (true EWs applying different discount rates), were compared. For clarity, these EWs were presented only for three traits, namely for lifetime daily gain in finishing, lean meat content and number of piglets born alive) and for the sums of the REWs for all maternal and direct traits evaluated in this paper. The absolute approximate EWs were always somewhat higher than the absolute true EWs calculated with the zero discount rate, although they included only one production cycle (one generation of progeny from selected animals). This was caused by the fact that the approximate EWs included numbers of gene expressions for the particular trait of both male and female breeding animals of the evaluated breeds. The true EWs given in Tables 3–5 included only the number of expressions for the given trait from breeding boars of age class 2 (young boars after selection for replacement). Nevertheless, the differences were small because the true EWs included more generations of progeny of these boars (all generations within an investment period of 8 years).
Impact of including gene flow with different discount rates in the calculation of absolute (EWFootnote 1 ) and relative economic weights (REWFootnote 2 ) for selected traits of young boarsFootnote 3 of pig breeds involved in a three-way crossbreeding system

Breeds: CLW=Czech Large White; LDG=lifetime daily gain of finished animals; LMC=lean meat content of slaughter animals; NBA=number of piglets born alive per litter; CL=Czech Landrace; PN=Pietrain.
1 EWs are given in € per sow.
2 REWs express the percentage of the EW for the given trait from the sum of the absolute values for EWs of all 14 evaluated traits.
3 The number of discounted gene expressions for the given trait calculated using gene flow and applied for the estimation of EWs is summarised for young boars selected after the performance test (i.e. boars in the second age class).
4 Approximate EWs were calculated by Krupa et al. (Reference Krupa, Krupová, Wolfová and Žáková2017) by taking into account only one generation of progeny of selected parents in all levels of the three-way crossbreeding system without discounting.
5 EWs calculated using gene flow accounted for all progeny generations of selected boars within the investment period of 8 years.
As shown in Table 5, it is also obvious that higher discount rates were associated with lower absolute EWs of traits. However, the most important finding from Table 5 was the fact that the REWs among traits and the relative importance of the complexes of maternal and direct traits did not change substantially between the calculations performed with or without application of gene flow and between calculations with or without discounting. The absolute and relative EWs of traits using the gene flow method was also calculated for breeding gilts selected after performance test. The absolute EWs of traits differed from those for breeding boars of the same breed, whereas the REWs were very similar; therefore, the results were not shown here.
Discussion
Consideration of NDEs of selected parents for specific traits is often practiced when evaluating and optimising breeding programmes in different species. Gene flow methods are generally applied for such considerations, for example, applying the ZPLAN program in German-speaking countries (Wünsch et al., Reference Wünsch, Nitter and Schüller1999). Defining a breeding objective and constructing selection indices for specific breeds while accounting the MEVs of traits for NDEs is not commonly performed, despite the publication of many scientific studies presenting calculations of NDEs for traits in different species, for example, sheep (Amer, Reference Amer1999), dairy cattle (Berry et al., Reference Berry, Madalena, Cromie and Amer2006) and pigs (Amer et al., Reference Amer, Ludemann and Hermesch2014). However, accounting for the time delay between parent selection and trait expressions (applying generation discounting factor in gene flow) is expected to be most important in species with long generation intervals (beef and dairy cattle). In pigs and other species with short generation intervals, this accounting would have only a small impact on relative EWs of maternal and direct traits, as shown in this study or by Wierzbicki et al. (Reference Wierzbicki, Peura, Filistowicz and Przysiecki2007).
A direct comparison of the NDEs or the absolute EWs for comparable traits and breeds in a specific breeding system, as calculated by different research groups and in the present study using the gene flow method, is difficult owing in part to differences in the definition of NDEs and in the base to which the MEVs of a trait are considered. For example, Amer et al. (Reference Amer, Ludemann and Hermesch2014) and Hermesch et al. (Reference Hermesch, Ludemann and Amer2014) expressed MEVs of sow traits (i.e. maternal traits) per farrowing and MEVs for performance and survival traits of growing pigs in finishing (i.e. direct traits) per slaughter animal. The NDEs for the maternal traits included then the number of farrowings per replacement gilt, and NDEs for the direct traits included the number of finished animals per farrowing. A similar definition of NDEs for production and reproductive traits in beef and dairy cattle was used by Berry et al. (Reference Berry, Madalena, Cromie and Amer2006). All absolute EWs of maternal and direct traits obtained by Amer et al. (Reference Amer, Ludemann and Hermesch2014) and Hermesch et al. (Reference Hermesch, Ludemann and Amer2014) were then expressed per replacement gilt.
In our model, all trait MEVs were expressed per sow and included the number of progeny that expressed the appropriate trait per sow per reproductive cycle. Thus, a part of the value for NDE calculated in previous studies for a comparable trait in pigs was already included in the value for MEV for this trait. The NDEs calculated in our models using gene flow methods included only the number of gene expressions for the traits in subsequent generations of sows during a defined investment period of a breeding or a crossbreeding system. Differences in trait MEVs among different studies also reflect different cost structures in pig production systems of specific country.
Further differences between the approach for the calculation of MEVs, NDEs and EWs of traits between the present paper and previous studies include differences in the production units used for the calculations. For example, MEVs for pig traits were mostly calculated only within commercial herds, that is, in herds with crossbred sows, when applying crossbreeding (Houška et al., Reference Houška, Wolfová and Fiedler2004, Amer et al., Reference Amer, Ludemann and Hermesch2014). In contrast, in the model described by Wolfová et al. (Reference Wolfová, Wolf, Krupová, Krupa and Žáková2017), the MEVs of all traits were calculated in commercial herds and in purebred nucleus and multiplier herds of breeds subjected to a particular breeding system. The MEVs expressed per sow in each production unit were then multiplied with the appropriate NDEs for the appropriate selection path (sires and dams) of specific breeds in these units.
This approach is mainly important for breeding (crossing) systems that are not optimised with respect to the number of sows of a particular breed. This is the case in the Czech Republic; specifically, in the Czech National Programme for Pig Breeding, the number of sows in purebred populations of the three-way crossbreeding system accounts for 16% of the total number of sows in this system, whereas in the optimised system, this value is typically around 6% to 7% (Wünsch et al., Reference Wünsch, Nitter and Schüller1999).
Amer (Reference Amer1999) and Kearney et al. (Reference Kearney, Amer and Villanueva2005) demonstrated the effects of discount rate on NDEs for different traits. As expected, the values of NDEs and connected absolute EWs of traits decreased as the discount rate increased. This was confirmed in our paper (Table 5). However, as shown by Wolfová and Nitter (Reference Wolfová and Nitter2004), the relative NDEs for maternal and direct traits were strongly affected by the value of the discount rate only in species with long generation intervals, namely in cattle and sheep. Changing the discount rate from 0% to 28% altered the relative NDEs for maternal and direct traits in dam breeds by ~17 and 37 percent points in sheep and cattle, respectively, but only by <3 percent points in pigs (Wolfová and Nitter, Reference Wolfová and Nitter2004). These changes in the relative importance of traits in our study were even lower because of the lower discount rate. Wierzbicki et al. (Reference Wierzbicki, Peura, Filistowicz and Przysiecki2007) reported similar results for the arctic fox, which has a relatively short generation interval comparable to that of pigs, thereby mitigating the influence of the discount rate on REWs.
The present results were obtained for the relative importance of traits in pig breeds involved in the nonoptimised three-way crossbreeding system in the Czech Republic. For this system, the gene-flow method can be foregone when estimating the relative economic importance of traits for involved pig breeds. However, these results may not be valid in purebred breeding systems or other pig crossbreeding systems. Moreover, different results can be expected when different groups of boars are used for purebreeding in nucleus herds and for crossbreeding in multiplier and commercial herds. In the crossbreeding system evaluated in the present study, the same boars were used for mating in all production levels because artificial insemination was performed for all crossings in this system. For natural mating, which is often performed at small holder farms in developed countries and accounts for the time delay with high discount rate arising from high-risk aversion of farmers, we would expect to come to different conclusions. Therefore, according to our opinion, further analysis of production and economic factors affecting the relative EWs of pig traits (when calculating them by applying gene-flow) in different breeding and crossbreeding systems is necessary.
In summary, the developed programs EWPIG2 and GFPIG facilitated these analyses with low effort in terms of time and cost because these programs enabled us to perform calculations for different breeding systems with different management and mating options.
Acknowledgements
This study was financially supported by the research project MZE-RO0718-V003 of the Ministry of Agriculture of the Czech Republic.
Declaration of interest
There are no conflicts of interest to declare.
Ethics statement
No work carried out for this research was subject to approval of an ethics committee.
Software and data repository resources
The described gene flow procedure was implemented in a computer program (GFPIG) written in the C programming language for Linux. GFPIG can be run together with the new version of the previous program for the calculation of MEVs of pig traits (EWPIG2) to calculate EWs for direct and maternal pig traits. Both programs, including two detailed manuals (Wolfová et al., Reference Wolfová, Wolf, Krupa, Krupová and Žáková2016), are freely available on request from the authors.
Supplementary material
To view supplementary material for this article, please visit https://doi.org/10.1017/S1751731118002513