

Introduction
O'Shannassy (Reference O'Shannassy2015) argues that firm strategy is vital to advancing societal welfare, helping to solve economic and broader social challenges. In fact, early work in the field intimated that firm strategy accounts for broader concerns, beyond those of self-interested profitability, to include the social responsibilities of the firm (Andrews, Reference Andrews1971; Carroll & Hoy, Reference Carroll and Hoy1984; Learned, Christensen, Andrews, & Guth, Reference Learned, Christensen, Andrews and Guth1965). However, as the field of strategy evolved and economic theories and methods began to create a more scientific approach (Conner, Reference Conner1991; Durand, Grant, & Madsen, Reference Durand, Grant and Madsen2017; O'Shannassy, Reference O'Shannassy2017), research took on a decidedly quantitative focus to answer a fundamental question: why do some firms perform better than others (Misangyi, Elms, Greckhamer, & Lepine, Reference Misangyi, Elms, Greckhamer and Lepine2006; Rumelt, Schendel, & Teece, Reference Rumelt, Schendel and Teece1994). Firm performance thus becomes a key focus. To be sure, in the last 10–20 years, corporate social responsibility (CSR) has garnered attention in the strategy literature; however, a parallel theme has emerged in that the research has focused on the relationship between CSR and firm performance (Orlitzky, Louche, Gond, & Chapple, Reference Orlitzky, Louche, Gond and Chapple2017; Orlitzky, Schmidt, & Rynes, Reference Orlitzky, Schmidt and Rynes2003). Such research has left short an understanding, empirically, about the extent to which firm strategy is linked with CSR. Yet, there is a guidance offering a way forward to fill this gap.
In his seminal work, Freeman (Reference Freeman1984) conceptualised the role of strategy and strategic management as a practice that accounts for a firm's stakeholders – one not just focused on shareholders who care about maximizing their returns. Here, firm profitability is not the sole objective. More specifically, stakeholder theory argues that for a firm to thrive and survive, accountability and action towards a broad set of actors is required (Clarkson, Reference Clarkson1995; Freeman, Reference Freeman1984). The theory posits that as firms effectively serve and steward stakeholders' interests, they will remain willing participants in firms' business ecosystems (Donaldson & Preston, Reference Donaldson and Preston1995; Freeman, Reference Freeman1984; Stout, Reference Stout2012), resulting in the material (e.g., capital) and immaterial (e.g., knowledge, skills) resources needed for ongoing survival. One way a firm can effectively serve and steward stakeholders' interests is through the demonstration of CSR (Carroll, Reference Carroll1991, Reference Carroll2004; Guibert & Roloff, Reference Guibert and Roloff2017; Sciarelli & Tani, Reference Sciarelli and Tani2015). CSR refers to a set of voluntary actions and practices that extend beyond the economic and legal requirements of firm activity (Barnett, Reference Barnett2007; Gras & Krause, Reference Gras and Krause2020; Matten, Crane, & Chapple, Reference Matten, Crane and Chapple2003). Voluntary CSR targeted at stakeholders include ethical (e.g., abiding by moral rules) and discretionary (e.g., investing in employee training) actions and practices (Carroll, Reference Carroll1979, Reference Carroll1991, Reference Carroll2004). Following the theory, the expectation is that given a focus on stakeholders (Freeman, Reference Freeman1984), strategy will account for CSR. However, there may be complications.
Ideally, all firms would have strategies that not only lead to the generation of superior profits, but that enable them to be model corporate citizens by demonstrating excellence in CSR. However, firms have to face the reality of ruthless competitive markets, resource scarcity and the struggle to generate profits to survive, all while accounting for the fact that CSR is not cost-free (Friedman, Reference Friedman1970; Henderson, Reference Henderson2005). In this sense, there is some question as to what extent strategy can diffuse its focus towards multiple stakeholders, attempting to create value across a broad cohort of actors, and yet remain viable and sustainable (Jensen, Reference Jensen2001). This raises a question as to what extent strategy is linked to CSR. For example, Porter (Reference Porter1980) demonstrates that to achieve an advantage, firms position themselves against competitors by pursuing either low-cost or differentiation strategies, whereby tailored resource allocations are made to achieve the chosen position. Tailored resource allocations to a specific type of strategy require trade-offs (Porter, Reference Porter1980, Reference Porter1996), which could potentially undermine the extent to which a broader cohort of stakeholders are addressed, and therefore limit engagement in CSR.
Alternatively, regardless of resource allocation trade-offs, there may be contingent factors that otherwise create greater attention to stakeholders, thereby strengthening the relationship between strategy and CSR. Managers have limited attention (Ocasio, Reference Ocasio1997), hindering the extent to which they can give needed focus to stakeholders and the requirement of demonstrating CSR to secure their ongoing support. However, the literature demonstrates that when used, a performance management system (PM system) creates attention to and measurement of nonfinancial outcomes, including those related to CSR (Bento, Mertins, & White, Reference Bento, Mertins and White2017; Franco-Santos, Lucianetti, & Bourne, Reference Franco-Santos, Lucianetti and Bourne2012; Hansen & Schaltegger, Reference Hansen and Schaltegger2016, Reference Hansen and Schaltegger2018). Hence, we contend that while different strategies may more or less impact on CSR, a PM system is likely to shape the relationship. Understanding how strategy and a PM system interact would shed light on the extent to which firms demonstrate CSR. Yet, no research, to our knowledge, has explored a PM system as a possible contingent factor although there have been calls in the literature to do so (e.g., Bento, Mertins, & White, Reference Bento, Mertins and White2017; Hansen & Schaltegger, Reference Hansen and Schaltegger2016, Reference Hansen and Schaltegger2018).
Motivated by these research gaps, our study makes a few key contributions. First, we rely on Porter's (Reference Porter1980) strategy typology. Porter's (Reference Porter1980) strategy types are among the most studied in the literature and this is something we extend here – in a new way. Specifically, we seek to determine if low-cost and differentiation strategies are linked to CSR. We therefore extend insight beyond the much studied strategy–firm performance relationship by accounting for a firm's social responsibilities as our outcome variable. This level of research is important because strategy is believed to have profound implications for stakeholders and society (Freeman, Reference Freeman1984; Galbreath, Reference Galbreath2006; Reference Galbreath2009; Porter, Reference Porter2006; O'Shannassy, Reference O'Shannassy2015).
Second, there is a debate in the literature over the measurement of CSR. According to recent views, CSR should be considered multidimensional (as opposed to unidimensional) and includes only actions and practices that are voluntary (Barnett, Reference Barnett2007; Gras & Krause, Reference Gras and Krause2020; Orlitzky et al., Reference Orlitzky, Louche, Gond and Chapple2017; Reimer, Van Doorn, & Heyden, Reference Reimer, Van Doorn and Heyden2018; Wang, Tong, Takeuchi, & George, Reference Wang, Tong, Takeuchi and George2016); thus, we rely on individual aspects of CSR. Following Carroll's (Reference Carroll1979) seminal work and well-used conceptualisation, we rely on the ethical and discretionary dimensions, as these two are considered voluntary (Carroll, Reference Carroll1979, Reference Carroll1991, Reference Carroll2004). In this way, we not only disaggregate our measure in lieu of previous studies, but respond to calls in the literature to more deeply theorise around the effects of strategy on individual aspects of CSR, as different strategies may have different effects on CSR.
Third, we examine firms' PM systems as a contingent factor. Specifically, we determine if the relationship between strategy and CSR is shaped by a PM system. Here, we advance contingent perspectives by determining how organisational factors are interrelated with respect to impacting on CSR (Orlitzky et al., Reference Orlitzky, Louche, Gond and Chapple2017; Rowley & Berman, Reference Rowley and Berman2000). If PM systems help advance nonfinancial outcomes and stakeholder interests, then understanding the value of the construct in terms of both theoretical advancement and empirical verification takes on significance (Franco-Santos, Lucianetti, & Bourne, Reference Franco-Santos, Lucianetti and Bourne2012).
Lastly, CSR is expected to offer many potential benefits (Barnett, Reference Barnett2019; Donaldson & Preston, Reference Donaldson and Preston1995; Galbreath, Reference Galbreath2010; Kurucz, Colbert, & Wheeler, Reference Kurucz, Colbert, Wheeler, Crane, McWilliams, Matten, Moon and Siegel2008; Orlitzky, Schmidt, & Rynes, Reference Orlitzky, Schmidt and Rynes2003; Tantalo & Priem, Reference Tantalo and Priem2016). As such, the topic continues to generate strong interest among management practitioners. Our study provides empirical evidence as to how management's choice of strategy (and the extent to which they emphasise PM systems) could drive CSR.
Theory and hypotheses
Low-cost strategy and CSR
Strategy is concerned with the actions and choices firms take to position in markets to achieve superior outcomes, including those related to CSR (Mintzberg, Reference Mintzberg1978; Porter, Reference Porter1996, Wood, Reference Wood1991). According to Porter (Reference Porter1980), firms' strategies incorporate efficiency, highly productive asset use and tight control of discretionary expenses. However, strategy is also about the basis of creating value in a unique way and while this does not allow a firm to ignore costs, cost control is not the overarching ingredient. To that end, he specifies two main strategy types: low cost and differentiation. Essentially, firms pursuing a low-cost strategy aim to compete with a lower cost structure than competitors and, in fact, must do so to build and maintain an advantage and generate superior profits. Here, a firm attempts to find and exploit all possible sources of cost advantage, while reducing discretionary expenses (Porter, Reference Porter1980, Reference Porter1996). Alternatively, firms pursuing a differentiation strategy aim to operate in a unique way relative to competitors. Implementing a differentiation strategy entails higher costs because creating uniqueness generally requires higher quality, market-based innovation or other dimensions that increase expenses (Porter, Reference Porter1980, Reference Porter1996); therefore, firms can and do charge premium prices.
A low-cost strategy could be problematic with respect to CSR that involves ethical considerations. For example, low-cost strategies are more likely to involve tight control over labour (e.g., less labour but the push for higher employee productivity, lower wages), the sourcing of inputs potentially produced under exploitative conditions, be more prone to socializing production costs to the greatest extent possible, while imposing un-priced externalities on society (Jones, Reference Jones1999). Such actions and activities could, for example, involve shifting sourcing and production to countries with fewer health and safety protections for workers or protections for the natural environment. In this sense, following stakeholder trade-off theorists (Jensen, Reference Jensen2001), firms with low-cost strategies are likely to favour shareholders, while they are willing to sacrifice the interests of other stakeholders in the pursuit of efficiency and performance. In fact, there is evidence to suggest that firms with low-cost strategies breach or ignore ethical considerations, particularly stakeholders in the supply chain and other stakeholders such as employees (e.g., Andersen & Skjoett-Larsen, Reference Andersen and Skjoett-Larsen2009; Boyd, Spekman, Kamauff, & Werhane, Reference Boyd, Spekman, Kamauff and Werhane2007; Gugler & Shi, Reference Gugler and Shi2009; Hughes, Reference Hughes2011; Park & Dickson, Reference Park and Dickson2008). Given the sharp focus on cost control, we argue for the possibility that firms with low-cost strategies could potentially neglect, overlook or otherwise ignore ethical considerations that are of interest to stakeholders. Although this might not always be the case, in general, we posit that:
Hypothesis 1: A low-cost strategy is negatively associated with ethical CSR.
Low-cost strategies also require minimisation of discretionary expenses (Porter, Reference Porter1980, Reference Porter1996). For example, control of discretionary resources could mean that some stakeholders are disadvantaged. For example, employees may receive minimal, if no benefits (e.g., paid training, health benefits), while communities may miss out on philanthropic or other investments that would otherwise advance their interests. Further, customers may not be able to enjoy the latest product technology as R&D costs are minimised. As Porter (Reference Porter1980) notes, low-cost strategies require tight cost and overhead control and cost minimisation in innovation activities such as R&D. The aim of a low-cost strategy therefore requires a continual focus on cost reduction and high levels of efficiency and productivity (Porter, Reference Porter1996). Others argue that because socially responsible practices, such as those that are discretionary, are a cost to the business (Hong, Kubik, & Scheinkman, Reference Hong, Kubik and Scheinkman2012; Wood & Jones, Reference Wood and Jones1995), firms pursuing a low-cost strategy are likely to have little financial room to engage in such practices as this disrupts their ability to continuously commit to cost reductions. As low-cost strategies largely focus on cost reduction and high levels of efficiency in order to maximise profits (Porter, Reference Porter1980, Reference Porter1996), discretionary expenses must be tightly controlled, if not eliminated. In this case, shareholders are likely to benefit at the expense of other stakeholders and therefore investment in discretionary CSR is minimised. Therefore:
Hypothesis 2: A low-cost strategy is negatively associated with discretionary CSR.
Differentiation strategy and CSR
Differentiation strategies involve establishing a firm as different in a positive way. While the means and mechanisms of differentiation are many, one could be investment in and emphasis on CSR. Because a differentiation approach is based on adding value rather than on minimizing cost, this could, for example, open up the possibility of ethical treatment of suppliers (e.g., making sure suppliers are treated fairly and are paid well for quality inputs), treating employees as a source of value-added rather than as an expense or addressing community needs as a basis for positive differentiation in the marketplace. Firms pursuing a differentiation strategy might also place higher value or stricter adherence to ethical practices, because the reputational – if not financial – costs and risks of unethical behaviour can be too high to their strategy (Fan, Reference Fan2005). In fact, firms pursuing differentiation strategies are expected to view CSR as a means not only to prevent or eliminate negative attention from stakeholders such as employees, customers and communities, but also to improve their product image, signalling quality and trustworthiness (McWilliams & Siegel, Reference McWilliams and Siegel2001). In this sense, ethical practices can lead to a demonstration of honesty and transparency, which helps build mutual trust with stakeholders leading to higher value-add and differentiation from competitors (Barney & Hansen, Reference Barney and Hansen1994; Galbreath, Reference Galbreath2009). Hence:
Hypothesis 3: A differentiation strategy is positively associated with ethical CSR.
Differentiation strategies are also likely to more readily engage in discretionary resource allocations. For example, firms with differentiation strategies may build unique features into products that demonstrate socially responsible attributes to important stakeholders such as customers. Such efforts may create distinguishing opportunities for differentiators relative to their competitors. Similarly, discretionary resource allocations such as R&D investment can positively affect a firm's socially responsible business practices (e.g., development of environmental-friendly products that customers value and are willing to pay more for) (Choi & Ng, Reference Choi and Ng2011). As resources are allocated to CSR in order to fulfil a differentiation strategy logic, there is evidence to suggest that firms benefit from decreased employee turnover, improved reputation with external stakeholders and increased satisfaction and purchase intent from customers (Choi & Ng, Reference Choi and Ng2011; Galbreath, Reference Galbreath2010). However, while such discretionary investments in CSR are expected to satisfy stakeholders, they are not cost-free (Hong, Kubik, & Scheinkman, Reference Hong, Kubik and Scheinkman2012; McWilliams & Siegel, Reference McWilliams and Siegel2001; Wood & Jones, Reference Wood and Jones1995); therefore, they are more likely a representative of differentiation than low-cost strategies as a differentiation strategy is less concerned with strictly controlling costs (Porter, Reference Porter1980, Reference Porter1996). Thus:
Hypothesis 4: A differentiation strategy is positively associated with discretionary CSR.
The moderating effect of a PM system
PM systems have become a popular tool or framework to help firms orchestrate organisational resources to achieve financial and nonfinancial objectives (Franco-Santos, Lucianetti, & Bourne, Reference Franco-Santos, Lucianetti and Bourne2012). PM systems allow firms and their managers to establish and assess links between strategy, execution and value creation (Melnyk, Stewart, & Swink, Reference Melnyk, Stewart and Swink2004). PM systems also permit firms to influence employee behaviour to achieve the desired objectives of firm strategy (Hall, Reference Hall2008; Koufteros, Vergheses, & Lucianetti, Reference Koufteros, Vergheses and Lucianetti2014). In this sense, a PM system has been described as an ambidextrous system that firms use to both monitor and control organisational resources and influence employees towards desired behaviours (Kaplan & Norton, Reference Kaplan and Norton2008; Koufteros, Vergheses, & Lucianetti, Reference Koufteros, Vergheses and Lucianetti2014). We argue that a PM system may shape the relationship between firm strategy and CSR.
In the case of low-cost strategies, the emphasis is on cost control (Porter, Reference Porter1980, Reference Porter1996). Here, we recognise, however, that the relationship between a low-cost strategy and CSR could be shaped positively – under certain circumstances. For example, a PM system focused on shareholders would be expected to drive behaviour and decision making with respect to efficiency and cost control in a firm with a low-cost strategy. However, modern PM systems rarely account for a single stakeholder (Bento, Mertins, & White, Reference Bento, Mertins and White2017; Franco-Santos, Lucianetti, & Bourne, Reference Franco-Santos, Lucianetti and Bourne2012; Hansen & Schaltegger, Reference Hansen and Schaltegger2016, Reference Hansen and Schaltegger2018). A PM system that accounts for stakeholders beyond just shareholders likely expands the attention of firms with low-cost strategies – beyond just the bottom line. Because a PM system is a mechanism used to both monitor and control organisational resources and influence employees towards desired behaviours (Kaplan & Norton, Reference Kaplan and Norton2008; Koufteros, Vergheses, & Lucianetti, Reference Koufteros, Vergheses and Lucianetti2014), in cases where they have a broader stakeholder focus, the expectation is that firms with low-cost strategies are likely to take greater notice of those stakeholders – and their expectations of socially desirable behaviour. While we recognise this could run counter to the objectives of a low-cost strategy, nonetheless, as a PM system accounts for a broader stakeholder base, this shapes how stakeholders are addressed (Brignall, Reference Brignall2002; Gardiner, Reference Gardiner2002; Länsiluoto & Järvenpää, Reference Länsiluoto and Järvenpää2008; Parisi, Reference Parisi and Taticchi2010), likely leading to at least some level of increased emphasis on CSR. Hence:
Hypothesis 5: A PM system with a broad stakeholder focus positively moderates the negative association between a low-cost strategy and ethical CSR.
Hypothesis 6: A PM system with a broad stakeholder focus positively moderates the negative association between a low-cost strategy and discretionary CSR.
A firm with a differentiation strategy seeks to be unique in a way that enables them to ‘stand out’ from the competition such that they target and attract a customer base willing to pay premium prices for their offered products and/or services. To achieve such uniqueness, differentiation strategies rely on aspects such as quality, advanced engineering, superior reputations, outstanding customer service and customer intimacy, strong commitment to relationship management (e.g., with employees, regulators, suppliers) and high levels of credibility, among others (Porter, Reference Porter1980, Reference Porter1996). Such aspects rely on expertise in stakeholder management.
More specifically, because firms with differentiation strategies seek to achieve a competitive advantage through their uniqueness (Porter, Reference Porter1980), they are likely to recognise that CSR can strengthen their advantage (Figge, Hahn, Schaltegger, & Wagner, Reference Figge, Hahn, Schaltegger and Wagner2002; Johnson, Reference Johnson1998; McWilliams & Siegel, Reference McWilliams and Siegel2001; Schneider & Vieira, Reference Schneider and Vieira2010). This is because CSR can translate into, for example, a better image or reputation (McWilliams & Siegel, Reference McWilliams and Siegel2001), as well as signal quality and trustworthiness (McWilliams & Siegel, Reference McWilliams and Siegel2001). Given that PM systems with a broad stakeholder focus emphasise attention to employees, customers, suppliers and government or regulatory authorities (Cousins, Lawson, & Squire, Reference Cousins, Lawson and Squire2008; Mahama, Reference Mahama2006; Simons, Reference Simons1991), they are likely to increase the extent to which firms with differentiation strategies can translate their actions into an enhanced image, reputation, quality or trustworthiness. In this sense, a PM system that offers provision for a broad stakeholder base is likely to magnify the relationship between a differentiation strategy and CSR (cf. Jamali, Reference Jamali2008; Sundin, Granlund, & Brown, Reference Sundin, Granlund and Brown2010). Therefore:
Hypothesis 7: A PM system with a broad stakeholder focus positively moderates the positive association between a differentiation strategy and ethical CSR.
Hypothesis 8: A PM system with a broad stakeholder focus positively moderates the positive association between a differentiation strategy and discretionary CSR.
Methods
Sample and data collection
The sampling frame included Italian for-profit companies listed on the Aida-Bureau van Dijk database. Our data collection procedure consisted of two parts. For the collection of data on CSR and PM systems (and one of our control variables), an online survey was used. Second, for the strategy and the remaining control variables, secondary data were collected. As for the survey, in order to obtain a target participant list, first, we contacted each firm's management directly by phone to select a list of companies willing to cooperate with our research. Second, we identified and targeted high-level executives (e.g., CEOs, CFOs) as well as controllers and managers (e.g., managing directors, operations managers) to complete the survey as the positional levels of these individuals increases the likelihood that our participants possess substantive and specific knowledge as it pertains to their CSR and PM systems. Lastly, names and email addresses of our potential participants were obtained during phone conversations with the firms.
The survey was created, managed and submitted to our target participants using Qualtrics (https://www.qualtrics.com), a web-based system to conduct online survey research. Prior to receiving a web link, participants were sent an introductory letter clarifying the purposes and objectives of the research project. The participants were also promised a benchmark report allowing them to compare their responses to those of other participating organisations. Of the 1,334 firms surveyed, 280 responses from 229 unique firms were collected, yielding a response rate of 17%. With respect to the participants, nearly 60% have a bachelor's degree and 26% have a postgraduate degree. Regarding age and gender, 51% are 43 years old or younger, while 87% are male. Job functions include a mix of chief financial officers (CFOs), controllers, executive directors and managers, and other managers (e.g., sales manager, financial manager, HR manager). Lastly, the mean firm age is 47 years old, while industries include auto manufacturing, gas services, retailing and retail services, clothing manufacturing, printing services, information technology/telecommunications, industrial manufacturing, consumer products manufacturing, biotechnology, accounting/consultancies and media.
In cases where there were two responses, interrater reliability tests revealed an average π of 0.884 across the scales, which is acceptable (Hackston & Milne, Reference Hackston and Milne1996). Hence, responses were combined and the mean taken. Further, for cases where there were more than two responses, within-group agreement was tested by computing rWG(J), obtaining a median value of 0.913 across the scales. Given these results exceed rules for aggregation (Brown & Hauenstein, Reference Brown and Hauenstein2005), responses were aggregated for analysis and the mean taken.
Dependent variables
CSR is voluntary in nature (Barnett, Reference Barnett2007; Carroll, Reference Carroll1979, Reference Carroll1991; Gras & Krause, Reference Gras and Krause2020; Matten, Crane, & Chapple, Reference Matten, Crane and Chapple2003) and is conceptualised as including economic, legal, ethical and discretionary dimensions (Carroll, Reference Carroll1979, Reference Carroll1991, Reference Carroll2004). According to Carroll (Reference Carroll1979, Reference Carroll1991), the ethical and discretionary practices are considered to be the voluntary aspects of CSR (the other two practices, economic and legal practices, are considered to be obligatory). Carroll (Reference Carroll1979, Reference Carroll1991, Reference Carroll2004) defines ethical responsibility as abiding by moral rules that define appropriate behaviours in society and that meet stakeholder expectations for ethical behaviour. Discretionary responsibilities refer to business practices (e.g., employee training, philanthropic contributions) that are not required by law or are not mandated, but are expected by stakeholders as a demonstration of good citizenship (Carroll, Reference Carroll1979, Reference Carroll1991, Reference Carroll2004). In order to measure the two CSR dimensions in our study, we relied on items adapted from Maignan and Ferrell (Reference Maignan and Ferrell2000, Reference Maignan and Ferrell2001) and Maignan, Ferrell, and Hult (Reference Maignan, Ferrell and Hult1999), who robustly tested and validated both dimensions.
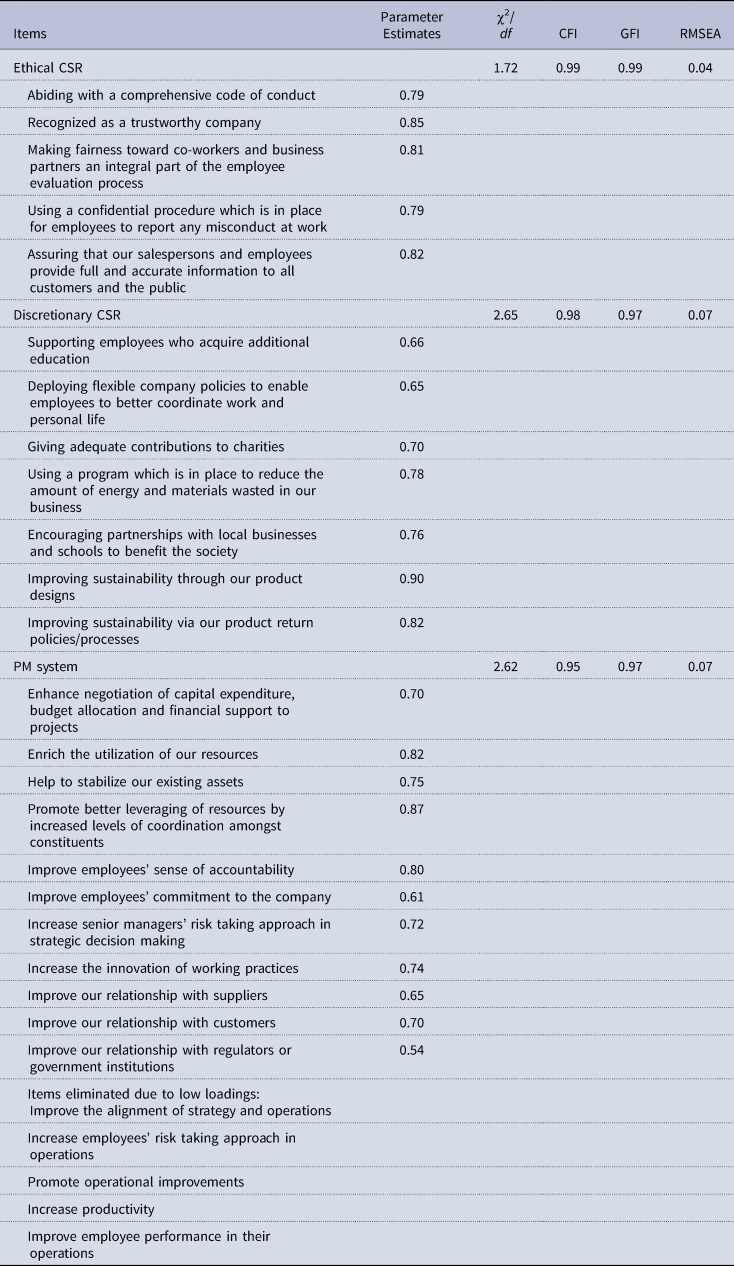
For ethical CSR, the scale consisted of five items (Table 1). Confirmatory factor analysis (CFA) suggests a good fit to the data. The CFI is 0.99, the GFI is 0.99 and the RMSEA is 0.04. The Cronbach α is 0.89. For discretionary CSR, the scale consisted of seven items (Table 1). CFA is acceptable, with a CFI of 0.98, GFI of 0.97 and an RMSEA of 0.07. The Cronbach α is 0.91. For both CSR scales, participants were asked to rate their practices compared to those in their industry on a 6-point Likert scale, ranging from ‘well below average’ to ‘well above average’.
Items and fit statistics of main constructs

Independent variables
In order to avoid common method bias by collecting our data solely from a survey, we chose to collect secondary data to create proxy measures for both low-cost and differentiation strategies, which is relatively common practice (e.g., David, Hwang, Pei, & Reneau, Reference David, Hwang, Pei and Reneau2002; Hambrick, Reference Hambrick1983; Nair & Filer, Reference Nair and Filer2003). Data were collected for each firm from the Aida-Bureau van Dijk database based on available data.
Firms with low-cost strategies must achieve strength in operational efficiency and asset turnover (Porter, Reference Porter1980; Selling & Stickney, Reference Selling and Stickney1989). Following previous studies on a low-cost strategy (Balsam, Fernando, & Tripathy, Reference Balsam, Fernando and Tripathy2011; Banker, Mashruwala, & Tripathy, Reference Banker, Mashruwala and Tripathy2014; Yamakawa, Yang, & Lin, Reference Yamakawa, Yang and Lin2011), we created a reversed index which included the combination of three ratios: (1) cost efficiency, measured by the cost of goods sold over total revenue; (2) capital intensity, measured by the ratio of total assets to total revenue; and (3) capital expenditure, measured by net investment in plant and equipment over total revenue. For differentiation strategy, a key factor to consider is the ability to offer high-quality and innovative products and services in an effort to distinguish against rivals (David et al., Reference David, Hwang, Pei and Reneau2002; Hambrick, Reference Hambrick1983; Porter, Reference Porter1980). Hence, following previous studies on a differentiation strategy (David et al., Reference David, Hwang, Pei and Reneau2002; Hambrick, Reference Hambrick1983; Nair & Filer, Reference Nair and Filer2003), we include R&D intensity, measured by expenditure on R&D over total revenue and the book value of patents and intellectual property rights over total revenue. Given that for each indicator the denominator is shared, we aggregated them to capture proxy measures of low-cost and differentiation strategies. Aggregated measures also offer an easier interpretation of the resultsFootnote 1.
Moderating variable
To measure PM systems, we wanted items that account for a broad range of stakeholders. According to Clarkson (Reference Clarkson1995), primary stakeholders include shareholders, customers, employees, suppliers and governments who provide infrastructures and whose laws and regulations must be obeyed. We adopt this stakeholder cohort for our study, as they are important to firms as an ongoing concern (Clarkson, Reference Clarkson1995). For measurement, we adapted items from studies including Cousins, Lawson, and Squire (Reference Cousins, Lawson and Squire2008), Mahama (Reference Mahama2006) and Simons (Reference Simons1991). Items were included that best captured a particular aspect of the stakeholder (e.g., for shareholders, we used items that focused on resource management and generating firm performance; for employees, we used items focused on accountability and risk taking, etc.).
For the scale, participants were asked to assess the extent to which their PM system guides behaviour and decision making to achieve objectives, across 16 items (Table 1), on a 6-point Likert scale ranging from ‘not at all’ to ‘to a very great extent’. In other words, firms may have a PM system in place and yet have little direct effect unless enacted or leveraged, which our scale attempted to ascertain. After scale refinement (Table 1), CFA demonstrates a good fit to the data. The CFI is 0.97, the GFI is 0.95 and the RMSEA is 0.07, all of which are acceptable. The Cronbach α for the scale is 0.92. As a check, we assessed each individual item to ensure that participants were not biased towards only shareholders or that any one stakeholder dominated the results. That is, singular stakeholder emphasis could dominate. Descriptive analysis revealed that the means of all items demonstrated at least some extent of impact suggesting, overall, PM systems in our sample have a broader stakeholder focus rather than a narrow one.
Control variables
Firms of larger size may have more discretionary resources to commit to CSR (McWilliams & Siegel, Reference McWilliams and Siegel2001; Wu, Reference Wu2006). To account for this effect, firm size was measured by the logarithm of total assets. Firms that are part of a multinational corporation (MNC) could face greater institutional pressure to account for CSR (Galbreath, Reference Galbreath2019). Greater pressure to conform to institutionalised expectations for appropriate social behaviour on the part of firms may therefore lead to higher levels of engagement in CSR. Our survey asked participants if their firm was part of an MNC, and was coded 1 if yes, 0 otherwise. Evidence suggests that firms with better financial performance tend to engage more readily in CSR because a higher level of profits can be invested in prosocial activities (Adams & Hardwick, Reference Adams and Hardwick1998; Waddock & Graves, Reference Waddock and Graves1997). To measure financial performance, we used return on assets (ROA). Firms with lower risk are believed to more readily engage in CSR because when there are low contracting costs, firms can continue to satisfy the implicit claims of external stakeholders by means of socially responsible investment (Adams & Hardwick, Reference Adams and Hardwick1998; Orlitzky & Benjamin, Reference Orlitzky and Benjamin2001). To account for risk, we used a firm's leverage, measured by debt over shareholder's equity. According to George (Reference George2005), organisational slack is the potentially utilisable resource that can be diverted or redeployed for the achievement of objectives – including those related to CSR. To measure slack, we relied on cash reserves. Due to the skewed nature of the data, a logarithm was taken. Lastly, as is common in most studies of CSR, potential industry effects were controlled by a dummy variable, where 1 = manufacturing firms, 0 = services firms. Unless noted, data were collected from the Aida-Bureau van Dijk database.
Convergent and discriminant validity
For our multi-item scales, we assessed convergent and discriminant validity. All multi-item constructs have an internal consistency (composite reliability) above 0.7 (Table 2), which is acceptable (Fornell & Larcker, Reference Fornell and Larcker1981). Discriminant validity was assessed through the technique, Average Variance Extracted (AVE) (Fornell & Larcker, Reference Fornell and Larcker1981). The AVE for each construct is greater than the minimum threshold value of 0.5, which is acceptable (Table 2). Moreover, the square root of AVE is greater for each construct than across the pairs of constructs (as noted in bold in Table 2). Given the reliability and convergent and discriminant validity of the multi-item scales, subsequent analysis was conducted using the composite average score for each construct.
Reliability, internal consistency and discriminant validity of multi-item constructs

Results
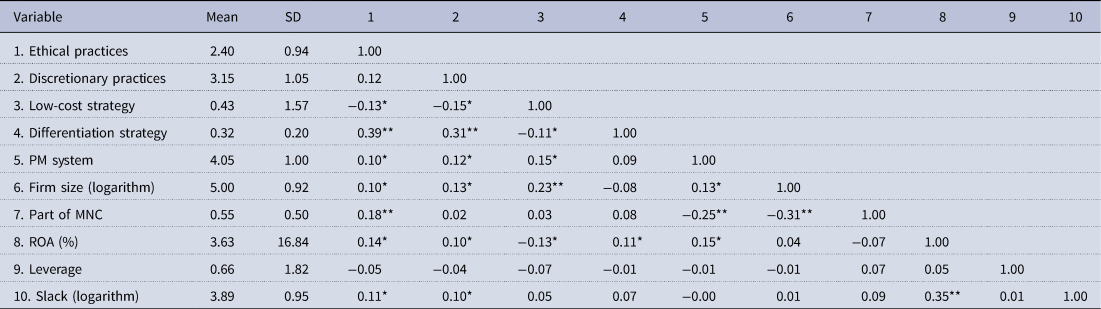
Means, standard deviations and correlations are presented in Table 3. To assess the hypotheses, moderated hierarchical regression analysis is used. Prior to analysis and to aid interpretation, the interaction variables were centred (Echambadi & Hess, Reference Echambadi and Hess2007; Iacobucci, Schneider, Popovich, & Bakamitsos, Reference Iacobucci, Schneider, Popovich and Bakamitsos2016). The highest variation inflation factor (VIF) of 2.643 (2.516) for the low-cost (differentiation) model and the lowest tolerance value of 0.378 (0.397) for the low-cost (differentiation) model is considered to be within acceptable standards (O'Brien, Reference O'Brien2007), providing evidence that multicollinearity is unlikely to be problematic.
Pearson correlations and descriptive statistics

*p = .05; **p = .01.
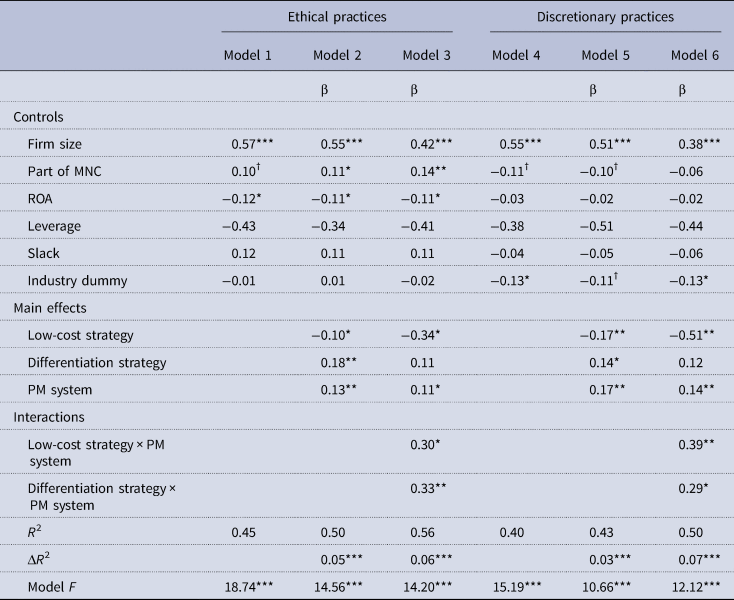
Hypotheses 1 and 2 state that a low-cost strategy is negatively associated with ethical and discretionary CSR, respectively. As shown in Table 4 Model 2, a low-cost strategy is negatively associated with ethical CSR (β = −0.10; p < .05). Similarly, as shown in Table 4 Model 5, a low-cost strategy is negatively associated with discretionary CSR (β = −0.17; p < .01). The evidence therefore suggests support for Hypotheses 1 and 2.
Regression results

†p < .10; *p < .05; **p < .01; ***p < .001.
With respect to Hypotheses 3 and 4, we predict a positive association between a differentiation strategy and ethical and discretionary CSR, respectively. The results offer support for both hypotheses. As demonstrated in Table 4 Model 2, a differentiation strategy is positively associated with ethical CSR (β = 0.18; p < .01). As demonstrated in Table 4 Model 5, a differentiation strategy is also positively associated with discretionary CSR (β = 0.14; p < .05).
Regarding the moderation hypotheses, we first predicted that a PM system will positively moderate the negative association between a low-cost strategy and ethical as well as discretionary CSR (Hypotheses 5 and 6). Table 4 Model 3 shows that the interaction term is positive and significant (β = 0.30; p < .051) with respect to ethical CSR. The results in Table 4 Model 6 show that the interaction term is positive and significant (β = 0.39; p < .01) with respect to discretionary CSR. We also find support for Hypotheses 7 and 8. The interaction term (Table 4 Model 3) between a differentiation strategy and ethical CSR is positive and significant (β = 0.33; p < .01), while the interaction term (Table 4 Model 6) between a differentiation strategy and discretionary CSR is also positive and significant (β = 0.29; p < .05). Hence, the findings suggest support for the moderation hypotheses.
Robustness test
We recognise that our study may suffer from the issue of endogeneity because CSR may not be an exogenous random variable. In order to mitigate the issue of endogeneity, we rely on the widely used instrumental variable (IV) technique (Wooldridge, Reference Wooldridge2009). Determining a proper IV is challenging but, ideally, should be one that is highly correlated with strategy while having no direct correlation with CSR. In our case, the literature has long acknowledged that the external environment influences firm strategy (Dess & Beard, Reference Dess and Beard1984; Keats & Hitt, Reference Keats and Hitt1988; Porter, Reference Porter1985). Among the more prominently studied aspects include industry munificence (the level of resource abundance and capacity to support growth), industry dynamism (the degree of instability, volatility, turbulence and degree of unpredictable change) and industry complexity (variations in the number, diversity and distribution of competitors) (Dess & Beard, Reference Dess and Beard1984; Keats & Hitt, Reference Keats and Hitt1988). All three of these aspects are expected to have an influence on firm strategy. At the same time, Gras and Krause (Reference Gras and Krause2020) demonstrate that industry complexity is not correlated with CSR; hence, we use industry complexity as our IV.
For measurement, we followed established research (Boyd, Reference Boyd1995; Haynes & Hillman, Reference Haynes and Hillman2010; Keats & Hitt, Reference Keats and Hitt1988; Palmer & Wiseman, Reference Palmer and Wiseman1999) by calculating the four-firm concentration ratio (market share – by sales – of the four largest firms in each industry scaled by the total sales of that industry) in each industry to represent our indictor of industry complexity. Using a 2SLS estimation, to confirm the validity of our instrument, Cragg and Donald's (Reference Cragg and Donald1993) instrumental-relevance (F statistic) test and Sargan's (Reference Sargan1958) over-identification test were used. The instrumental-relevance test is sufficient with an F-value of 16.89 and the over-identification test is not significant (p value = .23), indicating that our instrument is valid. In the second stage, the independent variables remain significant and in the expected directions, consistent with our primary analysis. We conclude that endogeneity does not appear to be a problem.
Discussion
Strategy is believed to have a profound impact on society and is instrumental in solving economic and social challenges. However, little empirical research has explored the link between strategy and CSR, a gap our paper intended to fill. Following stakeholder theory and the work of Michael Porter, we found that a low-cost strategy is negatively associated with our two CSR dimensions (ethical, discretionary), while a differentiation strategy is positively associated with both. Speculating that our direct relationships were likely to be shaped by contingent factors, we tested our hypothesis that PM systems moderate the predicted relationships. We found that a PM system positively moderated the negative relationship between a low-cost strategy and the two dimensions, while positively moderating the positive relationship between a differentiation strategy and the two dimensions. The results are robust after accounting for endogeneity concerns and offer a few key contributions to the literature.
First, we make an empirical contribution. A substantial body of research explores the relationship between strategy and firm performance and CSR and firm performance. Yet, given the purported impact on society (Galbreath, Reference Galbreath2006; O'Shannassy, Reference O'Shannassy2015), surprisingly little research has examined the relationship between firm strategy and CSR. Through a stakeholder lens, ours is one of the first to study the relationship between firm strategy and the ethical and discretionary dimensions of CSR. We found that a low-cost strategy has a negative effect on both ethical and discretionary CSR. Adopting the view that strategy is about choice, positioning and trade-offs (Porter, Reference Porter1980, Reference Porter1996), firms who pursue low-cost strategies are likely to face high opportunity costs (e.g., stakeholder support, social reputation) with respect to the extent to which they engage in voluntary practices that address social responsibilities (cf. Parent & Deephouse, Reference Parent and Deephouse2007). Alternatively, our results demonstrate that a differentiation strategy is positively associated with CSR. Thus, engaging in practices that reflect ethical and discretionary dimensions confer benefits that are likely greater for differentiation than for low-cost strategies. Meta-analyses of the relationship between CSR and financial performance suggest this stems from the uniqueness that underpins perceived high value from the willingness of customers to pay a premium price for products and services (Erdiaw-Kwasie, Alam, & Kabir, Reference Erdiaw-Kwasie, Alam and Kabir2017; Trumpp, Endrikat, Zopf, & Guenther, Reference Trumpp, Endrikat, Zopf and Guenther2015). Our empirical findings are important in that they demonstrate the relationship between strategy and CSR, while responding to calls to empirically study the dimensions of CSR individually (Orlitzky et al., Reference Orlitzky, Louche, Gond and Chapple2017; Reimer, Van Doorn, & Heyden, Reference Reimer, Van Doorn and Heyden2018; Wang et al., Reference Wang, Tong, Takeuchi and George2016).
Second, we offer a theoretical contribution to the stream of research concerning strategy and PM systems. Building on stakeholder theory and the literature on PM systems, we posit that a PM system is a moderating variable that has been overlooked, certainly in the context of strategy and CSR. Firms have a need to consider balancing the interests of multiple stakeholders, tend to operate in complex and competitive markets and must apply organisational resources in dynamic ways to survive and thrive (Teece, Pisano, & Shuen, Reference Teece, Pisano and Shuen1997). Such efforts are neither simple nor linear. In the case of our study, we took the position that for firms to realise success, they need to monitor and control organisational resources and influence employees towards desired behaviours (Kaplan & Norton, Reference Kaplan and Norton2008; Koufteros, Vergheses, & Lucianetti, Reference Koufteros, Vergheses and Lucianetti2014). In this sense, modern PM systems are believed to have influenced corporate outcomes, success and practices in both positive and negative ways (Grant & Visconti, Reference Grant and Visconti2006; Maltz, Shenhar, & Reilly, Reference Maltz, Shenhar and Reilly2003).
We theorised that where firms have PM systems with broad stakeholder focus, this focus is likely to shape the relationship between strategy and CSR. Because stakeholders have varying interests, when PM systems account for a broader stakeholder cohort firms are less likely to focus attention and resources solely on shareholders for the purpose of profit maximisation. Evidence suggests that not all stakeholders care about profits, and that many of their interests align more closely to socially responsible interests (Konrad, Steurer, Langer, & Martinuzzi, Reference Konrad, Steurer, Langer and Martinuzzi2006). Hence, a PM system that accounts for broad stakeholder interests is likely to shape the relationship between strategy and CSR. Our findings suggest that a PM system does positively shape this relationship with respect to both low-cost and differentiation strategies and supports our theoretical postulates.
Our study also offers managerial contributions. CSR is believed to be an important component of firm legitimacy (Brammer, Jackson, & Matten, Reference Brammer, Jackson and Matten2012; Christensen, Mackey, & Whetten, Reference Christensen, Mackey and Whetten2014; Galbreath, Reference Galbreath2009; McWilliams, Siegel, & Wright, Reference McWilliams, Siegel and Wright2006; Short, McKenny, Ketchen, Snow, & Hult, Reference Short, McKenny, Ketchen, Snow and Hult2016). Yet, firms have to cope with competitive markets and difficult decisions and trade-offs in terms of where and how they allocate resources (Parent & Deephouse, Reference Parent and Deephouse2007; Pearce & Doh, Reference Pearce and Doh2005; Porter, Reference Porter1996).
In the case of firms pursuing a low-cost strategy, CSR as conceptualised in this study could be antithetical to such a strategy. More specifically, CSR is not without cost (Hong, Kubik, & Scheinkman, Reference Hong, Kubik and Scheinkman2012; McWilliams & Siegel, Reference McWilliams and Siegel2001; Wood & Jones, Reference Wood and Jones1995), even though minimum expectations may be held by stakeholders and society. Therefore, firms with low-cost strategies may need to carefully scrutinise to what extent they can be successful over the long term without engaging in CSR. Of course, individual managers and executives could have normative reasons for engaging or institutional pressures may be such that completely avoiding CSR is unlikely. In this study, the findings suggest that carefully designed PM systems could help firms with low-cost strategies more readily account for stakeholders and incorporate and demonstrate CSR. Alternatively, firms with differentiation strategies should give deeper consideration to CSR as a means of uniqueness, while relying on PM systems that are broadly stakeholder focused such that they can more thoroughly align organisational resources and employee behaviour with the social outcomes they seek.
Limitations and future research directions
This study is not without limitations. First, the sample is drawn from an Italian cohort of firms. While our sample does advance published studies of CSR, which tend to be dominated by US samples, this single country limits generalisability. Further studies could include other (non-US) countries or a cross-country design. Second, we rely on cross-sectional data. Hence, we are suggesting correlation, not causation. The results must be interpreted in light of this limitation. Future research could employ panel data to enable a greater capacity for capturing the complexity of variable interactions and causal effects than a cross-section. Third, we specifically study CSR as conceptualised by Carroll (Reference Carroll1979, Reference Carroll1991). In this way, our approach is consistent with the literature on the voluntary nature of CSR (Barnett, Reference Barnett2007; Gras & Krause, Reference Gras and Krause2020; Matten, Crane, & Chapple, Reference Matten, Crane and Chapple2003), and enabled us to explore dimensions individually. However, future studies could examine other dimensions such as diversity, the natural environment or human rights. Lastly, a final limitation is that we constructed items to measure a PM system that were specifically tailored to our stakeholder focus. While the results are encouraging, future studies could explore alternative measures. For example, little CSR research includes PM systems such as the Balanced Scorecard, Performance Prism, or even measures based on Baldrige Criteria. Given the importance of PM system use in business today, we encourage future research to more readily incorporate this construct into the empirical analysis.
Conclusion
Business ethicists and strategy scholars have long debated the extent to which firms have social responsibilities (e.g., Andrews, Reference Andrews1971; Carroll & Hoy, Reference Carroll and Hoy1984; Freeman, Reference Freeman1984; Freeman & Gilbert, Reference Freeman and Gilbert1988; Galbreath, Reference Galbreath2009; Hosmer, Reference Hosmer1994; Learned et al., Reference Learned, Christensen, Andrews and Guth1965; Porter & Kramer, Reference Porter and Kramer2002; Sethi & Sama, Reference Sethi and Sama1998). In our study, we sought to determine if Porter's (Reference Porter1980) widely recognised generic strategies effect CSR; namely, ethical and discretionary CSR. A low-cost strategy is negatively associated with the specified practices while a differentiation strategy is positively associated with them. Further, in both cases, a PM system positively moderates these relationships. The findings are important empirically and theoretically. As firms increasingly confront stakeholder expectations for socially responsible behaviour, the findings also offer managerial insights for better alignment between the firm and its stakeholders.