

Introduction
Fruit flies (Diptera: Tephritidae) pose a significant threat to the production and export of fruits and vegetables globally. There are over 4500 species of fruit flies in the world (Drew and Romig, Reference Drew and Romig1997), of which about 5% occur in India (Ramani, Reference Ramani1998). Because tropical Asia possesses a warm and equable climate, it allows for year-round cultivation of fruit and vegetables, which provides an abundant and uninterrupted supply of hosts for fruit flies to breed and multiply rapidly (Vijaysegaran, Reference Vijaysegaran, Allwood and Drew1997). The first detailed report on fruit flies from the Indian subcontinent was by Bezzi (Reference Bezzi1913) who reported 71 species from India, Pakistan, Myanmar, Sri Lanka and Nepal. Drew and Raghu (Reference Drew and Raghu2002) reported 21 species of the genus Bactrocera and seven species of subgenus Zeugodacus from the New Amarambalam forest in the Western Ghats of India. Among the Bactrocera species, Bactrocera dorsalis (Hendel), Bactrocera caryeae (Kapoor), Bactrocera zonata (Saunders) and Bactrocera correcta (Bezzi) are the most important in South India, including the coastal zone of Goa (Verghese and Sudha Devi, Reference Verghese, Sudha Devi, Reddy, Krishna Kumar and Verghese1998; Verghese et al., Reference Verghese, Kamala Jayanthi, Madhura and Nagaraju2002; David et al., Reference David, Kumar and Ramani2008). All these species belong to the B. dorsalis complex, which is one of the key pest groups of Asia and the Pacific (Waterhouse, Reference Waterhouse1997).
Fruit flies of the B. dorsalis complex are important pests in terms of their distribution, wide and diverse host range from several plant families, rapid population build-up and economic damage (White and Elson-Harris, Reference White and Elson-Harris1992). Consequently, this pest complex is now considered one of the most important in world agriculture (Clarke et al., Reference Clarke, Armstrong, Carmichael, Milne, Raghu, Roderick and Yeates2005). Over 200 wild and cultivated hosts have been reported for B. dorsalis alone, an insect native to Asia (Dekker and Messing, Reference Dekker and Messing1995). In India, approximately 2.5–59% of cultivated fruits are partially or completely damaged by fruit flies belonging to the B. dorsalis complex (Verghese et al., Reference Verghese, Kamala Jayanthi, Madhura and Nagaraju2002). Crop losses due to B. correcta in mango from Gujarat, India, were estimated to be highest in the Alphonso variety of mango followed by the Kesar and Dasheri varieties (Kumar and Bhatt, Reference Kumar and Bhatt2002). While several species of fruit fly are permanently present, their seasonal population build-up in India has been shown to coincide with the abundance of mango (Verghese and Sudha Devi, Reference Verghese, Sudha Devi, Reddy, Krishna Kumar and Verghese1998; Sarada et al., Reference Sarada, Maheswari and Purushotham2001).
Patchy dispersion patterns are widespread in ecological systems and may have fundamental significance to the stability of a system on a number of scales. To understand this pattern, however, the degrees of dispersion must be quantified in suitable terms. Spatial distribution is one of the most important ecological properties of a species and yields characteristic parameters that segregate species; these parameters are the population expression of the individual's behaviour (Taylor, Reference Taylor1984). Spatial distribution studies of a pest population serve as a basis for decision making for initiating management strategies in the field (Bechinski and Pedigo, Reference Bechinski and Pedigo1981). Presently, however, there is a paucity of data on the spatial distribution and underlying factors influencing the distribution patterns of the major Bactrocera fruit flies in India. The objective of this study, therefore, was to ascertain the spatial distribution patterns of the economically important Bactrocera fruit flies attracted to methyl eugenol (ME), a male parapheromone lure, in Goa, which may provide an important background for the application of management tools and techniques in this region.
Materials and methods
The study was conducted from April 2006 to March 2008 in three selected villages in three ecological zones. They included the following: the coastal zone, Old Goa (15°29′53″N; 73°54′59″E); undulating midland zone, Keri (15°27′16″N; 73°59′49″E) and mountainous upland, Molle (15°21′37″N; 74°14′39″E), which are 10, 25 and 50 km to the east from the coastline of the Arabian Sea and at an elevation of 15, 70 and 100 m above mean sea level, respectively (Garmin GPS 12). The three zones selected for the study were distinct in their ecologies and farming systems. The coastal region consists of mainly paddy fields, coconut plantations and homestead mango groves, whereas the midland region comprises mostly plantains, areca nut, coconut, cashew and mango plantations, while the upland region is mainly forest. Standard water bottle traps loaded with ME were used for trapping the fruit flies in the above-mentioned zones. The lure was prepared by soaking plywood squares of approximately 5 × 5 × 1.2 cm overnight in a mixture of ethanol, ME and 0.1% malathion 50EC in a ratio of 6:4:1 by volume. Thereafter, these squares were placed in the bottle traps. The traps were fabricated using disposable plastic water bottles (1 l). Each trap had four windows (1 inch square) cut open just below the shoulder of the bottle as recommended by the Indian Institute of Horticultural Research, Bangalore (Verghese et al., Reference Verghese, Sreedevi, Sudha Devi, Nagaraju and Jayanthi Mala2006). To facilitate recording of data with respect to the flies captured, the bottom of the bottle trap was cut and reversed into the open lower end of the bottle. This also facilitated easy disposal of rain water while recording weekly observations on fly captures. In each of the above-mentioned villages, a total of eight ME traps were used and placed 1 km apart at a height of approximately 1.5–2 m on trees. The ME-charged plywood blocks are reported to be effective for 2 months (Sisodiya et al., Reference Sisodiya, Jhala, Stonehouse, Verghese and Mumford2005). Hence lures were replaced every 60 days to maintain the efficacy of the trapping system. The captured fruit flies were recorded and identified up to the species level using morphological features based on the identification keys provided by Drew and Raghu (Reference Drew and Raghu2002), Drew and Romig (Reference Drew and Romig2007) and Madhura and Verghese (Reference Madhura and Verghese2004). Voucher specimens of captured flies are preserved in the Plant Protection Laboratory at ICAR Research Complex for Goa, Old Goa, India. Furthermore, data on monthly captures of fruit flies trapped from April 2006 to March 2008 in the three ecological zones of Goa were used to compute the spatial distribution of each species. The dispersion parameters were computed based on the following eight tests as suggested by Southwood (Reference Southwood1978).
(1) Mean–variance test
The mean  and variance (S 2) for monthly fruit fly captures were calculated after arranging the data into frequency distribution tables, and they were compared to establish the distribution. When
 , it indicates aggregation, when
 , the distribution of the population is uniform and when
 , it indicates random or Poisson distribution.
(2) Dispersion parameter ‘K’
The parameter K (Elliott, Reference Elliott1979) measures the degree of aggregation. This was computed using the following formula:

(3) Common ‘K’
Further, the common K (K c) was calculated using the moment and regression method of Bliss and Owen (Reference Bliss and Owen1958), and is given by the formula:

The common K is a representative dispersion parameter for the entire period of the study.
For the above K estimates (dispersion parameter K and common K), a value of less than eight indicates aggregation, while values of more than eight signify random or Poisson distribution.
(4) Variance to mean ratio or index of dispersion (I)
This ratio was used because it is the most fundamental of all the aggregation indices (Taylor, Reference Taylor1984). This index often departs from unity and is based on the equality of variance and mean in a Poisson series (Patel and Stiteler, Reference Patel and Stiteler1974). It was calculated using the formula:

where S 2 the variance and  is the mean.
A value of greater than one implies aggregation or contagious distribution, while a value of zero implies regular distribution.
(5) Cole's index (I) of dispersion
When Cole's index value is greater than the value of maximum regularity (1/n) and randomness  , then it indicates aggregative nature of dispersion. This index was developed by Cole (Reference Cole1946) to study the dispersion of population in nature, and is based on the formula:

(6) David and Moore's index
This index was computed by the formula  , where values greater than zero indicate aggregation (David and Moore, Reference David and Moore1954).
(7) Lloyd's index of mean crowding (X*)
When values for this index (Lloyd, Reference Lloyd1967) depart from the Poisson series, it indicates aggregation. This index provides a degree of crowding experienced by the individuals, and is worked out using the formula:

(8) Morisita's index
Morisita's index (Reference Morisita1962) of dispersion was computed using the formula:

An index greater than unity indicates aggregation.
Results
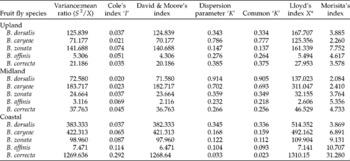
Five fruit fly species were recorded from the ME-baited traps during this study, including B. dorsalis, B. caryeae, B. zonata, B. affinis and B. correcta. Among these, B. dorsalis and B. caryeae were the most dominant species in Goa region. The spatial distribution of the above species in all the three zones revealed that the variance was more than one mean, indicating aggregation of the population (Table 1). The variance to mean ratio of all the fly species ranged from 3.12 (B. affinis: midland) to 1269.64 (B. correcta: coastal) (Table 2), which indicates clumping of the population.
Mean (±SE) and variance for ME-attracted Bactrocera flies in three ecological zones of Goa, India, between April 2006 and March 2008

ME, methyl eugenol.
Dispersion indices for Bactrocera species attracted to methyl eugenol

The values for Cole's index ranged from 0.02 (B. dorsalis: midland) to 0.29 (B. correcta: coastal) (Table 2). These values were greater than the corresponding values of maximum regularity (0.009) and randomness, indicating a contagious type of spatial distribution. David & Moore's index was also used to study the spatial distribution of the major ME-attracted fruit flies in the region and was found to be greater than 0, ranging from 2.12 (B. affinis: midland) to 1268.64 (B. correcta: coastal), indicating aggregation of the population.
Furthermore, with regard to the dispersion parameter ‘K’, the values were less than eight, ranging from 0.03 (B. correcta: coastal) to 0.92 (B. dorsalis: midland). Also, the common K values were less than eight, varying from 0.02 (B. correcta: coastal) to 0.90 (B. dorsalis: midland).
Lloyd's index values varied from 5.49 (B. affinis: upland) to 1310.15 (B. correcta: coastal). Morisita's index ranged from 2.08 (B. dorsalis: midland) to 31.28 (B. correcta: coastal) (Table 2).
Discussion
Spatial patterns can be used to describe the spatial distribution of individuals within populations and to develop testable hypotheses about the underlying processes responsible for generating these patterns. The results presented above with regard to estimates of variance, mean and other dispersion parameters show that the major Bactrocera fruit flies attracted to ME in different ecological zones of Goa followed the negative binomial series. Insect populations are known to follow three distinct distribution patterns (Southwood, Reference Southwood1978), viz. (i) binomial, uniform or regular, (ii) random or Poisson and (iii) negative binomial, aggregated or clumped. Spatial patterns of a population can deviate from randomness in two directions: if the presence of an individual at one point increases the probability of another individual being nearby, then the spatial pattern will be clumped, whereas if it decreases, the pattern will be more uniform than random (Ruesink and Kogan, Reference Ruesink, Kogan, Metcalf and Luckman1974). A clumped dispersion of adult populations of tephritids is a rather common occurrence under certain conditions. For instance, Zalucki et al. (Reference Zalucki, Drew and Hooper1984) reported clumped dispersion of trap catches of adults of many tephritid fruit fly species. Reports from Australia also revealed that Bactrocera tryoni (Froggatt) and Bactrocera papaya (Drew and Hancock) had a high degree of clumping, particularly at low density during eradication (Meats, Reference Meats2007).
The variance to mean ratio was more than one, which indicated aggregation or clumping of the population. If this ratio is zero it indicates that the distribution pattern is regular, while a value greater than one indicates aggregation or contagious distribution (Patel and Stiteler, Reference Patel and Stiteler1974). Young and Young (Reference Young and Young1998) reported that as the variance to mean values increase, there is a decrease in aggregation. In general, lower variance to mean values were recorded in the coastal zone, indicating a higher degree of aggregation at the coast compared with the midland and upland. However, the extent of aggregation was found to be species specific. For B. dorsalis, variance to mean ratio was least (72.58) in the midland, while for B. caryeae, this ratio was least (71.18) in the upland. The relationship between variance and mean permits the prediction of variance for estimated mean, which in turn allows the development of threshold based on sequential sampling procedures for devising management strategies in the field (Binns and Nyrop, Reference Binns and Nyrop1992).
Also, Cole's index and David & Moore's index in the three zones were greater than the corresponding values of maximum regularity and randomness and more than zero, respectively, indicating that the fruit fly population in this study was aggregated. These indices have been used in the spatial analysis of other insect populations, including the diamondback moth Plutella xylostella (Linnaeus) on cabbage and the red palm weevil Rhynchophorus ferrugineus (Olivier) on coconut in India (Reddy et al., Reference Reddy, Singh, Reddy and Goud1996; Faleiro et al., Reference Faleiro, Ashok Kumar and Rangnekar2002), and they have been found to predict their distribution patterns accurately. This trend of non-randomness shown by insects can be due to active aggregation or some heterogeneity of the environment (Bartlett, Reference Bartlett1975; Southwood, Reference Southwood1978). Factors such as adult behaviour, availability of a food resource, avoidance of natural enemies and environmental thermal regimes might have played a role in affecting the observed spatial distribution of the fruit flies in the Goa region.
Furthermore, the dispersion parameter K and common K values for all the fly species in the three ecosystems were less than eight, which signifies clumping or aggregation. The dispersion parameter K value for B. dorsalis was higher in the midland (0.91) compared with the coast (0.34) and the upland (0.34), indicating stronger aggregation in the midland region. In the case of B. caryeae, the dispersion parameter values decreased from upland to the coastal region, indicating strong aggregation in the latter. The use of this test to ascertain the distribution patterns of different insect pests in diverse agro-ecosystems is well documented, for instance in R. ferrugineus, the brown planthopper Nilaparvata lugens (Stål) and the okra leafhopper Amrasca biguttula biguttula (Ishida) in coconut, rice and okra, respectively (Faleiro et al., Reference Faleiro, Rai and Vasisht1982; Rai et al., Reference Rai, Faleiro and Vasisht1982; Kumar, Reference Kumar1996).
As regards Lloyd's index (Lloyd, Reference Lloyd1967), the values departed from the Poisson series, which again confirmed that the fruit fly population was aggregated in the three ecological zones and followed the negative binomial series. Pandey et al. (Reference Pandey, Dwivedi, Ahmed and Ahmed2008) studied the distribution of the onion thrips Thrips tabaci (Lindeman) using Lloyd's index, and they were able to describe the spatial pattern of the insect precisely.
Furthermore, Morisita's index (Reference Morisita1962) in the upland, midland and coastal ecosystems was found to be greater than unity (one), confirming that the ME-attracted fruit fly population in this study was aggregated and followed the negative binomial distribution pattern.
Our results show that the spatial distribution of major fruit flies attracted to ME-baited traps follows the negative binomial series in the three studied ecological zones of Goa. The extent of aggregation, however, varied among the different fruit fly species recorded in these zones, which could be due to the difference in the microhabitats, and the geography and natural fauna of the zones. Fruit flies are known to adjust their foraging behaviour in response to the changes in the spatial, temporal and seasonal distributions of food and other resources (Hendrichs et al., Reference Hendrichs, Katsoyannos, Papaj and Prokopy1991).
We conclude that the population of major Bactrocera species attracted to ME in the Goa region follows the negative binomial distribution pattern. These results have implications in developing suitable threshold-based decision-making sampling procedures for the management of fruit flies in Goa that would help minimize the use of insecticides.
Acknowledgements
The authors wish to acknowledge the institutional support provided by ICAR Research Complex for Goa, Old Goa, India, and the Agricultural and Processed Food Product Export Development Authority, India. They also thank two anonymous referees for their helpful comments on the earlier versions of the manuscript.