INTRODUCTION
Nosema ceranae is a highly prevalent honeybee parasite worldwide (Higes et al. Reference Higes, Martín-Hernández and Meana2010). Its suggested involvement as one of the multiple factors causing the recent large-scale die-offs of honeybees in the northern hemisphere (or honeybee colony losses phenomenon, according to the nomenclature proposed by the COLOSS network; http://www.coloss.org/network) is still a matter of debate (Botías et al. Reference Botías, Martín-Hernández and Barrios2013; Villa et al. Reference Villa, Bourgeois and Danka2013; and Dainat et al. Reference Dainat, Evans, Chen, Gauthier and Neumann2012a , Reference Dainat, Evans, Chen, Gauthier and Neumann b , for a different point of view).
Epidemiological data for this pathogen, which was identified in Apis mellifera, approximately a decade ago (Higes et al. Reference Higes, Martín and Meana2006), suggests the recent horizontal transmission of this parasite from its original host, the Asian honeybee (Apis cerana) (Fries et al. Reference Fries, Feng, Da Silva, Slemenda and Pieniazek1996), followed by a rapid spread all over the world (Klee et al. Reference Klee, Besana, Genersch, Gisder, Nanetti, Tam, Chinh, Puerta, Ruz, Kryger, Message, Hatjina, Korpela, Fries and Paxton2007; Martín-Hernández et al. Reference Martín-Hernández, Meana, Prieto, Salvador, Garrido-Bailón and Higes2007; Botías et al. Reference Botías, Martín-Hernández, Garrido-Bailón, González-Porto, Martínez-Salvador, De la Rúa, Meana and Higes2012).
Several authors have proposed that the heterogeneous levels of virulence and pathological effects among different N. ceranae field strains could be associated with the genotypic diversity of the parasite (Huang et al. Reference Huang, Bocquet, Lee, Sung, Jiang, Chen and Wang2008, Reference Huang, Kryger, Le Conte and Moritz2012; Genersch, Reference Genersch2010). To test this hypothesis, the levels of polymorphism within this species must first be evaluated (Higes et al. Reference Higes, Meana, Bartolomé, Botías and Martín-Hernández2013), since data on the genetic variability of this pathogen are scarce.
So far, most molecular studies have been focused on the analysis of the ribosomal DNA subunits (Higes et al. Reference Higes, Meana, Bartolomé, Botías and Martín-Hernández2013). However these loci are present in multiple and different copies in the N. ceranae genome (Sagastume et al. Reference Sagastume, Del Aguila, Martín-Hernández, Higes and Henriques-Gil2011), which complicates the assessment of the nucleotide diversity within this species (for which single copy genes are better suited).
In this work we analysed the levels of polymorphism in N. ceranae at three single copy loci used as molecular genetic markers in different microsporidian species (Peyretaillade et al. Reference Peyretaillade, Broussolle, Peyret, Metenier, Gouy and Vivares1998; Hirt et al. Reference Hirt, Logsdon, Healy, Dorey, Doolittle and Embley1999). Specifically, the genes encoding for Actin, the 70 kDa heat shock protein (Hsp70) and the small subunit of the RNA polymerase II (RPB1).
MATERIALS AND METHODS
Total DNA was extracted from homogenates of 15–20 A. mellifera worker honeybees, naturally infected with N. ceranae, from three honeybee colonies: 440 (Hungary), 1251 (Hawaii) and 1324 (Hawaii). The extraction was performed according to the methodology described in Botías et al. (Reference Botías, Martín-Hernández, Garrido-Bailón, González-Porto, Martínez-Salvador, De la Rúa, Meana and Higes2012) using a BioSprint™ 96 DNA Blood Kit (QIAgen, Izasa, Barcelona, Spain) in a BioSprint 96 robot. Nosema ceranae was confirmed by PCR (Martín-Hernández et al. Reference Martín-Hernández, Botías, Bailón, Martínez-Salvador, Prieto, Meana and Higes2012). Negative controls were included in each DNA extraction.
The single-copy nature of Actin, Hsp70 and RPB1 was checked running Blastp, using as query the amino acid reference sequence of each of them (XP_002995436.1, XP_002995428.1 and XP_002995402, respectively) against the N. ceranae BRL01 genome. A single hit of 100% coverage and 100% identity was found for each gene. Sequences annotated with the same name in the N. ceranae BRL01 genome (Supplemental File S1 of Cornman et al. Reference Cornman, Chen, Schatz, Street, Zhao, Desany, Egholm, Hutchison, Pettis, Lipkin and Evans2009), exhibited only partial coverage and low similarity (Supplemental Table 1S – in Online version only) proving that they are highly divergent sequences, that are also present as single copy-genes in other microsporidian genomes (where they are annotated with different names).
Primers were designed with Primer Blast (http://www.ncbi.nlm.nih.gov/tools/primer-blast/index.cgi?LINK_LOC=BlastHome) using as query the nucleotide reference sequences of Actin (XM_002995390), Hsp70 (Accession number XM_002995382) and RPB1 (XM_002995356) from N. ceranae BRL01. Three pairs of primers, ACT-F (5′-AATGGTAGGTATGGGTCAA-3′) and ACT-R (5′-TTTCTTTCAGCAGGTGTTA-3′), Hsp70-F (5′-CGAAGAAGGTGGTAGAACT-3′) and Hsp70-R (5′-AGAGGTAGAAAAACTGTG-3′) and RPB1nc-F (5′-ACTTCTTGTTCCTCCACCAT-3′) and RPB1nc-R (5′-GATTTGCTTTCCTGTCCATA-3′), were selected for the specific amplification of Actin, Hsp70 and RPB1, respectively.
PCRs were performed using the Expand High FidelityPLUS PCR System (Roche Diagnostics, San Cugat del Valles, Barcelona, Spain), which has 3′-5′ ‘proofreading’ exonuclease activity, following the manufacturer's instructions. Standard PCR amplification included 35 cycles at 55 °C. PCR products were checked, purified with the QIAquick PCR Purification Kit in a QIAcube robot (QIAgen, Izasa, Barcelona, Spain) and cloned with TOPO TA Cloning® kit (Invitrogen, Life Technologies S.A., Alcobendas, Madrid, Spain), following the manufacturer's instructions. Plasmids were purified using the QIAprep Spin Miniprep Kit (QIAgen, Izasa, Barcelona, Spain) and both strands were sequenced with M13 primers on an automated ABI3730XL sequencer using Big Dye (Applied Biosystems, Foster City, CA, USA). Sequences were checked for accurate base calling using CodonCode Aligner (CodonCode Corporation, Dedham, MA, USA) and aligned with MUSCLE (Edgar, Reference Edgar2004) with their reference sequence to determine the nucleotide positions at each locus. The alignments were manually corrected with BioEdit (Hall, Reference Hall1999) and the sequences submitted to GenBank (accession numbers KF002411- KF002483).
Nucleotide diversity in N. ceranae was estimated at synonymous and nonsynonymous sites by means of the π (Nei, Reference Nei1987) and θ W (Watterson, Reference Watterson1975) statistics, applying the Jukes–Cantor (JC) correction (Jukes and Cantor, Reference Jukes and Cantor1969). The first one, π corresponds to the average proportion of nucleotide differences between two sequences (Nei, Reference Nei1987) and the second, θ W, measures the levels of synonymous variability taking into account the total number of segregating sites (Watterson, Reference Watterson1975). These are complementary measures, since π is sensitive to the frequency of polymorphisms (giving lower weight to rare polymorphisms and higher to high frequency polymorphisms) while θ W is independent of their frequency. The Tajima's D (Tajima, Reference Tajima1989) test statistic compares the values of π and θ W to determine whether the sequence variants are in mutation-drift equilibrium (assuming no recombination). Under the neutral equilibrium hypothesis, both parameters (π and θ W) should be nearly equal and D close to 0.
Three statistics were used to describe the genetic differences among Nosema populations: K* ST (Hudson et al. Reference Hudson, Boos and Kaplan1992), S nn (Hudson, Reference Hudson2000) and Fs (Fu, Reference Fu1997). All these calculations were performed with the aid of DnaSP v5.10.02 (Librado and Rozas, Reference Librado and Rozas2009).
The program MLHKA (Wright and Charlesworth, Reference Wright and Charlesworth2004) performs a maximum likelihood version of the HKA test (Hudson et al. Reference Hudson, Kreitman and Aguade1987), which was used to compare the relative amounts of within and between-species synonymous variation at RPB1 and the two other loci. Orthologous sequences from Vairimorpha necatrix were used to obtain the required divergence data. Average non-synonymous divergence (d N) between N. ceranae and V. necatrix sequences was of the order of 0·10 (data not shown), as estimated by the method of Yang and Nielsen (Reference Yang and Nielsen2000) implemented in PAML (Yang, Reference Yang2007).
The population scaled recombination rate (ρ = 4N e r) was measured applying the composite-likelihood method (Hudson, Reference Hudson2001) using a finite site model as implemented in LDhat v2.2. (McVean et al. Reference McVean, Awadalla and Fearnhead2002). The hypothesis of no recombination (ρ = 0) was tested with this software by means of a permutation test. The program RecMin was used to calculate a lower bound on the number of recombination events required to construct any history of a sample (R h), under the assumption that each segregating site has mutated only once since the most recent common ancestor of the sample (Myers and Griffiths, Reference Myers and Griffiths2003; http://www.stats.ox.ac.uk/~myers/RecMin.html).
RESULTS
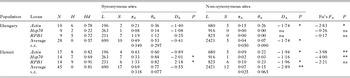
All N. ceranae isolates presented substantial levels of genetic variation at the three loci analysed. Estimates of the pairwise number of synonymous nucleotide substitutions per synonymous site (π S) pooled across loci were 0·50%±0·353, 0·64%±0·398 and 0·85%±0·295 (average±s.e.) for samples 440, 1251 and 1324, respectively. The locus RPB1 exhibited the highest level of synonymous variation in the three isolates. Average π S at this locus was four times larger than at the other two loci, 1·36 vs 0·33 and 0·31%. Nucleotide variation was also detected at non-synonymous positions of the three loci, although at lower levels. In contrast to what was observed at synonymous sites, non-synonymous variation was lower at Hsp70 than at Actin or RPB1 (mean π A = 0·013, 0·113 and 0·070%, respectively).
The levels of diversity also varied across populations. The Hungarian (represented by isolate 440) was less diverse than the Hawaiian population (weighted average π S = 0·49%±0·349 and 0·69±0·318, respectively; pooled data across loci in Table 1). Although these differences were not statistically significant, they point toward the existence of differences in the levels of genetic variation across N. ceranae populations worldwide. The mean within-population diversity can be taken as an estimate of the overall synonymous diversity (0·60%±0·333). Interestingly, a very similar result was obtained from the pooled set of sequences (0·62%±0·314). Such a good agreement between these alternative measures could be taken as evidence against the accumulation of genetic differences between the two populations.
Nucleotide diversity in N. ceranae

N: number of sequences; L, number of sites; S, number of polymorphic sites; π S and π A, pairwise nucleotide diversity at synonymous and non-synonymous sites expressed as percentage, respectively; θ WS and θ WA, nucleotide site variability based on the number of synonymous and non-synonymous segregating sites expressed as percentage, respectively; D S and D A , Tajima's D at synonymous and non-synonymous sites, respectively; s.e.: standard error; P, statistical significance; ns: non-significant; *: P<0·05, **: P<0·01, ***: P<0·001.
In order to further test this hypothesis, two different methods were used. The K* ST test (Hudson et al. Reference Hudson, Boos and Kaplan1992), which quantifies the amount of within-deme nucleotide diversity relative to the overall diversity, produced values of 0·012, 0·008 and −0·015, for Actin, Hsp70 and RPB1, respectively. The second test, S nn, which measures how often related sequences are found in the same deme, showed values of 0·576, 0·477 and 0·493, for Actin, Hsp70 and RPB1, respectively. None of the deviations detected by either test departed significantly from expectations assuming that there is no population differentiation, which suggests that there is a high rate of genetic flow between them, that they have a very recent origin in a common ancestral population, or both.
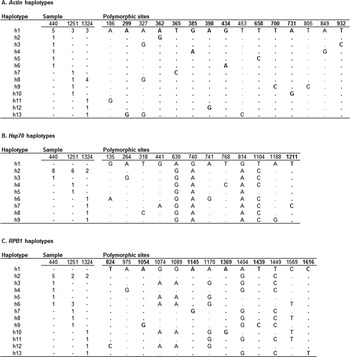
The distribution of allelic variants between two populations might provide a further insight into this question. As shown in Fig. 1, the two populations shared the most common haplotype at each locus (h1 in Actin and Hsp70 and h2 in RPB1). Contrastingly, 29 out of 30 of the remaining haplotypes were unique to either population (with the exception of h6 at RPB1). Furthermore, most of the nucleotide changes that define the different haplotypes were found only once in the sample, which means that most of these variants segregate at low frequencies in the two populations. This phenomenon can be analysed by means of the Fu's F S test statistic (Fu, Reference Fu1997), which is a function of S’, the probability of having no fewer than the observed number of alleles in a random sample from a population in neutral equilibrium, given the observed nucleotide diversity (π). F S values were negative for the three loci in the two populations, and reached statistical significance in the case of Actin and Hsp70, suggesting that there are more different haplotypes than those expected under neutrality (Table 1). This is consistent with an excess of low frequency mutations, which is supported by the negative values of the Tajima's D in most loci and populations (Table 1).
Actin, Hsp70 and RPB1 haplotypes from N. ceranae showing only the polymorphic sites. Haplotypes were generated with DnaSP using clones from isolates 440 (Hungary), 1251 and 1324 (Hawaii). (A) Actin haplotypes; h1 includes the Actin reference sequence from N. ceranae BRL01 (XM_002995390). (B) Hsp70 haplotypes; h1 corresponds to the Hsp70 reference sequence from N. ceranae BRL01 (XM_002995382). (C) RPB1 haplotypes, h1 corresponds to the RPB1 reference sequence from N. ceranae BRL01 (XM_002995356). The number of clones from each isolate is shown. Non-synonymous changes are typed in bold.

However, it should be noted that RPB1 displayed a different pattern, with non-significant F S values and positive Tajima's D in the two populations, which were statistically significant in Hawaii. As depicted in Fig. 1C, this can be attributed to the presence of six synonymous variants at positions 1074, 1089, 1170, 1404, 1449 and 1569 segregating at intermediate frequencies in the two populations. To check if the observed higher levels of polymorphism and excess of high frequency variants at RPB1 differed significantly from the patterns at the two other loci we applied a maximum likelihood version of the HKA test (Wright and Charlesworth, Reference Wright and Charlesworth2004). The test results were consistent with the hypothesis that there is a significant excess of synonymous diversity at RPB1 relative to expectations assuming the same ratio of polymorphism and divergence at all loci (LRT = 9·61, P = 0·019).
The six synonymous variants mentioned above, tend to co-segregate in our samples, although linkage disequilibrium seems to weaken with distance between sites. This pattern can be used to infer the existence of genetic recombination (McVean et al. Reference McVean, Awadalla and Fearnhead2002). In fact, RPB1 showed at least two recombination events (R h = 2; Myers and Griffiths, Reference Myers and Griffiths2003) and the estimated population scaled recombination rate at this locus was significantly greater than zero in our dataset (4N e r = 9; P<0·05 in a permutation test), which suggests that some of the haplotypes detected might have been originated by recombination events.
DISCUSSION
Since the identification of N. ceranae in A. mellifera (Higes et al. Reference Higes, Martín and Meana2006) very few studies have focused on the intraspecific variability of this pathogen (Hatjina et al. Reference Hatjina, Tsoktouridis, Bouga, Charistos, Evangelou, Avtzis, Meeus, Brunain, Smagghe and De Graaf2011; Sagastume et al. Reference Sagastume, Del Aguila, Martín-Hernández, Higes and Henriques-Gil2011). In addition, most work analysing the diversity of this parasite have been invalidated by the application of inadequate technologies, such as the use of direct sequencing of PCR products (that overlooks the presence of different variants within an isolate) (Chaimanee et al. Reference Chaimanee, Chen, Pettis, Scott Cornman and Chantawannakul2011), or the analysis of genes harbouring heterogeneous multiple copies, like the widely used rDNA, which can undermine the evaluation of the real levels of polymorphism (Higes et al. Reference Higes, Meana, Bartolomé, Botías and Martín-Hernández2013). A detailed description of the patterns of genetic variation of this parasite within and between honeybee colonies is badly needed in order to understand its likely impact in the Western honeybee populations worldwide. Here, we report estimates of nucleotide diversity in single copy genes of N. ceranae by applying population genetics statistics.
Substantial levels of genetic polymorphism were detected in three N. ceranae isolates from two distant populations (Hungary and Hawaii), suggesting that honeybee colonies are usually infected by a variety of Nosema lineages. Within-isolate diversity was already inferred for the N. ceranae rDNA (Sagastume et al. Reference Sagastume, Del Aguila, Martín-Hernández, Higes and Henriques-Gil2011) or the locus encoding the polar tube protein 3 (PTP3) (Hatjina et al. Reference Hatjina, Tsoktouridis, Bouga, Charistos, Evangelou, Avtzis, Meeus, Brunain, Smagghe and De Graaf2011) and was recently proved by Roudel et al. (Reference Roudel, Aufauvre, Corbara, Delbac and Blot2013), who also reported significant levels of within-isolate genetic diversity at 10 different genomic loci while this manuscript was under review. The fact that π A is much lower than π S in the three isolates suggests that purifying selection in this species is capable of removing deleterious mutations, which are expected to occur more frequently at non-synonymous sites. This implies that the three loci studied here are fully functional.
One possible explanation of such high levels of diversity in the three Nosema isolates could be due to the presence of multiple copies of these genes in this organism, as recently suggested for the RPB1 locus in Nosema bombycis (Ironside, Reference Ironside2013). However, the compact genome of N. ceranae (9.8 Mbp; Cornman et al. Reference Cornman, Chen, Schatz, Street, Zhao, Desany, Egholm, Hutchison, Pettis, Lipkin and Evans2009), smaller than that of N. bombycis (15.33 Mbp; Ironside, Reference Ironside2013), makes it unlikely that there are multiple copies of all three loci. Furthermore the three genes here studied have been found in a single copy in the N. ceranae genome published in Genbank (N. ceranae BRL01, Cornman et al. Reference Cornman, Chen, Schatz, Street, Zhao, Desany, Egholm, Hutchison, Pettis, Lipkin and Evans2009; this work Supplemental Table 1S – in Online version only) as well in other microsporidia (Peyretaillade et al. Reference Peyretaillade, Broussolle, Peyret, Metenier, Gouy and Vivares1998; Hirt et al. Reference Hirt, Logsdon, Healy, Dorey, Doolittle and Embley1999; this work Supplemental Table 1S).
On the other hand, the presence of two nuclei in N. ceranae could also contribute to increase such levels of polymorphism by the presence of different variants of a given locus in each nuclei, as was identified for the rRNA in Nosema bombi (O'Mahony et al. Reference O'Mahony, Tay and Paxton2007). However, this is not sufficient to explain the whole diversity observed, as the two nuclei are haploid, which would only allow for two alternative copies of a gene within a single spore.
Alternatively, a more plausible explanation is the existence of different N. ceranae strains in the field, which could co-infect honeybee colonies. The diversity in our samples, which derive from a pool of 15–20 honeybees from the same colony, suggests that different N. ceranae strains could be co-existing within a single colony. This might have important implications for the epidemiology of the infection, as it raises the possibility that the composition of N. ceranae populations could change in the honeybee colonies over time. Investigation on these lines could lead to the association of certain N. ceranae strains with the conditions in which the colony is involved (i.e. the climate, presence of other pathogens or pesticides).
Our data also indicate that the Hawaiian population is slightly more variable than the one from Hungary, although we did not find significant evidence for differentiation between them at the nucleotide sequence level (results from the K* ST and S nn tests). These observations, together with the large number of haplotypes detected, in excess of the neutral mutation expectations (negative Fu's F S for most loci and populations), could be reconciled with the hypothesis that the N. ceranae populations found worldwide in A. mellifera have a very recent origin, which probably derives from a single ancestral population in some other host (most likely the Asian honeybee A. cerana (Botías et al. Reference Botías, Martín-Hernández, Garrido-Bailón, González-Porto, Martínez-Salvador, De la Rúa, Meana and Higes2012)). Similarly, the two populations share the most frequent haplotypes at each locus (Fig. 1) suggesting that they might have a recent common origin (Roudel et al. Reference Roudel, Aufauvre, Corbara, Delbac and Blot2013).
The above scenario is consistent with the data obtained from Actin and Hsp70 but, in principle, it seems contradictory with the patterns described for RPB1: (i) it displayed significantly higher levels of synonymous diversity than the other loci (as revealed by the MLHKA test), (ii) variants of RPB1 were found to segregate at higher frequencies than expected under neutral mutation-drift equilibrium, and (iii) this locus did not show a significant excess of haplotypes (non-significant Fu's F S statistics in either population). In fact, these observations could be taken as evidence for some form of balancing selection operating at this locus. However, there are reasons to be cautious about the nature of these patterns. First, the MLHKA test relies on accurate estimates of the number of nucleotide changes at synonymous sites, but the high differentiation (average d S across loci = 3·93) between N. ceranae and V. necatrix, the closest relative with available sequence data, and the difficulty of accurately correcting for multiple hits, means that this result should be taken with care. And second, the hypothesized recent horizontal transfer of N. ceranae to A. mellifera is likely to have been accompanied by a bottleneck, such that it is difficult to discern whether these patterns have a selective or a stochastic origin. Further work should be done in order to clarify these issues.
It is also worth noting that significant evidence of genetic recombination was detected. This suggests that N. ceranae may experience a meiotic phase during its life cycle, in contradiction with previous data (Ironside, Reference Ironside2007; Lee et al. Reference Lee, Corradi, Byrnes, Torres-Martinez, Dietrich, Keeling and Heitman2008). Briefly, Nosema enters the host via the food channel as an infectious diplokaryon spore. In the gut, the spore attaches to the epithelial cells and the sporoplasm is injected into the cytoplasm, where it reproduces through a series of asexual divisions of both haploid nuclei to give rise to a merogonial plasmodia with up to four diplokarya (proliferative phase) (Higes et al. Reference Higes, Martín and Meana2006). At some point, these merogonia experience a further cell division to produce binucleate spores. Epithelial cells eventually burst releasing the spores into the intestinal lumen (which are excreted with the feces). No gametogenesis stage has been so far described in this organism, although some authors have suggested the existence of cryptic sexual reproduction in this (Sagastume et al. Reference Sagastume, Del Aguila, Martín-Hernández, Higes and Henriques-Gil2011) and other Nosema species (Ironside, Reference Ironside2013). Wittner and Weiss (Reference Wittner and Weiss1999) postulated that genetic exchange may occur during the transition from one phase to another, but there is no evidence of communication between nuclei by electron microscopy at any stage of the parasite's life cycle.
SUPPLEMENTARY MATERIAL
To view supplementary material for this article, please visit http://dx.doi.org/10.1017/S0031182013001790.
ACKNOWLEDGEMENTS
The authors wish to thank C. Uceta, V. Albendea, C. Rogerio, T. Corrales and M. Gajero for their technical support and to E. Villalobos and T. Czsaki for providing samples; they also thank the anonymous reviewers for their valuable comments and suggestions to improve the quality of the paper.
FINANCIAL SUPPORT
This work was supported by Junta de Comunidades de Castilla-La Mancha (Consejería de Agricultura) and INIA-FEDER funds (RTA2009-00057).